Nifty This Month FUT Entry @ 24880 to 920
SL 24800
Target 25140 (B) and 25350 (C)
Final Target 25700 to 740
Ratio 1:5 and 1:10
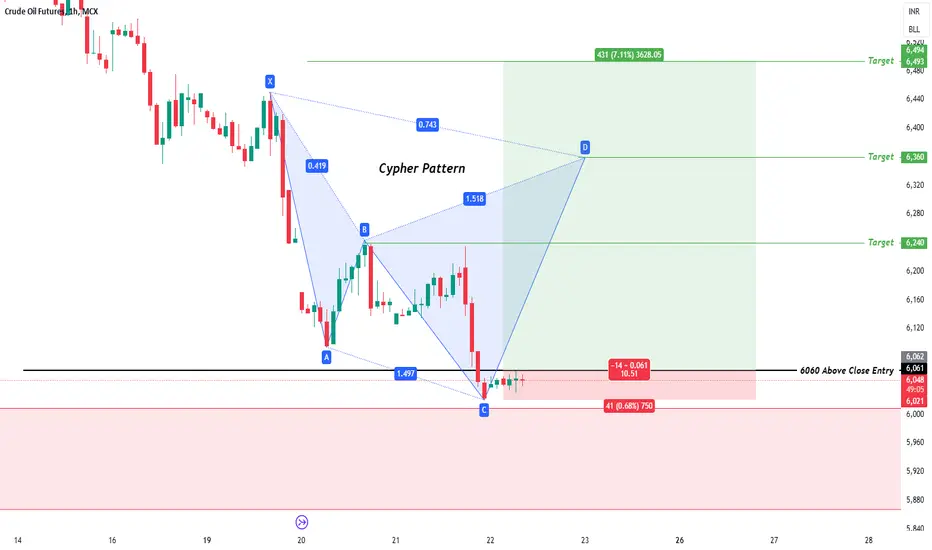
SL 1Hr candle close only, Target Trigger Price
All detail for chat. good entry at mark price only. and must stoploss minimum risk and good profit. risk ratio 1:1 to manage modified SL. This is not call, Just my idea. Please understand your risk and take full responsibility of your actions
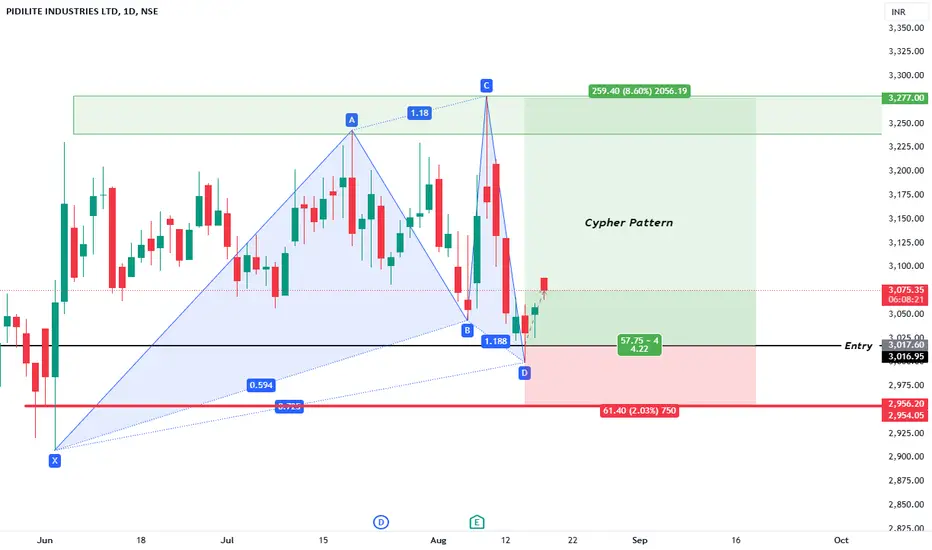
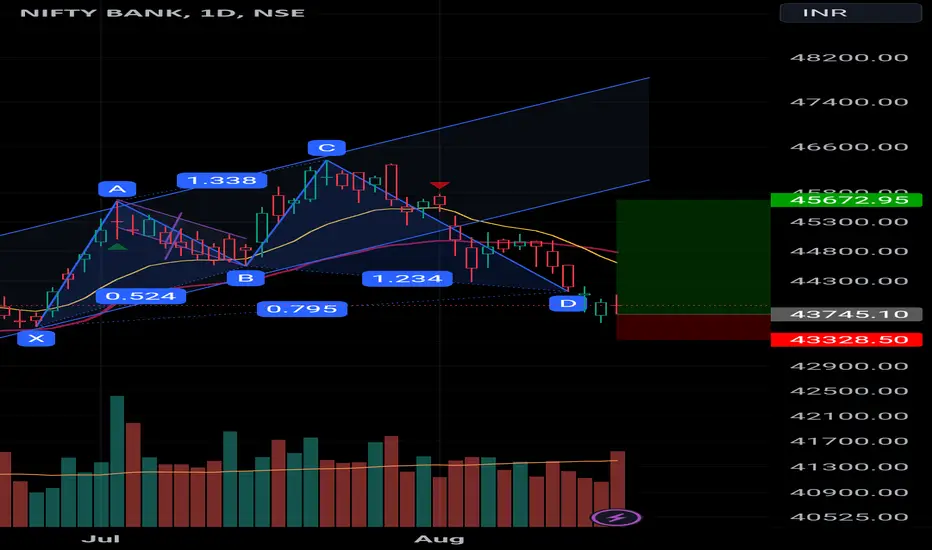
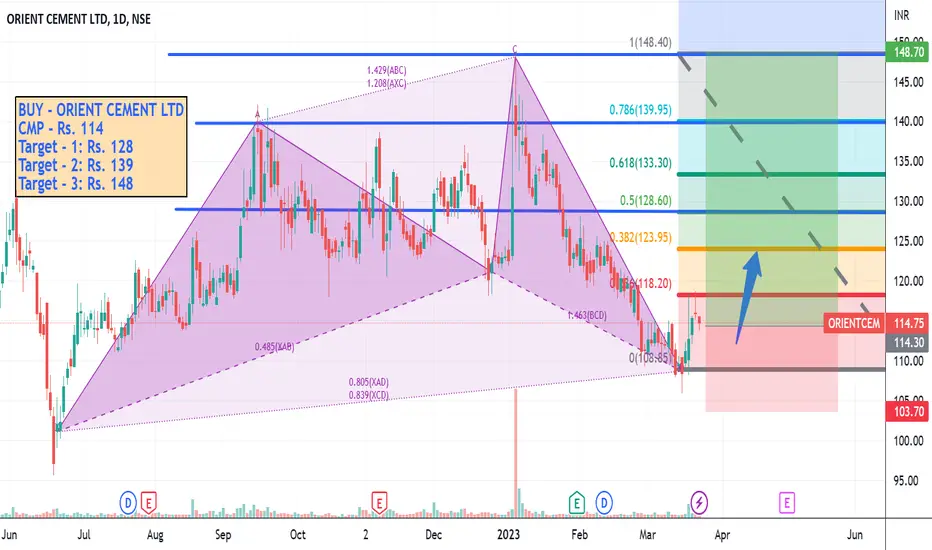
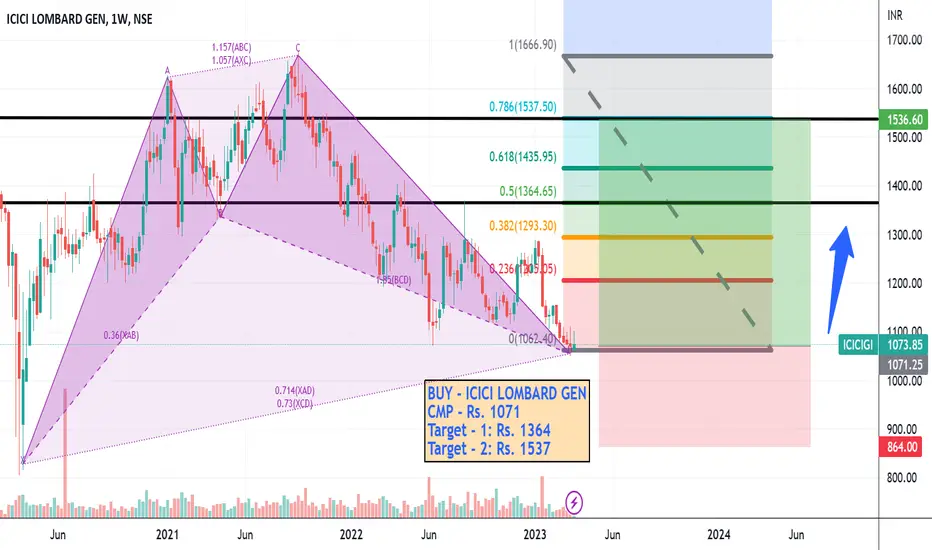
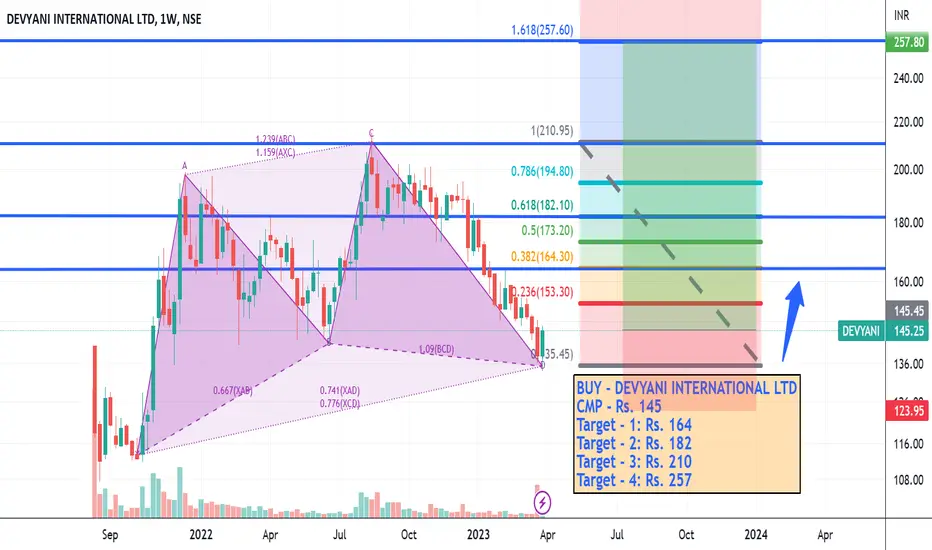
Cypher
FINNIFTY (CNXFINANCE) - A BEARISH CYPHER PATTERN FORMED. NSE:CNXFINANCE
❇️Harmonic chart pattern: BEARISH CYPHER PATTERN
👉🏻The Cypher pattern is one of the most profitable harmonic patterns and is useful for risk management, because of the large success rate. Traders can minimize losses if they follow the Cypher trading rules and meet the profit target.
🚀How to use
❇️The Cypher harmonic pattern is a trading strategy that uses Fibonacci numbers to identify turning points in geometric price patterns. It can help traders predict future movemen
Jubilant Food SL 1Hr candle close only, Target Trigger Price
All detail for chat. good entry at mark price only. and must stoploss minimum risk and good profit. risk ratio 1:1 to manage modified SL. This is not call, Just my idea. Please understand your risk and take full responsibility of your actions
Pidilite Industries SL day candle close only, Target Trigger Price
All detail for chat. good entry at mark price only. and must stoploss minimum risk and good profit. risk ratio 1:1 to manage modified SL. This is not call, Just my idea. Please understand your risk and take full responsibility of your actions
BGRENERGY Falling Trendline BreakoutIn this analysis, we will delve into the technical aspects of BGRENERGY's weekly chart. We'll explore significant patterns and indicators that suggest potential trading opportunities.
1. Breakout of Weekly Falling Trendline:
The most prominent feature on the chart is the breakout of a weekly falling trendline. Such breakouts often indicate a shift from bearish to bullish sentiment. This is a significant technical development, as it suggests a potential reversal or continuation of the trend.
Bullish Harmonics In Nifty Be CarefullBullish Harmonics
1. Bullish Cypher - PRZ - 18951
2. Bullish Shark - PRZ - 18818
SL - 18666 ( Day Closing Basis )
Bullish Cypher Target - 19450 / 19600
Bullish Shark Target - 19375 / 19550
3. Bullish Alt Shark - PRZ - 18493
SL - 18300 ( Day Closing Basis )
Target - 19174 / 19385
ABFRL's Harmonic Patterns and Potential TargetsHarmonic Patterns: Cypher and Anti Butterfly
Upon examining the chart, we observe the presence of two harmonic patterns: Cypher and Anti Butterfly. Harmonic patterns are geometric formations that indicate potential trend reversals. Traders often employ these patterns to identify favorable entry and exit points in the market.
Support on RSI:
In addition to the harmonic patterns, we notice a good support level on the Relative Strength Index (RSI), as indicated in the attached chart. The RSI is
VETO: Breakout and Harmonic PatternsThis analysis will provide an in-depth examination of the technical aspects of VETO's weekly chart, focusing on the recent breakout of a falling trendline, potential RSI resistance breakout, and the formation of harmonic patterns. Additionally, a potential trade opportunity will be explored based on these technical signals.
Chart Analysis:
Analyzing the TradingView chart of VETO offers insights into the stock's current technical conditions and possible price movements.
Breakout of Falling T
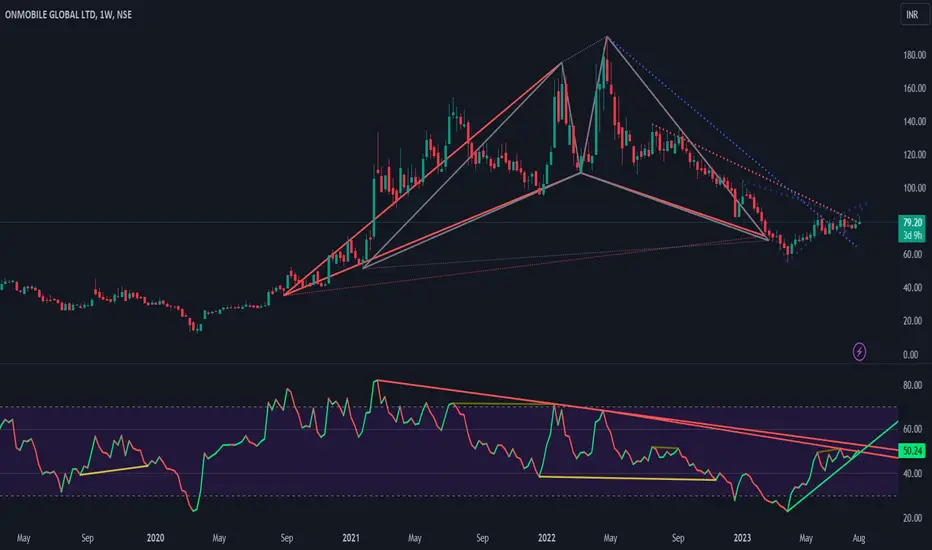
ONMOBILE's Chart: Bullish Breakout and Harmonic PatternsIn this analysis, we will delve into ONMOBILE's weekly chart, focusing on the breakout of the falling trendline and the presence of both Shark and Cypher Harmonic Patterns. We will assess the potential buying opportunity for ONMOBILE based on these technical signals. Let's proceed with the analysis.
Chart Analysis:
The TradingView chart for ONMOBILE reveals important technical factors that could influence the stock's price action.
Breakout of Falling Trendline:
ONMOBILE's weekly chart exhi
PAISALO's Chart: Rising Trendline Support, Harmonic PatternIn this analysis, we will thoroughly examine the chart of PAISALO, focusing on the support at the rising trendline on a weekly basis, the consolidation phase, the presence of a cypher harmonic pattern suggesting a potential reversal, and the recent impressive quarterly results. By considering these technical and fundamental aspects, we aim to provide insights into the stock's current situation and a potential trading opportunity. Let's proceed with the analysis.
Chart Analysis:
Upon reviewing
ALKEM LAB LTDshare name : alkem lab ltd
call type : positional or investment
- share is forming a cypher pattern with ab=cd
and double bottom
- a good consolidation can be seen between
level 3369-2828
- 3369 is a hurdle zone for this share which
acting as a huge resistance
- we can accumulate this share around
2969(after competing of gartley in shorter
time frame )
- approachable targets 3369,3725, 3933, 4227 ++
thanks
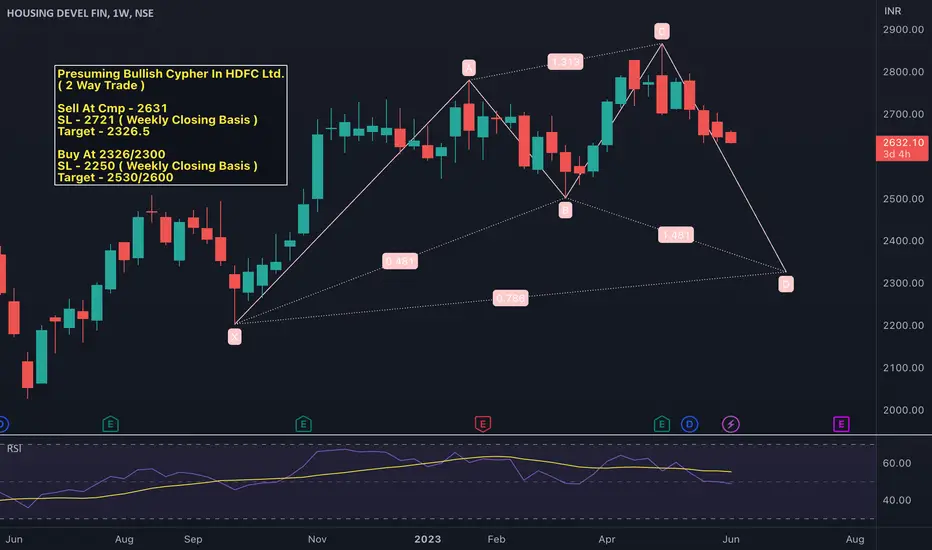
Hdfc Bullish Cypher IdentifiedPresuming Bullish Cypher In HDFC Ltd.
( 2 Way Trade )
Sell At Cmp - 2631
SL - 2721 ( Weekly Closing Basis )
Target - 2326.5
Buy At 2326/2300
SL - 2250 ( Weekly Closing Basis )
Target - 2530/2600
HShort