Short
Short
 Long
Long

 Long
Long
 Long
Long
Nifty Bearish Trade Set UpTRADE LOGIC as on 06th Jan 2022 @12:00 Hrs
in.tradingview.com NSE:NIFTY1!
Nifty price action has formed a Bearish Cypher Harmonics Pattern on daily time frame as shown in the attached file. If this hold out, then we can expect a correction at-least till the Daily Demand Zone at 17287 / 17151 on Nifty futures chart. However, the daily trend remains upbeat. So in this confusing scenario, where I am bearish on balance, but don't want to risk losing money on the upside, I plan a Put Ratio Front Spread a little intelligently where the upside is protected completely and the down side yields very good profits if market falls slowly.
The risk to this trade is a very steep fall, ironically! So I calculate the max risk on the downside in a bearish trade (I told you, its ironic).
I estimate the risk as follows: If Nifty moves down by 3.5% or essentially breaks the Demand / Support area as mentioned above by Monday, the max MTM risk shown by the simulator is Rs.2500/lot. Accordingly I will monitor the trade and will issue an exit if there is a steep fall and our MTM loss is breached. If the fall is slow and steady, say in a week's time by next Thursday, Nifty is at 17500, we will be decent profit.
This trade has a decent risk reward profile and with complete protection on the upside. Given that the prices have moved up sharply from 16400 to nearly 18000 in a short span of time, and we are seeing first signs of cooling off, I expect the market to either fall or consolidate. We stand to benefit in both the cases.
Happy Trading.
🦉 Short 
 Long
Long
Long 
 Long
Long
 Short
Short
 Short
Short
 Long
Long
Long 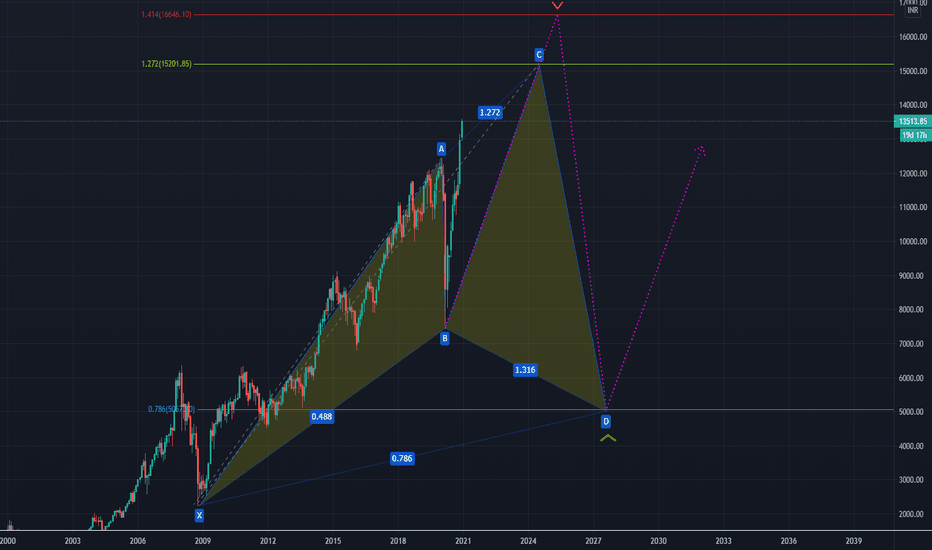
Short 
 Long
Long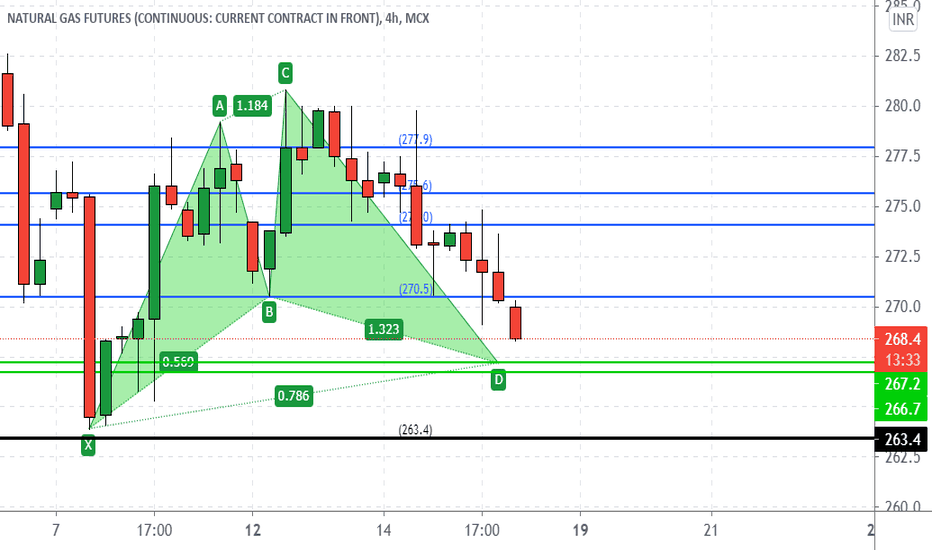
Long 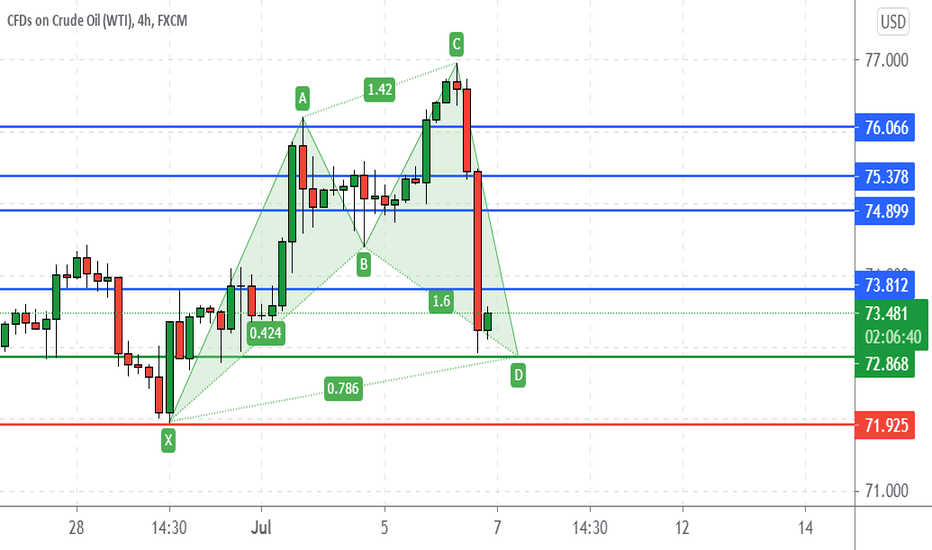
KOTAKBANK: A Bearish Trend "
TECHNICAL ANALYSIS OF NSE:KOTAKBANK
The LAST CLOSE PRICE of NSE:KOTAKBANK is 1733 . The PARABOLIC SAR is showing the DOWNWARD SIGNAL with TREND as DOWN TREND . The FIBONACCI LEVELS analysis shows that the CLOSEST FIBONACCI LEVELS is 0.618 at the FIBONACCI STOCK PRICE LEVEL of 1733.05. From here, the Key Support and Resistance levels are SUPPORT 1 at 250.07, SUPPORT 2 at 1773.43 with RESISTANCE 1 and RESISTANCE 2 at 1716.55 and 1685.05 respectively. The Key 50% FIBONACCI LEVEL stands at 1756.47 which is the crucial Fibonacci Level determining whether the scrip will maintain the trend or not.
The STOC RSI has the values K and D as 0.72 and 0.72 respectively. At this level it the status is OVER SOLD. When we look at the Moving Averages, MACD is the crucial indicator to look into. With MACD VALUE at -9.75 and 26.01 at -3.79 along with HISTOGRAM showing values of -5.97, the STATUS is clearly DOWNWARDS.
The best indicator to determine the Trend Reversal is FISHER TRANSFORM and currently the values of FISHER and TRIGGER stand at -2.79 and -2.51 with TREND CHANGED TO SELL as DOWNTREND. A very important factor while making the investment is to see if there has been already too much of Buying or Selling, and that are we entering too late into the transaction or not. Thus, with WILLIAM's R% value at -0.8666 the STATUS is OVER SOLD.
No one wants to buy costly things, and thus always look for the bargain or appropriate price levels to buy things. Same applies to Stocks, however the only exception would be some Hot Stocks that one wants to have any price. Looking at this perspective, the P/E RATIO of the stock stands at 34.35 which signifies its Price Level to be TOO EXPENSIVE.
>>> RECOMMENDATION is : SELL ."
Disclaimer:
The analysis is only for illustration purposes only. Please consult your financial advisor, agent, broker before acting on any information. We may or may not have positions in the stock and our actions may be contrary to the one mentioned here. This analysis may or may not be updated. We would not be responsible for the profit/loss resulting from this analysis.  Short
Short
Long 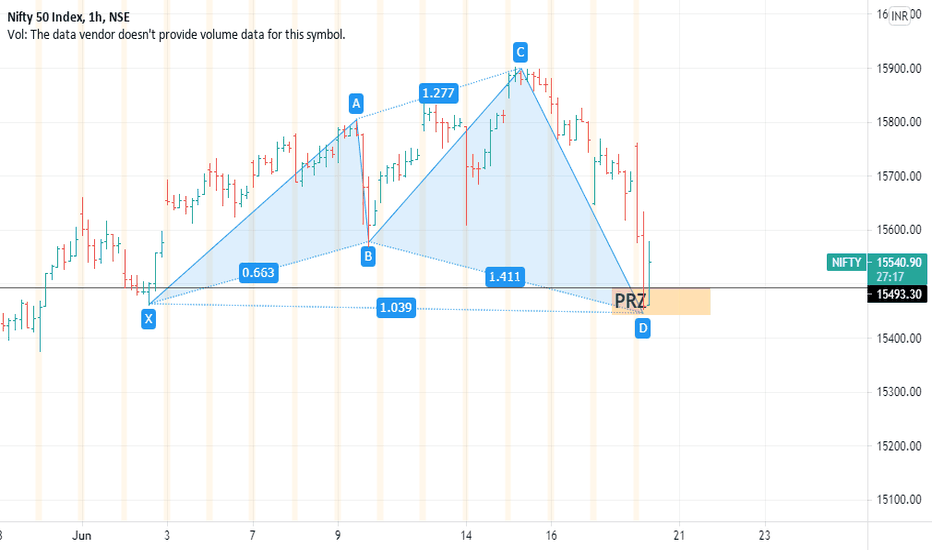
 Short
Short
Long