Short
Descending Channel
Short
GOLD - Descending channel formation at day chartGOLD - Descending channel formation at day chart
Always trade what you see, never trade what you feel. Make this a habit, you won't be requiring any seminar, webinar, or mentor, you will be self-sufficient.
Disclaimer : All charts are purely for educational and information purpose only. Invest or Trade at your own risk.
Short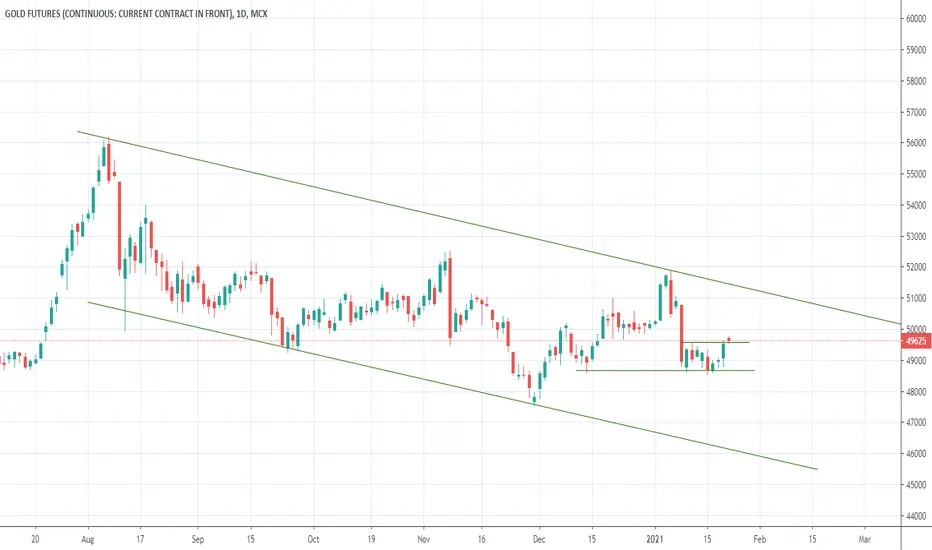
GOLD - Descending channel formation at day chartGOLD - Descending channel formation at day chart
Always trade what you see, never trade what you feel. Make this a habit, you won't be requiring any seminar, webinar, or mentor, you will be self-sufficient.
Disclaimer : All charts are purely for educational and information purpose only. Invest or Trade at your own risk.
Short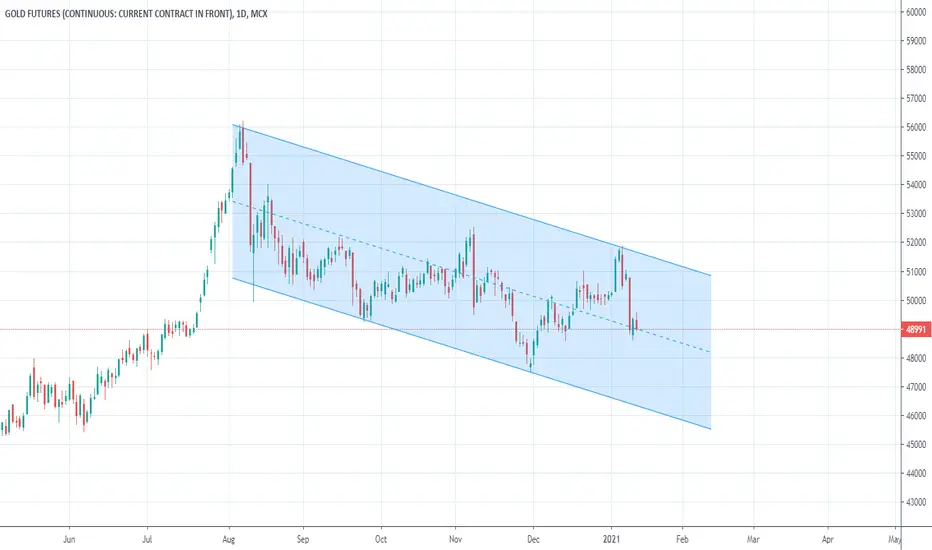
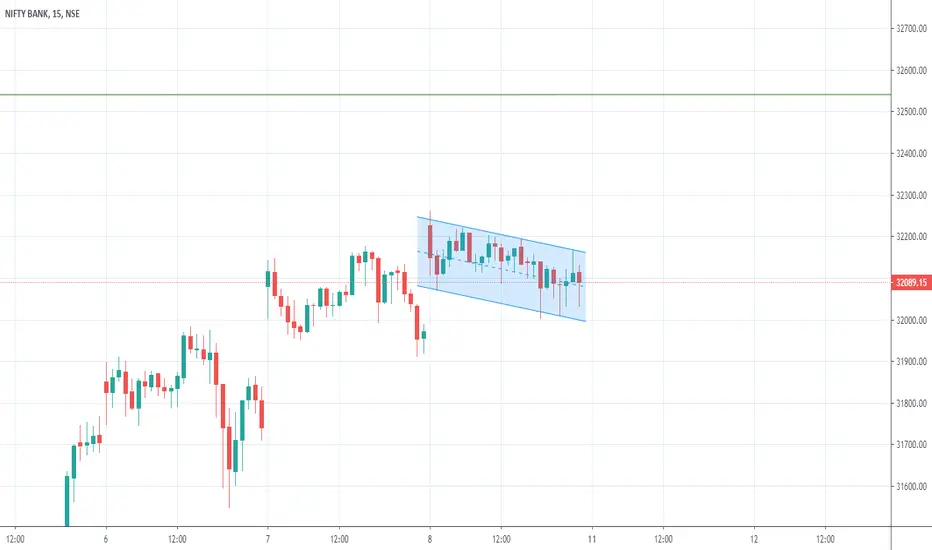
Bank Nifty - Descending channel formation at 15 mins time frameBank Nifty - Descending channel formation at 15 mins time frame

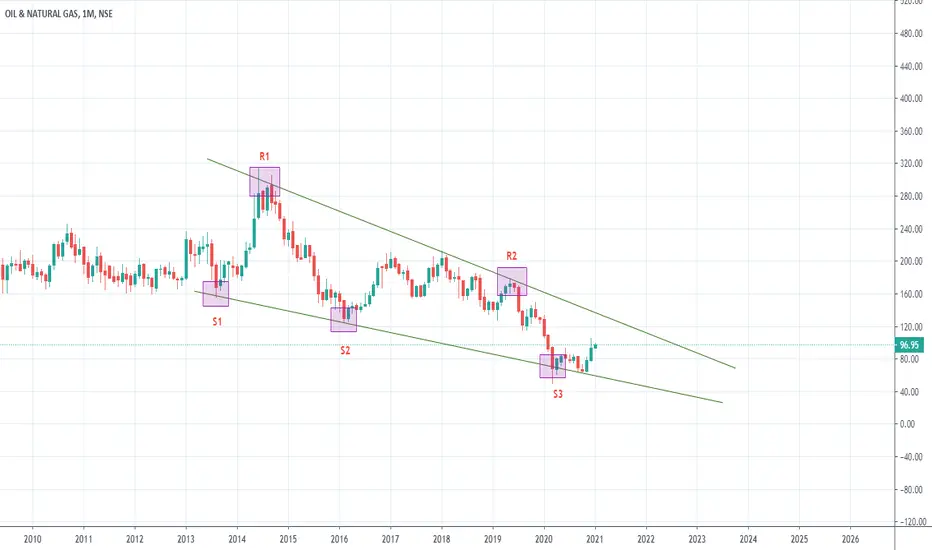
ONGC - Descending channel formation at monthly time frameONGC - Descending channel formation at monthly time frame
Disclaimer : All charts are purely for educational and information purpose only. Invest or Trade at your own risk.
 Long
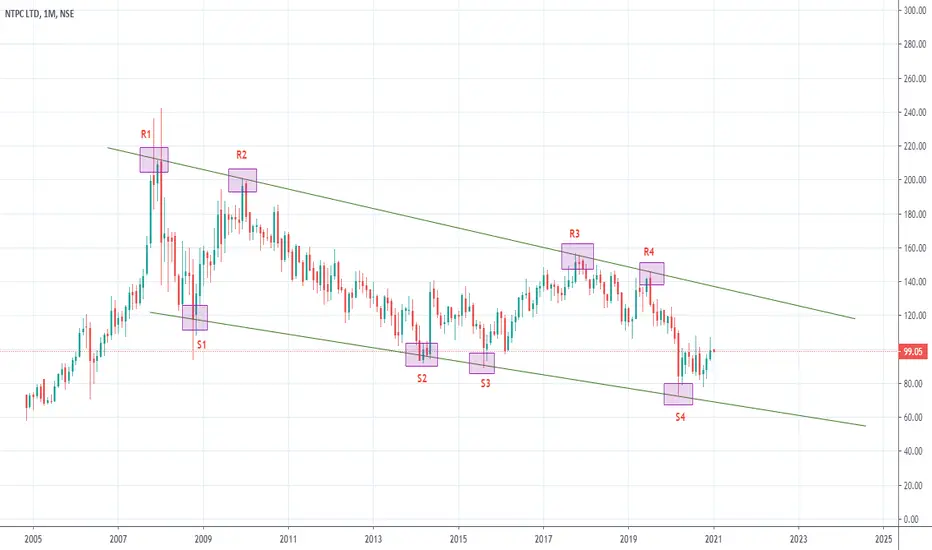
NTPC - Descending channel formation at monthly time frame NTPC - Descending channel formation at monthly time frame
Always trade what you see, never trade what you feel. Make this a habit, you won't be requiring any seminar, webinar, or mentor, you will be self-sufficient.
Disclaimer : All charts are purely for educational and information purpose only. Invest or Trade at your own risk.
 Long
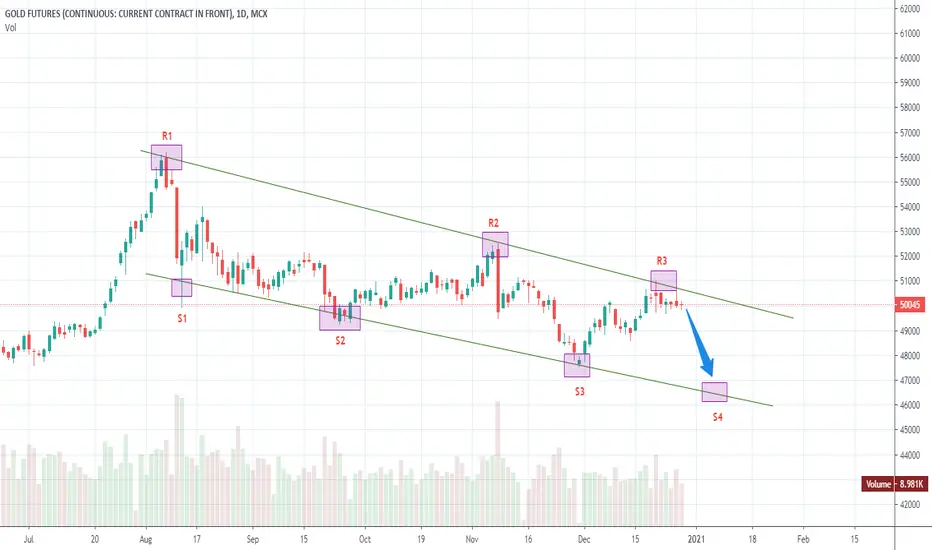
GOLD - Descending parallel channel pattern formation at day TFGOLD - Descending parallel channel pattern formation at day time frame
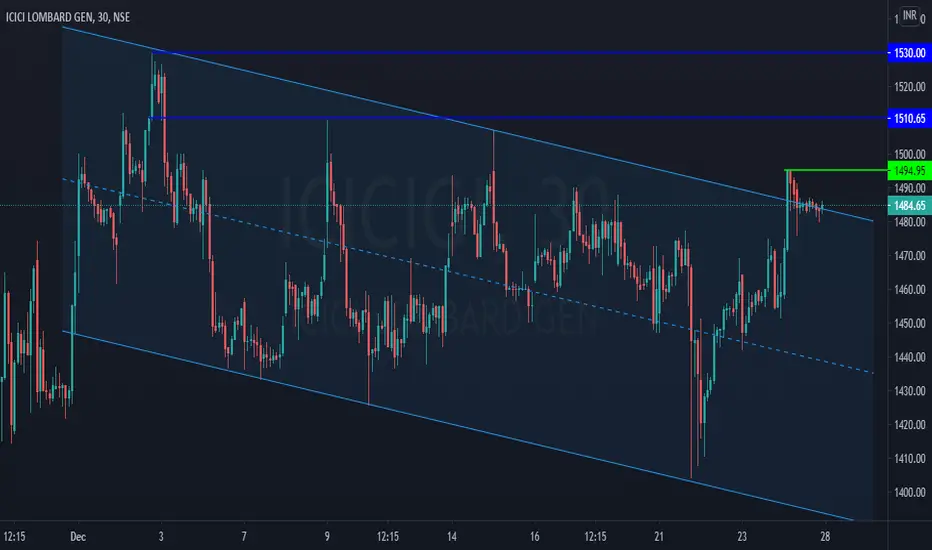
ICICIGI Intraday - Downward Channel Breakout and retestPrice broke out of the downward sloping channel and gave a pullback to the breakout zone can give move above 1495 intraday for 1st target 1510 and second target 1530.
VIEWS FOR LEARNING PURPOSE ONLY
 Long
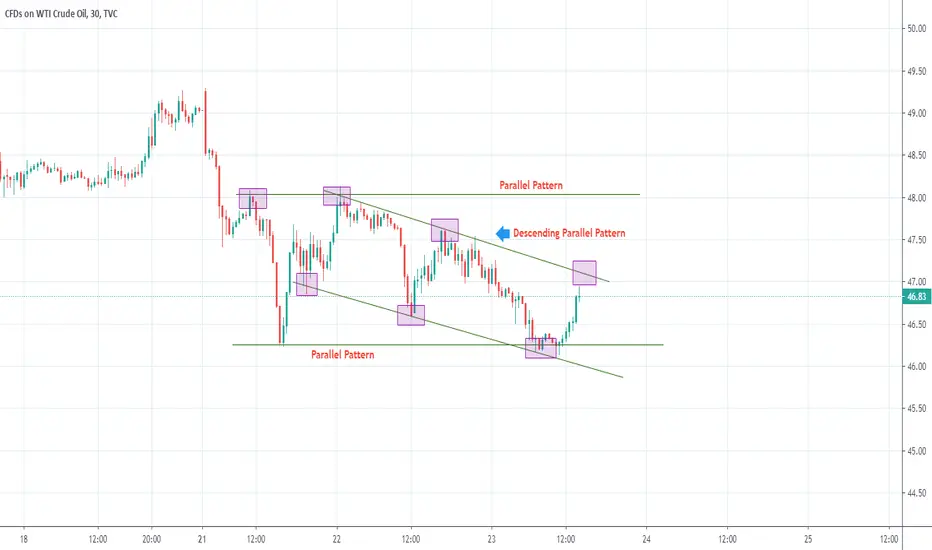
Crude Oil - Lets wait and see which pattern it's going to followCrude Oil - Lets wait and see which pattern it's going to follow up whether parallel pattern or Descending parallel pattern?
 Short
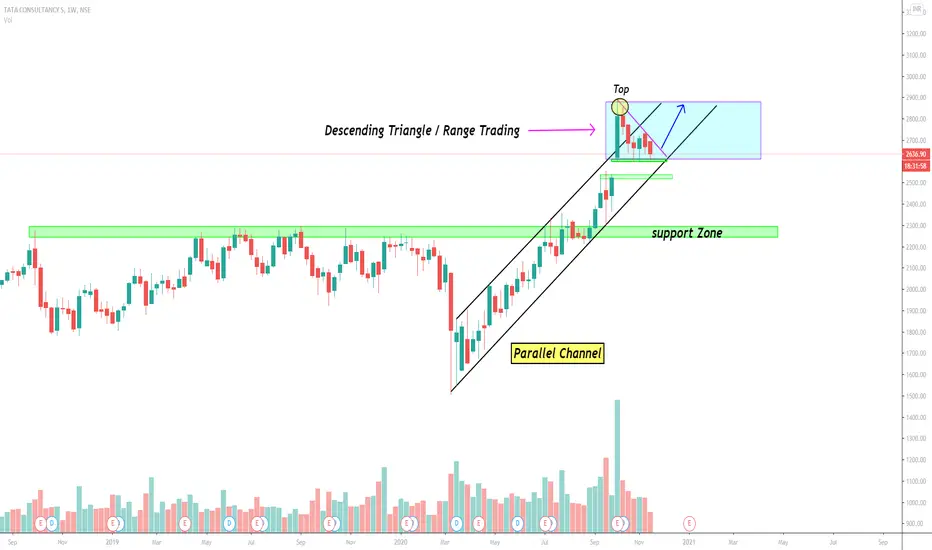
TCS | Descending Triangle / Range Trading Swing Trading opportunity ! Weekly Chart Alert !
Enter on lower time frame after breakout 🎯
Lot Size =300
Target = 2878
Stop-loss = 2576
1) Descending Triangle and Range trading can be done
2) Parallel channel Formation
3) Support zone is 2249-2299
Guys check out the related ideas as well, it will work really well guaranteed !
FOLLOW for more !
LIKE if think is useful !
COMMENT Below your view !
 Long
 Short
 Long
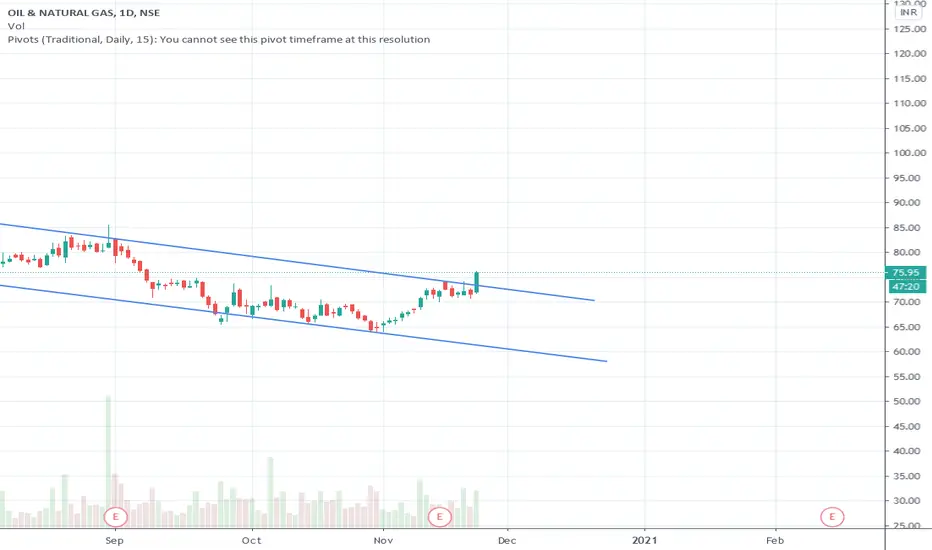
Potential breakout - Channel pattern61.8% support taken & trend reversed.
Possibilities of channel breakout & strong up movement.
 Long
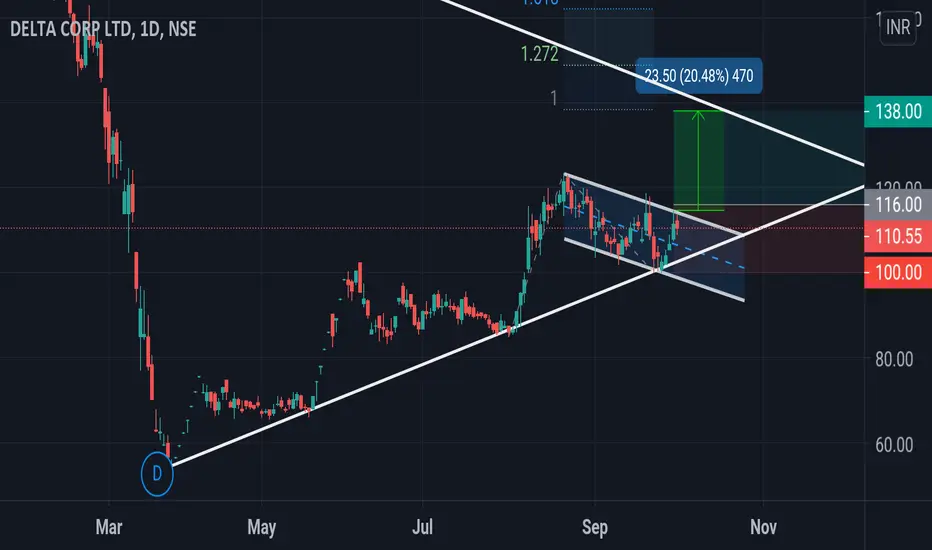
BULLISH ABCD and CUP & HANDLE PatternCurrently on Fibonacci cluster support levels. Also formed a Bullish ABCD PATTERN. Waiting for trend reversal confirmation
 Long

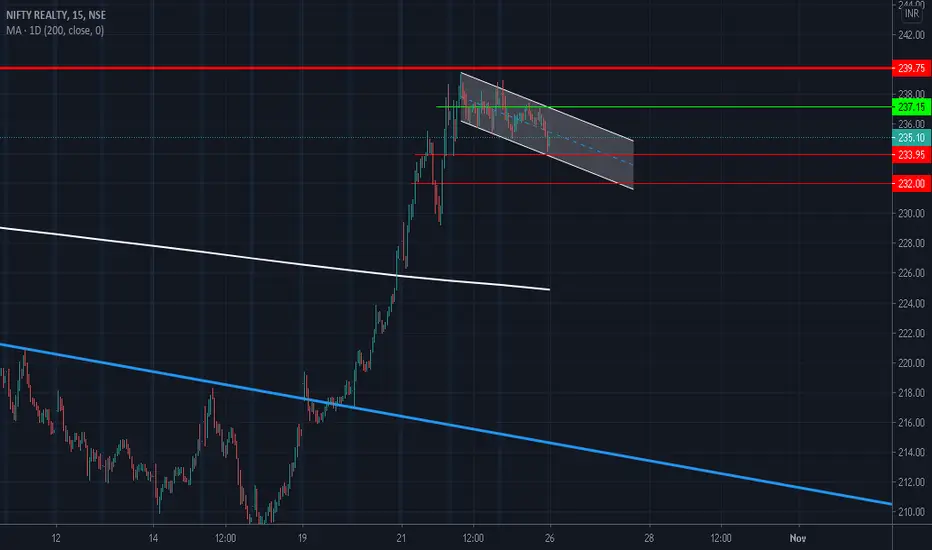
NIFTY REALTY Possible Flag PatternNIFTY REALTY on 20th Oct gave the long-awaited triangle breakout followed by a quick attempt to break the resistance at 239-240 levels. This was rejected and then it fell into a channel consolidation (descending) since 22nd Oct.
Possible breakout/down confirmation levels
Breakout - 237.15
Breakdown - 233.9 (Aggressive), 232 (Conservative)
Just a Beginner trying to learn pattern analysis. Looking forward to corrections and insights.
Cheers ;)

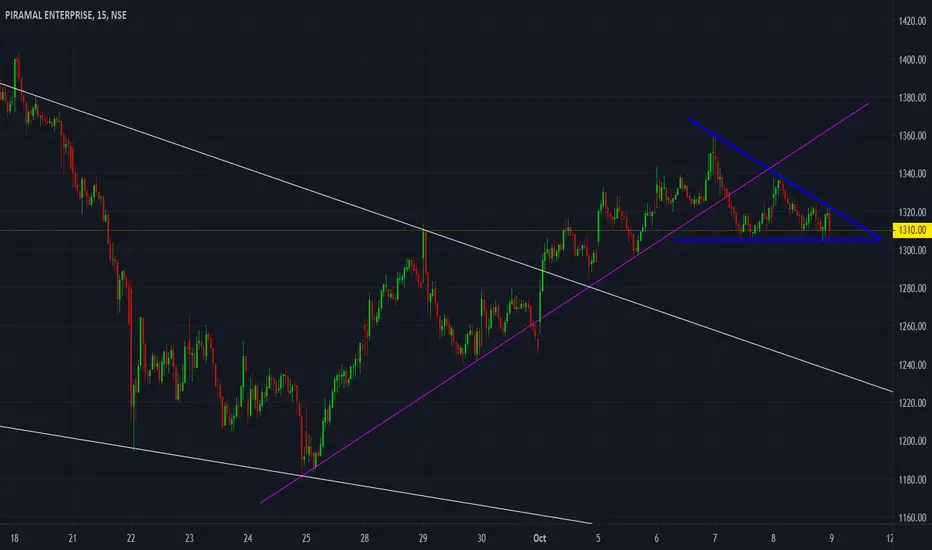
PEL - Intraday breakout possible - descending triangleImmediate support placed at 1305 can break, giving a possible move downwards. If further move after round level of 1300 is seen, The trade is expected to make the 1300 level resistance in the coming sessions.
This is expected to be a short term correction as the stock has broken the descending channel in the higher time frame.
Sell below 1305
Targets cannot be specified as there is lot going on the fundamental side of things too.
This is not a recommendation, Its for educational purpose only
PShort
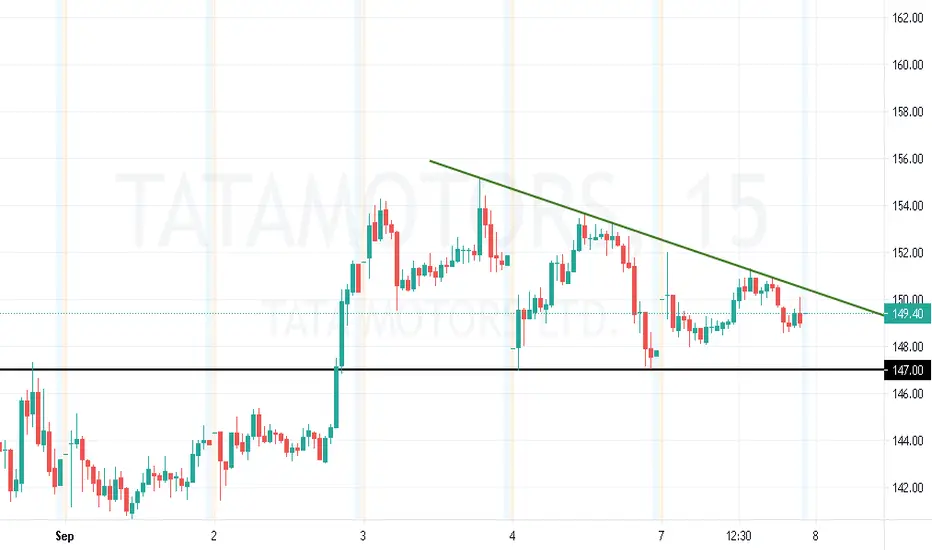
TATA MOTORS - Triangle Pattern + NR7Tata motors is showing a very good pattern to trade in intraday
Beware of FALSE BREAKOUTS.
This is for educational purpose only
Thank you and have a nice day.
Happy trading!!
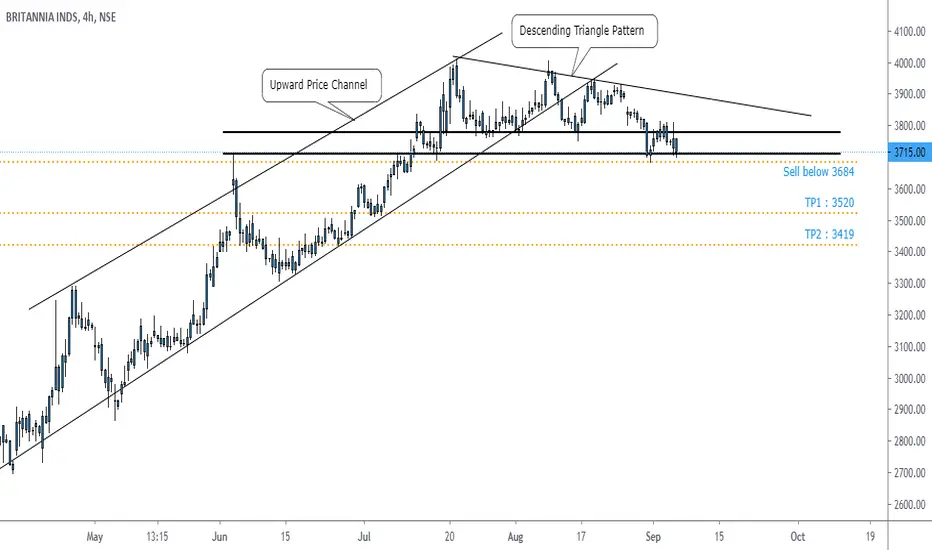
Britaninia : Trade SetupNSE:BRITANNIA
Hi Traders,
BRITANNIA has broken upward price channel as well as descending triangle pattern and taking support on previous high of upward price channel. If this support is broken by it then it will start downward movement.
Stock Analysis
* Stock has broken upward price channel.
* Stock has broken descending triangle pattern.
* Taking support on previous high.
Sell Level
Below 3684 (based on price action)
Target Level
TP1= 3520
TP2= 3419
********************************
 Short
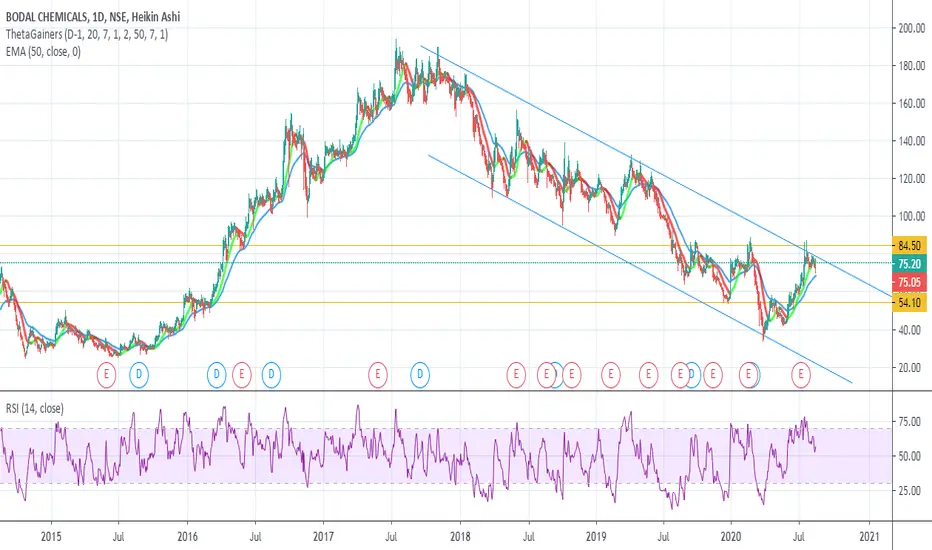
Look for BreakoutBodal chemical trading in down trend channel, look for strong breakout on weekly charts with volume for Long.
 Long
PAGEIND Pageind retraced from golden ratio and also has falling wedge which confirms a very sharp upward movement. targets on chart
 Long

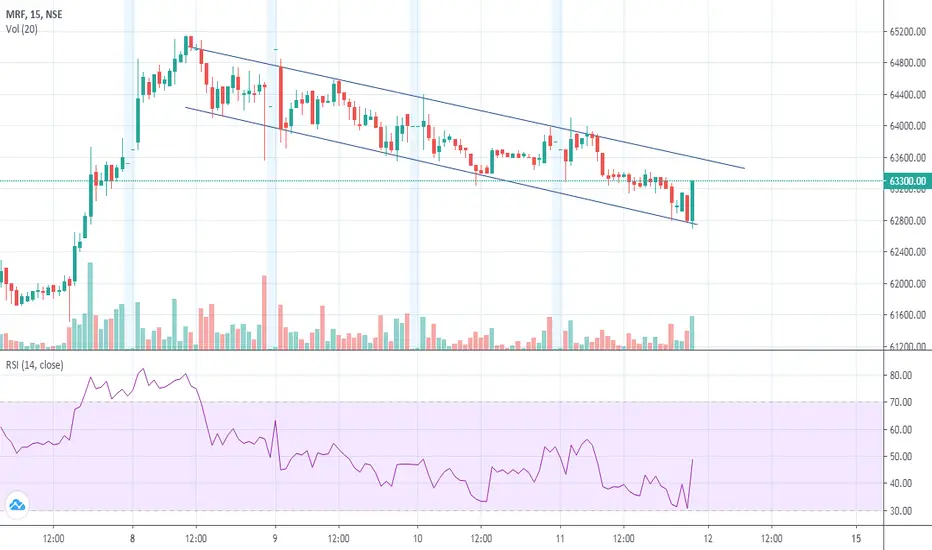
Mrf in Descending Channel.. Mrf in Descending Channel.. keep a eye on it as it is in trending in channel as the price of the share is quite high very few traders would be trading in it.take move according to the breakout

 Education
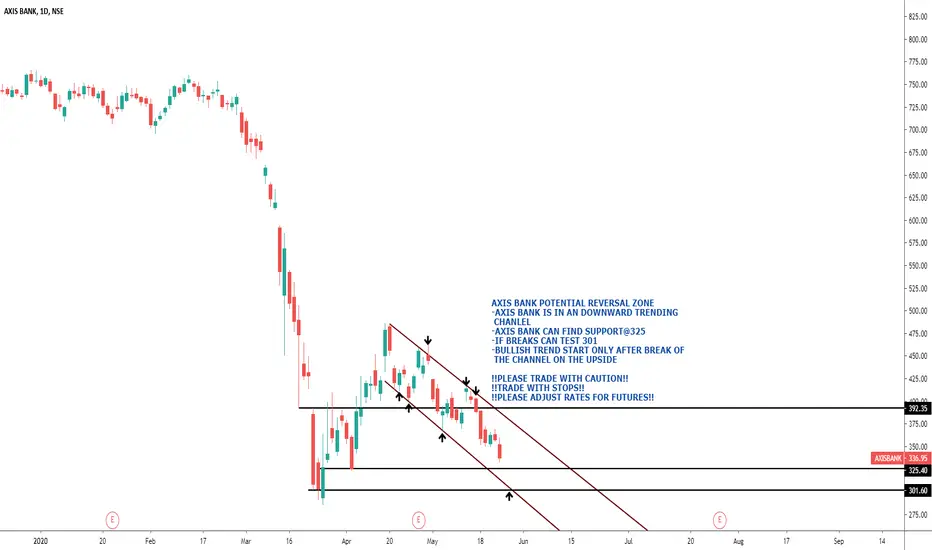
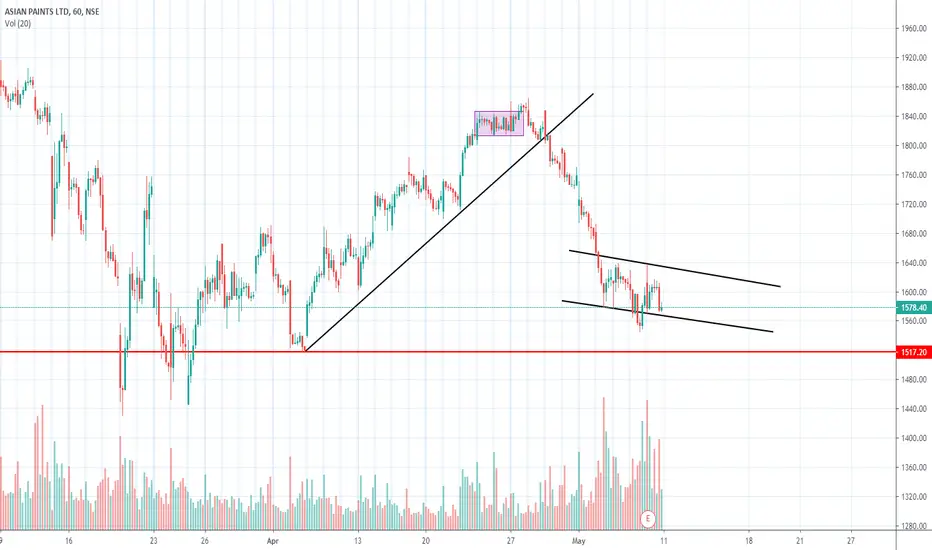
Trade Setup for Asian PaintsAsian Paints Formed Descending Channel Pattern , tried to break down once not succesful , next swing might give breakdown.
Major support is at 1540 range.
Sell Below 1540. This is Purely My Techinical Analsysis. Do Analyse yourself before entering in to the trade.
 Short
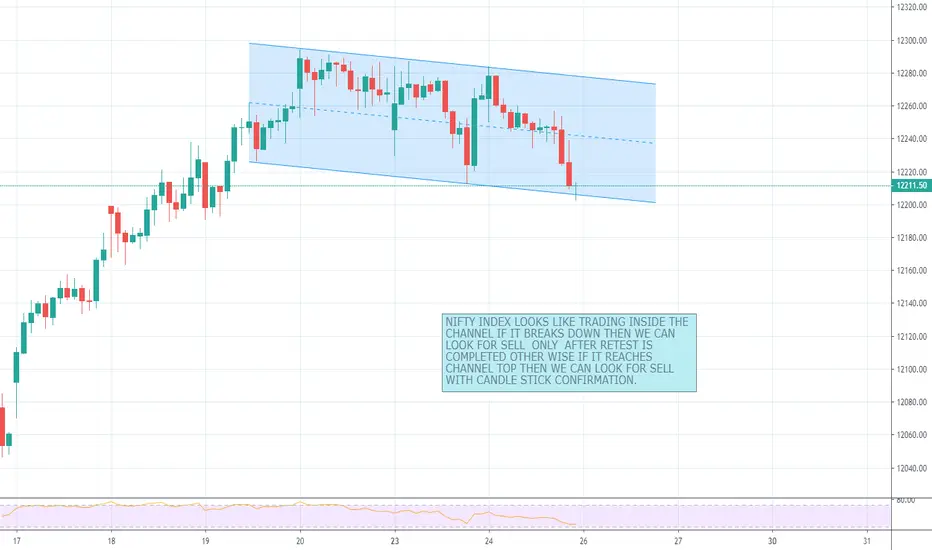
NIFTY VIEW FOR INTRABAY TRADINGNIFTY INDEX LOOKS LIKE TRADING INSIDE THE CHANNEL IF IT BREAKS DOWN THEN WE CAN LOOK FOR SELL ONLY AFTER RETEST IS COMPLETED OTHER WISE IF IT REACHES CHANNEL TOP THEN WE CAN LOOK FOR SELL WITH CANDLE STICK CONFIRMATION.THIS FOR ONLY EDUCATION PURPOSE ONLY.
 Short