NiftyNifty through the week was within a falling channel making Lower Lows and Lower Highs. At close today it came into the PRZ of 3 Bullish Harmonic Patterns, namely, Shark, Bat & Gartley. If it were to reverse from this level it needs to survive above 11940 for an hour at least. Then it could move all the way back to test the falling channel at 111975-12025. From that range (or on failure to hold 11885) we could expect the next set of 3 Bullish Harmonic Patterns. namely, Alt Shark, Bat & AB=CD get
Descending Channel
BANKBARODA - 240MIN - Ready for reversal ?Bank of Baroda has been in a descending channel for the past month. The stock has formed this reversal channel at an important daily support zone. The stock created a double bottom formation last week giving more indication of a reversal.
Stoploss - 88.65
Target 1 - 99.05
Target 2 - 103.35
Target 3 - 107.30
Disclaimer
This content is for information and educational purposes only and should not be considered as a piece of investment advice or an investment recommendation. Past performance is n
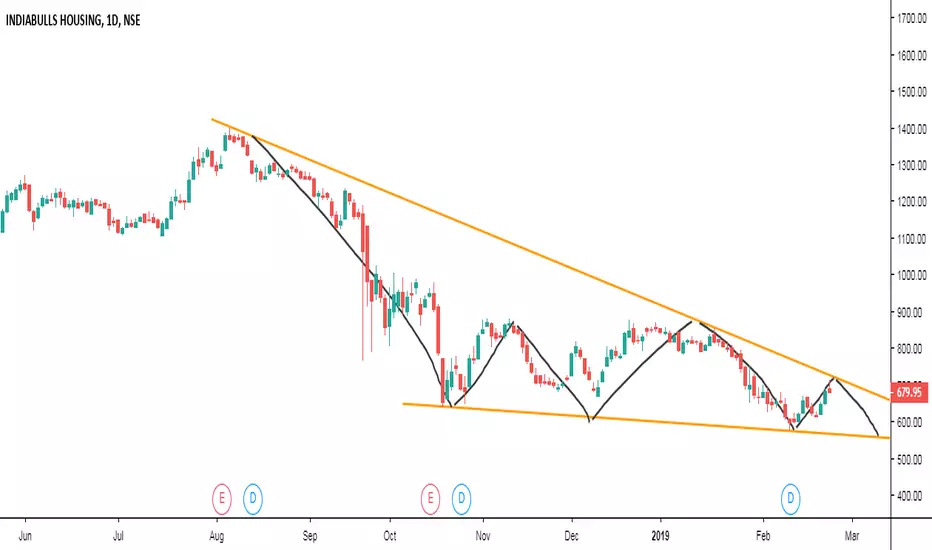
Indiabulls Housing Finance - Long Term Buy ?The Stock has been in a downward spiral for many months. It has created a descending channel on the daily chart as well as another small descending channel inside the bigger descending. 3 touches of a pattern indicate pattern completion. Here both the descending channels have completed their respective 3rd touches at the same point. We have also a Morning Star candle shape formation at this low. This is a stock to buy and hold for the coming weeks or months.
The Levels are indicated on the Char
ILong
MAHINDRA AND MAHINDRA - 60MIN - M&M positive after 566 levels Mahindra & Mahindra is in a descending channel at a double bottom structure at a weekly support zone. The RSI suggests a positive divergence.
Target 1 - 566.
Traders can maintain a stoploss of 540
Traders can look for further targets after 566 levels have been broken.
Probable down move from channel resistanceNifty has arrived the resistance level of the descending channel. If tomorrow price gaps down and moves downward in first 15 min, a short position can be opened with SL above the swing high and a target of 11650.
If price gaps up and sustains over today's high, this trade plan will no more be valid.
AUD/USD Technical analysisThe pair is going down the hill slowly but steadily in a descending channel formation.
It was thrown down by the resistive trendline, in the due process, crossing a support level of 0.71157.
We expect it to test the broken support, which can be used as an entry point for a short trade, and then move to the supportive trendline.
IBULHSGFIN DOWN AS OF NOW !!IBULHSGFIN is following the descending triangle channel and it is expected to kiss the channel support.
Even if it breaks the channel resistance, we can expect a reversal from 50 sma and then back to channel.
I
SLong
IDFC descending channel breakoutIDFC descending channel breakout
Long above 53
SL - 49.3
Target - 60.55
ILong
EUR/USD Technical analysisThe 1-hour chart of EUR/USD is currently in a descending channel formation.
The trend line also coincides with 200 SMA which could acts as strong resistance.
As per our analysis,we expect a strong selling pressure immediately.
On the contrary,if it breaks the resistance,we can expect short covering too.
#LICHSGFIN - Falling ChannelLICHSGFIN is trading in a downward-sloping channel for the past six months. Today it has given short-term breakout above swing high of 577 which coincide with 50-day SMA. It has now resistance around 590-591 trendline zone. It needs to close above falling resistance trendline for trend reversal which will take stock towards 660-675 zone.
amara raja battery looks bearish in medium termIn weekly, price broke horizontal support, then it bounced back to retest the broken support, which is acting as a resistance now.
also price is at descending channel resistance.
also double top pattern confirmed here,
it can slide down to 670, 640, 560 levels.
ALong
FLAG OR A DESCENDING CHANNELIt is sometime hard to interpret a chart pattern because of the complexity.I am 23 years old might be having only few years of experience in the field of research but i have been studying technical analysis since i was 18.Today i am going to share some basic knowledge that i have learned in level-1 of Chartered Market Technician(CMT).
''Now some traders or analyst must have seen some choppy and indecisive movement in the index for a couple of weeks.What is the reason and how to predict/forecast