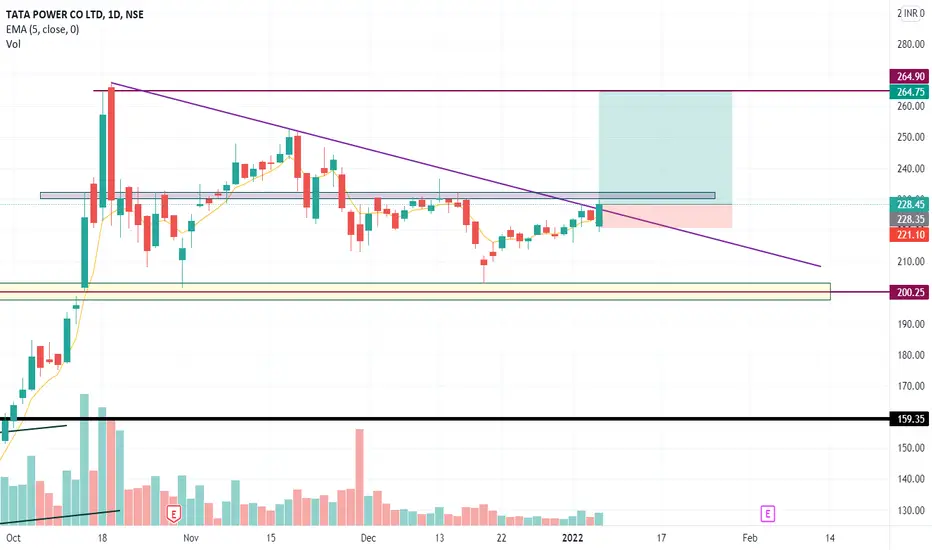
Descending Triangle
nbcc india ltdshare name : nbcc india ltd
call type : poistional
- share is forming a descending triangle
- a good consolidation can bee seen between 50
and 40
- 50.50 is acting as a good resistance, if 50.50 is
taken out we can see the targets of 60 and 69
- we can accumulate this share above 50.50
with sl of 46
thanks
Buy Indiabulls Housing FinanceIt formed a descending traingle but it gave an upside breakout with high volume. Also after the breakout it touched the resistance-cum-support line but didn't go below that line.
Target 1:- 290+
Stop Loss:- 220
ILong
Cadila Healthcare is showing weakness in hourly chartCadilaHC has given a breakdown from a descending triangle and a confirmation is awaited in the hourly TF. Potential Target of 425 and thereby it could retest the support zone at 425 level, view is negated above 465
CShort
WHICH WAY COULD THE MARKETS GO FROM HERE? (BANKNIFTY)The global cues lately have not been the best and markets are correcting quite aggressively lately. BankNifty has corrected a little over 15% and Nifty close to 10%
The pattern I am observing now is a triangle pattern, with both an upside possibility as well as downside.
The trade plan:
Bullish:
Entry upon breakout above higher trendline (36,650)
SL: 36,050
Target: 37,850
Risk-Reward: 1:2
Bearish:
Entry upon breakdown below lower trendline (35,900)
SL: 36,500
Target: 34,700
Risk-Reward: 1:
Nitin Casting under Descending TriangleAs seen in the chart, Nitin Casting is trading under a Descending Triangle in the daily time frame. Any of the two -> break out above the upper trendline or break down below the lower trend line should be considered for further direction of the price.
Do Note: Break out or Break down will be considered as close price of a daily candle.
Disclaimer: This is for educational purpose only. This is not any recommendations. I am not SEBI registered. Please consult your financial advisor before takin
Hero moto case studyHERO MOTO SPOT CMP 2675
HARMONIC STUDY
TIME FRAME :- HOURLY
Bullish Bat pattern formation on hourly time frame.
PRZ in range 2670-2640
Reversal confirmation above 2730
pattern violation below 2600 levels
Upside retracement levels of 2780-2815 possible
Triple bullish divergence on RSI where price made lower low 3 time and RSI made higher lows
RSI have given breakout and retest of falling trend line and now on verge to break above previous high levels, indicate bullish price action ahead.
Des
BankNifty Analysis for Upcoming Weeks Hi Friends,
Pranam,
Now we are going to analysis the BankNifty for coming weeks:
In Weekly TF:
Refer the Image,
1. Bearish Flag Pattern evidence
2. Index Closed in Support
3. Dynamic Support was in the range of 34435.13 & 32611.27 as per EMA50 & EMA79
4. MACD was Flatten
5. Stochastic RSI as per my View was nearing oversold Range.
6. ATR was average.
Long Term trend is Bullish as per EMA200.
In Daily TF:
1. Falling Wedge Pattern formed
2. BankNifty was in the support zone.
3. Index
TV18BRDCST LONG #priceaction #TV18 Multi time frame analysis
price action
stock - TV18BRDCST
Monthly TF - traingle pattern ( with stright support line , and descending resistance line )
weekly TF - same as Monthly TF
daily TF - ascending channal pattern
breakouts - already happend in Monthly tf and weekly tf .
- the new channal in daily tf is about to give breakout .
entry - Once breakout happens in daily tf of channal pattern . we can enter .
target - first big resistance in weekly and monthly tf .
sl -
TLong
Descending ‘MARUTI’Today Maruti Suzuki’s Chart indicates a Descending Triangle pattern. But it will take time to complete the formation and get results. I believe one should use ADX and trade when ADX value goes above 25 along with the breakdown of the trend…
If both of the conditions satisfy it will be a great trade believe me!
NSE:MARUTI