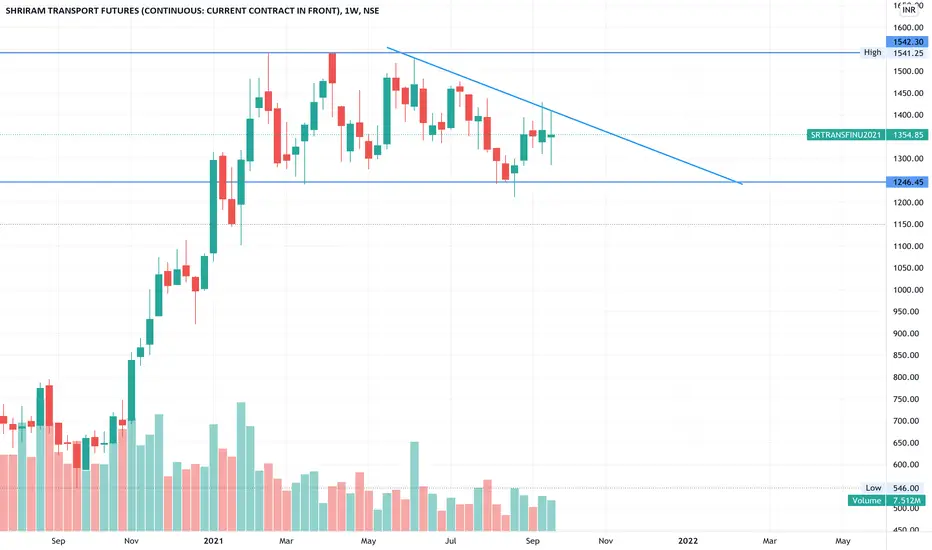
Descending Triangle
RBLBANK strong breakout with heavy volumeReasons to buy RBLBANK:
1. Stock gave a strong breakout from the descending triangle pattern with heavy volume.
2. Company manage to came in net profit of 31 Crores in sept-2021 quarter, while it was in net loss of 459 Crores.
3. Stock is trading at 0.98 times its book value.
Targets: 270, 400
Hold for 6 months to 1 year
Points to remember before buying:
1. Always diversify your portfolio.
2. Never give more than 5% weightage to a single stock.
NIFTY/S&P500 at Triangle ResistanceNIFTY/S&P500 relative strength chart has reached its descending triangle resistance as seen in this weekly chart. Should this be a reason to worry for Nifty bulls? Maybe, maybe not. Price will tell. Watch for price action in Nifty at the 18500 zone. If resistance kicks in, we may see some price/time correction. If not, we may break out of this descending triangle upper trend line and continue the upward journey.
We will be watching.
P.S. Similar price action happened in NIFTYIT/NASDAQ relative
FORTUBE: Descending Triangle and Bullish divergenceKeep FOR (Fortube) in your watchlist. Buy on breakout of the descending triangle with good volume at POC (Point of Control levels) that is the price level for the time period with the highest traded volume that has utmost importance here so when that zone breaks with good volume we need to take an entry. This is high risk trade and so are the profits. Here we can also notice a RSI bullish divergence, in which RSI looks bullish whereas the candlesticks are still neutral, also notice a double bot
FLong
Descending Triangle Pattern in M_M breakout can give 955+ TargetIn Mahindra & MAHINDRA(M_M) on weekly timeframe there have a descending triangle pattern. If this stock gives breakout this pattern above 780 then expected short term target 955+ in this stock. Downside 730-735 is strong support zone so any bearish movement only possible below this level. So, We can go long in this stock with stop loss below 730.
Upside 800 will act as an immediate resistance after breakout. Possible some breakout correction from this level upto the breakout level. Once it sta
Wyckoff distribution - Bitcoin Target: 37500$It seems like the Wyckoff distribution is playing out again in Bitcoin charts.
There is a confluence between the Wyckoff distribution and descending triangle pattern which gives a target of ~37500$ price within a week after which a trend reversal can be expected.
The first Wyckoff distribution happened between the start of this year and ~20th July and Line1 denotes the Support for that distribution
The one playing out currently started a week after the first one got over and is a smaller one as
Swing Trade- APOLLO TYRESApollo TYRES had a descending triangle breakout with volume and a retest at 224 levels. A good 4R swing trade, enter around 224-225 to enjoy targets up to all time high. Also it showed a good support at 55 EMA and retested at POC (Point of control) aka highest volume zone. A pin bar shows rejection from sellers and buyers win here. Keep SL below the 55 EMA. It is Also taking support at Bollinger Bands. Happy Trading!
MAHINDRA & MAHINDRA
Buy at Market or Buy Stop Order
Target:- 1007
Stop Loss:- 780
Duration:- 9 to 12 Weeks
The stock has already break the resistance line and showing a bullish candle, which is a upside breakout and indication of upside move. It is also a descending triangle pattern. So we can buy this at market order. Use proper stop loss and maintain discipline throughout the trading period and use trailing stop below all the wave step by step.
Descending Triangle for SRTRANSFIN [Watchlist]SRTRANSFIN is forming a descending triangle pattern on a weekly and daily TF. Waiting for a breakout out of this range.
S
RAMCO near Support rangeRAMCO near it's long term support range. Following a descending triangle format in the short term, we could see a bounce back at support range and see if we could see the triangle breakout.
R
descending trianglestock is in uptrend
making descending triangle
you can buy now at price of 135-140 ( do not wait for breakout to happen)
SL below 126
target 170
trade at you own risk!!!!!!!!!!
I
V-MART : Swing OpportunityNSE:VMART is trading in a range after a huge volume breakout. The scrip is now at key support level taking multiple support at the previous resistance (S/R flip). The stock is also forming a descending triangle pattern. The volume is very less on consolidation. One can go long at CMP however this is a little risky bet as there is also one more support level at 3100 levels.
DISCLAIMER : This is not a call. The analysis shared is just for educational purpose. Please do your own analysis with pr
Swing tradeEXPLANATION : This is a Daily time frame chart of M_M . The stock has been exact Demand zone , It has formed a Descending Triangle Pattern , Double Top Pattern on 4 hr time frame , If stock has been break the zone with high volume & Retest Demand zone , ( Support Become Resistance ) Go short . If taking Support at exact zone , I am seeing a very good buying opportunity in M_M . Enter as per your setup and sit tight to achieve the maximum target .