BHARTIARTL - Buy on Support - Sell on Resistance 🔰 MY thought process :
⭐The easiest way to trade stock is to identify a good pattern at its good support lvls and resistance lvls
⭐Good breakout at supports of a descending triangle, consolidating for a while now gave a good impulsive move.
⭐Risk: SL - 515
⭐ Targets are marked
⭐ Type: Swing and investment type :)
🔰Am I taking this trade now: No---Reason: Already in the trades of Naukri and PPL as posted last time :) also took a small position in Coal India today as posted guys :)
Also keepin
Descending Triangle
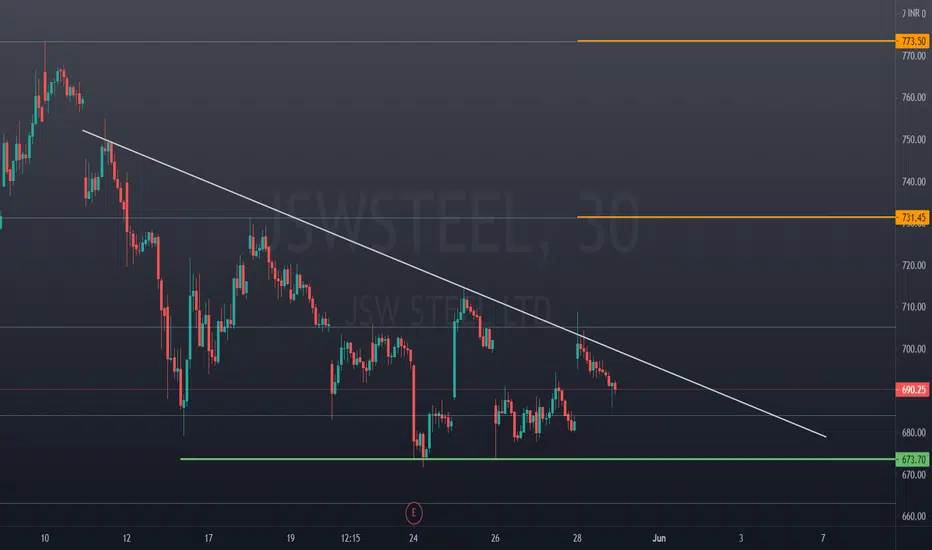
JSW Steel, SwingJSW Steel is forming a descending triangle. A break from the trendline can be traded for a target of 730 which is a high resistance region with a stop loss of 670. 673 level has support of 200 EMA, that's why SL can be taken at 670.
Make sure to trade what happens and not what you expect :)
Note: Please do not follow my idea blindly, please analyze yourself as well. I just share my idea so that people can build upon the same. The idea I share is open to healthy criticism and feedback :)
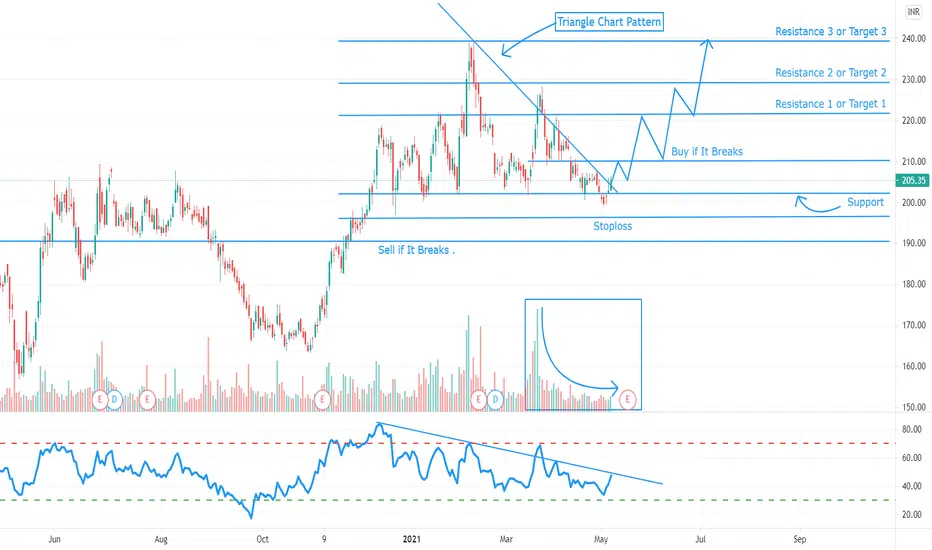
ITC - Perfect Descending Triangle | Target - 225,240🔰 MY thought process :
⭐Multiple supports at the triangles lower side and 3 times good reversal from the upper trendline
⭐Volume profile is showing its trading at the most crucial and most tradable supply demand zone, a breakout from the trendline might initiate a good upmove :)
⭐Risk : 206 can be taken as a good SL where we can take 225 as 1st target and 240 as 2nd . :)
🔰Am I taking this trade now: No---Reason: Already in the trades of Naukri and PPL as posted last time :) also took a small
⭐ JSWSTEEL | Monday possible setup🔰 MY thought process :
⭐ Making an amazing descending triangle pattern after a really big move, a break of this trendline on 30mins/15mins = a possible good trade
⭐Plan: we want a break of 706 LVL with power and volume = a breakout of the setup = our trade gets activated :)
⭐Plan: Then we wait and do nothing :) that's the best way to earn money tbh :), people who start thinking what will happen exits the trade on a red candle which makes their trading career worse so just have faith in your RR
TRIANGULAR BREAKOUT + SUPPORT & RESISTANCE OPPORTUNITY IN BIOCONThe stock has formed a descending triangular pattern which is about to witness a breakout.
The stock has major support at 368 level, and it has been testing its resistance at 422 levels consecutively.
Once the triangular breakout happens, the stock will move towards testing the resistance at 420-425.
If the resistance is broken with good volumes, the stock can move towards 450, 475, 520 levels soon.
//important levels are shown in the graph.
Buy at - 390
SL - 368
Targets - 420, 455, 475, 550.
SIS Descending triangle Formation💰all studies explained in the chart.
Bottom entry missed😥.But no probs still there is an opportunity.💰
buy & add @dips✔✔
trgt mentioned in the chart.
🧩Anytime triangle bo possible.
🧩Promsing chart.Can see descending triangle in the chart.
🧩Volume also increasing.
🧩Good q4 numbers published.
🧩Fundamentally good company.
🧩Recently it touched it's major support.So expecting a good movement in coming sessions.
About the company
Security & Intelligence Serv.(India)is directly and indirectly enga
Mahindra & Mahindra (Triangle Pattern or Cyclic Double Bottom)Scenario 1: ( Triangle Pattern )
If M_M Price forms Descending Triangle pattern. Then is a Chance for Break out @ down side, If So
Then the Entry Price Should be730
1st Target is 681.25
2nd Target is 663
Stop loss is 742
Scenario 2: (Cyclic Double bottom )
If The price Breaks above 781
Then the entry price is 781 after retesting the Zone from 798.
Target is 823
Stop loss is 766
Watch out for Multi Year Breakout - Descending Triangle PatternKesoram Industries is involved in the business activities of Manufacture of portland cement, aluminous cement, slag cement and similar hydraulic cement.
The Stock is about to break a multi year trendline resistance. There has been a continuous rise in volume in the stock indicating there is something cooking inside.
The RSI well placed at right levels.
The Company's operations are good. However, the only concern is its high Debt. That's the sole reason behind laggard performance of the stock.
ITC Ltd Technical Analysis .Hello friends after a long time , I am Again Back with a New Idea, So Today we are going to Talk about ITC Ltd . As you Know its a FMCG Company . So on 1 Day Chart it is making a "Triangle Pattern" . If i Talk About Targets , So Targets will be :- 221.10 Rs , 229 Rs and 240 Rs . So Now Lets Talk About Support and Resistances . So from Its Pivot Points .So its Major Support Is 201 Rs . Volume has dried , Rsi is in Bearish mode and Price is also going Down , Earning Reports will come on 19 May . S