 Education
Descending Triangle
Education
EURAUD WITH DESCENDING TRIANGLE FORMATIONHello Guys
We can see that EURAUD has Formed A DESCENDING TRIANGLE PATTERN in D1 Chart, which has m can be taken trade on either side based on the breakout, we are predicting that it’s gonna Go Up for a Buy trade, but in the end everything is depending on the Breakout , u can pocket 500 pips easily on this trade, hope you guys liked my analysis
Than You
All The Best Traders


BAjaj finance descending triangle patternBreakout trade descending triangle pattern bajaj finance look weak below 1915
Plane your trade....
Short
How to trade descending triangle pattern....??HINDUSTAN UNILEVER is making descending triangle in 30 min time frame.
The descending triangle is a bearish formation.
It is usually forms during a downtrend as a continuation pattern.
There are instances when descending triangles form as reversal patterns at the end of an uptrend, but they are typically continuation patterns.
Most traders look to initiate a short position following a high volume breakdown from lower trend line support in a descending triangle chart pattern.
In general, t


SEducation

SRF : Breakdown : Descending Triangle - SellSRF has given a breakdown from a descending triangle pattern on 15 mins timeframe.
Initiate short.
Target: 3543
Stoploss: 3660
 Short
Short
BHARTI AIRTELIt has given a triangle breakout which is suggesting 565-570 as long as it remains above 532
 Education
ONGC Forming descending triangle ONGC Forming descending triangle once the TL broke in either side, we can enter.


Tata Coffee - Breakdown - Descending TriangleTata Coffee has broken below from the descending triangle pattern on 30 mins time frame.
Initiate Sell.
Target: 66
Stoploss: 75
TShort

 Short
Short
 Education


BAJFINANCE break down in descending triangle with huge volumeFinally BAJFINANCE break down in descending triangle with huge volume and sitting at the major support. we can expect a gap down on Monday session and there could be some retracement(or contines the downward direction) towards the resistance. If the downward trend continues 1st target is 1601.

Descending Triangle Formation & Neutral CandlesticksDescending Triangle formation on Bank of Baroda Chart.
Descending Triangle is a consolidation pattern .
According to the pattern, a possible downside breakout is expected.
Watch the last 3 Candlesticks:-
16 April 2020 - Dragonfly Doji
17 April 2020 - Spinning Top
20 April 2020 - Long Legged Doji
All these candlesticks are neutral candlesticks .
 Short
Short
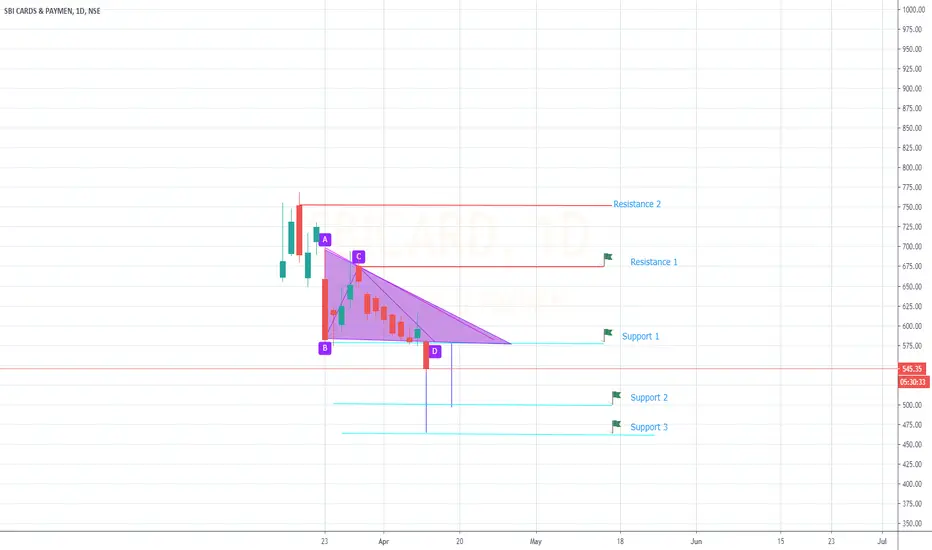
Descending Triangle in SBI CardsDescending Triangle formed in SBI card. Target 1 2 & 3 shared along with Resistance as stop loss

 Short
Short
Havells Entry 624Havells Entry 624
Stop-loss - 610
Target 765
Risk-Reward 1: 8.7
Risk 2.24% - Reward 22%
Havells trading at 624, took support around 622-630 zone multiple times in the last 6 months.
The primary trend is very strong, so utilizing this dip to get in the trend.
 Long
Long
 Education


BITCOIN SHORT (AFTER BREAKING DOWN)THE FLOOR(6000$) WHICH WAS MISSING TO BE TESTED IS ON SIGHT NOW.
HISTORY GONNA REPEAT ITSELF(6000-3200)
HUGE DESCENDIND TRAINGLE / SYMMETRICAL ALSO
BE READY GUYS TO MAKE SOME BUCKS.
#BITCOIN
#XBTUSD


Descending Triangle Breakdown in IndusInd BankBearish Breakdown Pattern in IndusInd Bank.
Though it's a heavy breakdown, let's see if it works.
 Short
Short
INDUSIND BANK Descending TriangleTechnical Overview of INDUSINDBK: In the below chart, we can see the stock is trading near very crucial support i.e. 1350. On 16th April 2019, the stock has given confirmation of Double Top and from next day has given sharp fall till 1350. From support levels given bounce up to 1670 and made Lower High. Like this stock has started to trade in a Descending Triangle, and yesterday again took exact support from the same level. As per our view, we can buy INDUSINDBK here with the stop-loss of 1345 o
Long
NSE IT Sector Looking Bearish with Descending TriangleHi Traders,
NSE IT Sector Looking Bearish with Descending Triangle as per chart.
Bearish View due to below point :
1) NSE IT Index forming Lower High & Lower Low.
2) NSE IT Index form Descending Triangle pattern on chart.
3) Heavy Weight stock of IT index like TC , Infy looking weak on chart.
4) TCS Faced resistance at higher level & got reversal to downward.
Important Support
1) 200 SMA placed at 15380 point
2) Support 1 at 15070 from where NSE IT index reversal in month of July
3)Breac
 Short
Short
Keep Eagle EyeKeep an eagle on Indusind bank
Key level - 1350 (If it manages to break it then my first target will be 1250 and final target will be 1050)
