Nifty - Descending Triangle FormationNifty is creating a bearish formation on a 125 Mins Time frame.
Since the time of Tariff Annoucement day nifty is not sustaining higher levels, infact in weekly timefram there is divergence on both RSI and MACD indicators.
NIfty holds a strong support at 25300 level if this is broken open doors for 24800.
Descending Triangle
Price Perfection: Inverted H&S, Red Zone FlipObserve the pristine price action on this chart, where every level commands unwavering respect.
-Red Zone (Initial Resistance): Price traded lower beneath this key red zone, forming a textbook inverted head-and-shoulders pattern below it—left shoulder, head, right shoulder clearly defined, signaling potential reversal setup.
-Zone Flip to Support: Once price sustained above the red zone, it flipped roles seamlessly, acting as reliable support for an extended period. This classic resistance-to-
Monthly Triangle After Epic RallyThis Post is just to showcase how beautifully the price action respects every key level, No Bias - No forecasting simple creation of price action over historical chart levels
Look at this clean pattern forming on the monthly timeframe after that massive one-sided rally.
Price beautifully respects the structure:
-Descending upper trendline (green) capping the highs with precision.
-Flat lower support (green) holding as the base—tested multiple times without breaking.
-Before the pattern, notic
RVNL cmp 310 by Weekly Chart viewRVNL cmp 310 by Weekly Chart view
- Support Zone 265 to 302 Price Band
- Resistance Zone 375 to 415 Price Band
- Rising Support Trendline providing a stable shoulder
- Descending Triangle formed at Support Zone anticipating upside breakout
- Volumes seen by Selling pressure but demand based buying cushioning it out
- Support Zone forming strong base ground and holding price and volumes front
GRWRHITECH: Descending Triangle Breakout, Chart of the WeekDouble Bottom or Dead Cat Bounce? Why Garware's Next Move Could Make or Break Your Portfolio. From ₹5,378 to ₹2,600:How a 38% Profit Crash and 50% US Tariffs Brought This Market Leader to Its Knees, and what changed now? Let's Understand in the "Chart of the Week"
As per the Latest SEBI Mandate, this isn't a Trading/Investment RECOMMENDATION nor for Educational Purposes; it is just for Informational purposes only. The chart data used is 3 Months old, as Showing Live Chart Data is not allowed
POWERGRID – Descending Triangle Breakout Setup✅ Best Entry Method (High Probability):
• Wait for a breakout close above the descending trendline in Weekly timeframe
• Ensure the candle closes above the trendline (avoid wick breakouts)
• Look for a small pullback or retest of the breakout zone
• Consider entry only after confirmation
👉 This approach can significantly reduce fake breakout risk and improve trade probability.
Patience is key — confirmation matters more than anticipation.
Berger Paints (W): Neutral-Bullish, Support Defense Pre-Earnings(Timeframe: Weekly | Scale: Logarithmic)
The stock is defending a 3-year critical support zone (₹440–₹450) just days before its Q3 results. While the technical reversal signal (Hammer) is present, the immediate direction will be dictated by the earnings reaction on Feb 5.
🚀 1. The Fundamental Catalyst (The "Why")
The technical bounce is tentative due to the upcoming event:
> Q3 FY26 Earnings (Feb 5): The market is cautious. If Berger manages to show volume growth (which has been a stru
CCL Products cmp 970.50 by Daily Chart viewCCL Products cmp 970.50 by Daily Chart view
- Support Zone 890 to 930 Price Band
- Resistance Zone 970 to 1015 Price Band
- Volumes in close sync with avg traded qty
- Rising Price Channel seem been well sustained
- Descending Triangle pattern breakout anticipated
- Technical Indicator trending positively thru Jan 2026
SHARDACROP: Strong Q3, Descending Trainlge BO, Chart of the WeekFrom Descending Triangle Breakout to Q3FY26 Glory: Why Sharda Cropchem's Could Be Your Next Big Move Lets Understand in "Chart of the Week"
As per the Latest SEBI Mandate, this isn't a Trading/Investment RECOMMENDATION nor for Educational Purposes; it is just for Informational purposes only. The chart data used is 3 Months old, as Showing Live Chart Data is not allowed according to the New SEBI Mandate.
Disclaimer: "I am not a SEBI REGISTERED RESEARCH ANALYST AND INVESTMENT ADVISER."
This a
RVNL cmp 319.15 by Daily Chart viewRVNL cmp 319.15 by Daily Chart view
- Support Zone 294 to 306 Price Band
- Resistance Zone 332 to 345 Price Band
- Support Zone tested retested over past few days
- Support Zone since January 2025 seems been sustained
- Volumes below avg traded quantity, need to increase for fresh upside
- Breakout from Descending Triangle pattern might be in the making process
Info Edge India cmp 1377.70 by Daily Chart viewInfo Edge India cmp 1377.70 by Daily Chart view
- Support Zone 1268 to 1315 Price Band
- Resistance Zone 1405 to 1455 Price Band
- Darvas Box : Stock trading in 1300 to 1432 Range
- Falling Resistance Trendline Breakout attempts made
- Volumes spiking regularly above average traded quantity
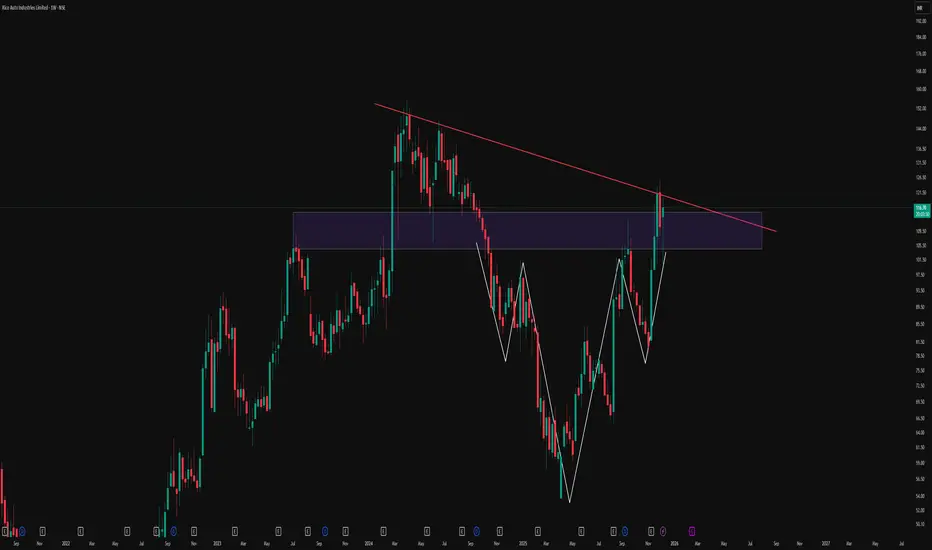
Reclaiming The Breakdown: Descending Triangle To Inverse HnSThis weekly chart of Rico Auto illustrates how structure can evolve over time and why rigid bias around a single pattern can be misleading. Price initially respected a clear descending trendline, forming a classic descending triangle and eventually breaking down below the support zone. Instead of continuing in a straight-line downtrend, the market absorbed that move and began to build a broader basing structure.
Over the following swings, price developed an inverted head and shoulders formation
Descending Triangle PatternThis can be a profitable trade because of :
1. The stock is forming Descneding Triangle Pattern which can give potential momentum till 12-15%.
2. The stock's current low is a bit above the previous one and can be also see in the RSI.
3. DLF has given very strong QoQ resultand has shown very high profit.
The Stock's upcoming target are marked using Trend based Fibonacci Extension Tool.
Decoding the Descending Triangle: Key Structure & FVG🔻Understanding the Pattern
- The chart above highlights a classic descending triangle pattern, easily visible by its series of lower highs (marked in red) and a relatively consistent demand zone acting as support.
- This resistance trendline (CT—Contraction Trendline) has been tested multiple times, confirming its significance as sellers consistently respond to price rallies by pushing back from lower levels.
🔻Equilibrium and Price Exploration
- Notice how price action moves from the equilibri
Mastering MTFA Charts : Symmetrical & Descending PatternsObserve the synergy of multiple time frames with this detailed analysis of Bhageria Industries Ltd.
Target Points -
1) The right panel displays a monthly chart, highlighting a broad symmetrical triangle formation within a prominent supply-demand zone—notice how the structure showcases the interplay of lower highs and higher lows, reflecting a period of equilibrium and market compression.
2) The left panel brings the focus to the weekly time frame, where a descending triangle pattern unfold
Descending Triangle fake breakdowns explainedThe daily chart for Utkarsh Small Finance Bank Limited displays a well-defined descending triangle, marked by a consistent supply trendline and an established horizontal support zone. During the recent price action, there was a temporary dip below the support, which was quickly retraced as price action returned within the range and formed a distinct lower wick rejection candle at the base.
This chart highlights the role of false moves and re-entries within important technical zones, as well as
Ganesh Housing cmp 861.60 by Weekly Chart viewGanesh Housing cmp 861.60 by Weekly Chart view
- Support Zone 790 to 830 Price Band
- Resistance Zone 950 to 1000 Price Band
- Descending Triangle Breakout in the making process
- Support Zone seems tested retested over the past few weeks
- Volumes are flat, need to increase for fresh upside price movement
Don’t Miss This Rare MCX Setup Breakout + Retest= Big Move AheadHello Traders!
Today’s analysis is on MCX Ltd., where we just spotted a powerful Descending Triangle Breakout . After weeks of consolidation, the price has finally broken the falling resistance and even retested the breakout zone. This setup often leads to a strong trending move.
Why this setup is special?
Price respected support multiple times, showing heavy demand from lower levels.
Breakout + Retest makes it one of the most reliable continuation patterns.
Risk–Reward is highly favorabl
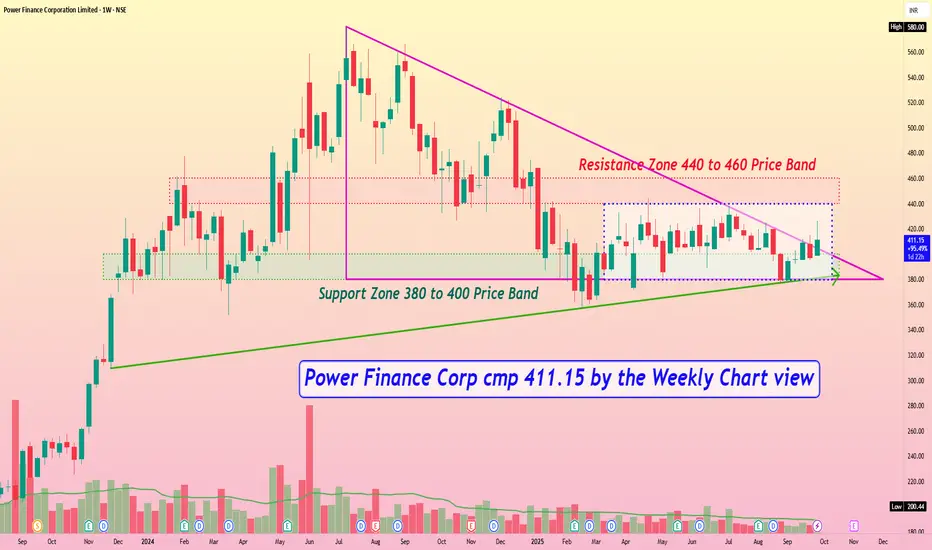
Power Finance Corp cmp 411.15 by the Weekly Chart viewPower Finance Corp cmp 411.15 by the Weekly Chart view
- Support Zone 380 to 400 Price Band
- Resistance Zone 440 to 460 Price Band
- Price traversing within Descending Triangle pattern after ATH
- Rising Support Trendline well respected by touch points since close to 2 years
- Price seen majorly trending inside Darvas Box since Mar 2025 in a range of 380 to 440
- Volumes in close sync with avg traded qty on Daily Chart and in steady stream by Weekly Chart
Monthly Descending Triangle & False BreakdownA descending triangle on the monthly chart shows lower highs converging toward a flat support, reflecting mounting seller pressure and key institutional interest at the horizontal base
The red counter trendline highlights corrective rallies within the broader down-sloping resistance.
The red demand zone marks where significant buying absorbed prior declines, offering a structural support area.
The white box illustrates a false breakdown below support—a liquidity-grab that shook out weak hands
Multi-Pattern Mastery: Descending Triangle Meets Broadening FormThis chart demonstrates the power of multi-pattern recognition in technical study,showcasing how a descending triangle (white lines) can coexist with a broadening formation pattern (red ascending line with shared lower base). The descending triangle shows consistent lower highs against a stable support level, while the broadening pattern reveals expanding volatility through higher highs and the same lower boundary.
Patterns to Study :
Descending Triangles: Characterized by horizontal support
Granules India: Critical Descending TriangleGranules India Limited presents a descending triangle pattern on the weekly chart. The price has moved from the established support zone near ₹440-450 and is currently challenging the resistance trendline around ₹492.25. This movement appears with a marked increase in trading volume, highlighting the level where buyers and sellers are most active.
Pattern Character
A descending triangle pattern is identified by a series of lower highs against a stable support base. Granules India’s recent actio