WTI Crude Oil Descending Triangle Pattern
WTI is forming a Descending Triangle pattern near recent support.
📊 Technicals : Flat base with lower highs compressing price action.
🔎 Key Levels: Breakdown below support 65 Leads To bearish continuation;
bounce above resistance 71 Leads To reversal setup.
⚠ Risk View: Energy fundamentals remain mixed — confirmation with volume is essential.
👉 Tactical takeaway: Wait for a breakout from the triangle before committing directionally.
Descending Triangle
BSE Ltd cmp 2482 by Daily Chart viewBSE Ltd cmp 2482 by Daily Chart view
- Support Zone 2270 to 2345 Price Band
- Resistance Zone 2525 to 2585 Price Band
- Descending Triangle pattern Breakout seems sustained
- Stock seems trading within price range indicating Darvas Box setup
- Volumes seen gradually syncing closely with the average traded quantity
- Most known Technical Indicators BB, EMA, MACD, RSI, SAR seem trending positively
BALAJEE - Descending Triangle Meets Multi-Pattern ConfluenceOn the daily chart of Balajee, price action has formed a descending triangle right at the lower end of the trend:
🔻 Lower highs consistently pressuring horizontal support.
🟩 Price sitting within a clear demand zone, adding significance to the structure.
📊 Volume tapering off through consolidation, a classic triangle trait.
📐 Presence of a hidden counter-trend line (dotted) hinting at a potential broadening formation — showing a rare multi-pattern overlap.
Such setups are important not for pred
MANKIND PHARMA – Descending Triangle Breakout________________________________________________________________________________📈 MANKIND PHARMA – Falling Trendline Breakout | Strong Reversal Candle | Volume Spike
🕒 Chart Type: Daily Chart
📆 Date: July 9, 2025
________________________________________________________________________________
📌 Price Action:
MANKIND PHARMA has executed a decisive breakout above a falling trendline on the daily chart, breaking out of a multi-week descending structure. The price action had been consolidating withi
HINDZINC - NSE | Daily Chart Analysis📊 HINDUSTAN ZINC LTD (HINDZINC) – NSE | Daily Chart Analysis
📅 Date: May 30, 2025
📈 CMP: ₹464.75 (+2.68%)
📌 Ticker: NSE:HINDZINC
🧠 Technical Breakdown
🟢 Descending Trendline Breakout 🟢
The stock is showing early signs of strength as it approaches the apex of a long-term descending trendline. Price action is attempting a trendline breakout from a nearly year-long downtrend, suggesting the possibility of a bullish reversal.
🔍 Volume Confirmation
Steady volume buildup over the past few sessions,
TILL - Descending Trendline Breakout Watch📊 TIIL – Descending Trendline Breakout Watch | Key Fib Retest in Play
🕰️ Timeframe: 1D | 🧭 Pattern: Descending Triangle | 🎯 Fibonacci Reversal Setup
📈 Technical Analysis Summary:
TIIL is currently approaching a major trendline resistance, drawn from its all-time high. After a long downtrend, the stock is now testing the 50% Fibonacci retracement level at ₹2,731.35 with rising momentum.
The price is hovering near a breakout zone and consolidating just below resistance, hinting at potential bull
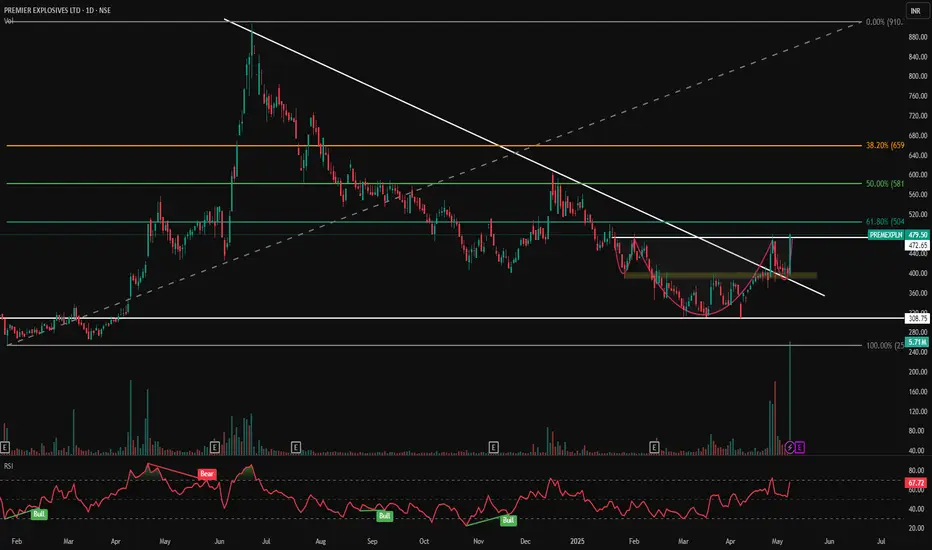
PREMEXPLN - Cup & Handle Breakout | Volume Surge📊 PREMEXPLN – Cup & Handle Breakout | Volume Surge + Key Fibonacci Confluence!
🕰️ Timeframe: 1D | 📐 Pattern: Cup & Handle | 📊 Momentum: Bullish
📈 Technical Chart Overview:
Premier Explosives has executed a clean breakout above a long-term descending trendline and a cup & handle base with a massive spike in volume, hinting at a powerful trend reversal.
Price surged nearly +19% intraday, confirming strength near the 61.8% Fibonacci retracement from the previous swing high at ₹910.30 to the swing
HEROMOTOCO-Positional Short Trade Stock upside taking support from trendline. Friday's session 25'th April The stock has shown weakness potential trend reversal.
There are two possibilities:
1)Head and Shoulder Pattern
2)Descending Tringle Pattern
For both the possibilities it the neckline/Support zone 3800 needs to break. If that happens it may test 3680.
If opens gap up Above 3960 Avoid!
Please don't forget click on follow button so you won't miss any upcoming ideas.
Any confusion, feel free to drop msg. Happy to help :)
BANKBARODA-Intraday- Short tradeBANKBARODA has formed Descending tringle in 15minute timeframe.
The key level to watch on 15th April trading session would be 230 if breaks It would be in downtrend for short term till 223 to 220.
If it opens gap up please avoid.
Please don't forget click on follow button so you won't miss any upcoming ideas.
Any confusion, feel free to drop msg. Happy to help :)
This is only for educational purpose, please manage your risk accordingly.
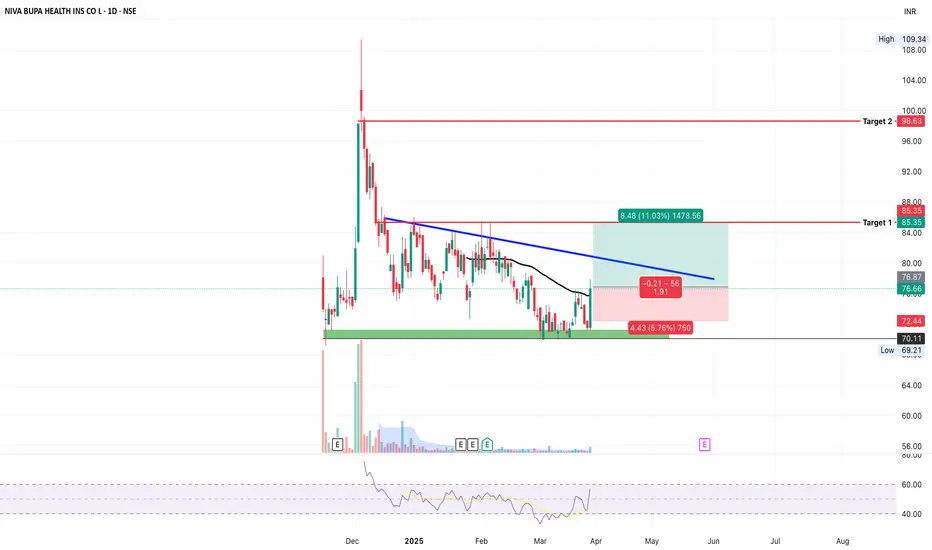
NIVA BUPA HEALTH (NSE: NIVA) – Breakout PotentialRight now, it is completing a descending triangle breakout, which is a bullish pattern.
The stock has been consolidating for the past 4 months in a tight range, building strength for a breakout.
All important levels have been marked on the chart.
Looking at the chart, we can say that if the price breaks to the upside, there is a high probability that the stock will reach the ₹98.63 target.
For the past few days, volume has also been quite good. If we enter the stock at ₹76.66, we can achie
Nifty Breakdown: A Retest of 21,300-21,000 on the Cards?Nifty has decisively broken out of a Falling Wedge + Descending Triangle, confirming a Lower High-Lower Low (LH-LL) pattern. If this bearish momentum sustains, we could see the following levels:
Immediate downside toward 22,500
In the worst-case scenario, a retest of 21,300-21,000—the lows last seen during the election volatility of June 2024.
🚩 What’s Adding Pressure?
1️⃣ Midcap, Smallcap, and Microcap indices have also broken down from their bases, intensifying the bearish sentiment.
2️⃣
Birlasoft Ltd : Ready for a BreakoutBirlasoft Ltd is a company engaged in computer programming, consultancy, and related activities. It provides software development and IT consulting services.
Pro:
Almost debt-free
Good profit growth of 18.2% CAGR over the last 5 years
Healthy dividend payout of 28.3%
Technical Analysis: \
The stock is forming a Descending triangle pattern , indicating a potential breakout.
Volume is also building up from the last swing low.
Expecting a good profit for the upcoming quarters
Stop Loss
Morepen Lab Near Key Support – Big Move Ahead?Morepen Laboratories (NSE: MOREPENLAB) - A Critical Technical Setup
In-Depth Chart Analysis
1. Descending Trendline Resistance:
• The stock is moving within a descending triangle pattern, with a clear downward trendline acting as resistance since the peak around ₹120.
• Currently, the stock is approaching this trendline near ₹80. A breakout above this level, supported by strong volume, could trigger bullish momentum.
2. Key Moving Averages:
• 200-Day EMA (Exponential Moving Average): The
2 Potential Swing trading stocks for 23 December MarketsI daily make educational content videos for swing / positional trading
Both are Potential swing trading ideas that are not active yet. I have explained the setup, pattern, and line-making behind them with a solid plan. Let's see if the plan gets activated.
Analyzing morepen laboratories _12th DEC 24BULLISH BREAKOUT :
TECHNICAL OVERVIEW - The stock chart of Morepen Laboratories Ltd. on a daily timeframe, showing a breakout from a descending triangle pattern. This technical breakout, accompanied by higher trading volumes, suggests a bullish momentum in the stock price, as the resistance line has been breached decisively. The 50-day Simple Moving Average (SMA) below the price indicates a positive trend, further supporting the likelihood of upward movement. Traders may consider this breakout
Pidilite Industries - Descending TriangleThe descending triangle chart pattern in Pidilite Industries Ltd. suggests a potential bearish trend. It forms with a horizontal support level and a downward-sloping resistance line. As price consolidates, if breakdown below the support may signal a further decline, indicating possible weakness in the stock. Traders often watch for a breakout confirmation.
Descending Triangle 60% continuation and 40% reversal.
Actual Success Rates of Ascending and Descending TrianglesActual Success Rates of Ascending and Descending Triangles
Here is an analysis of the actual success rates of ascending and descending triangles in trading, based on the information provided:
Success Rates
Ascending and descending triangles generally have fairly high success rates as continuation patterns:
-The ascending triangle has a success rate of approximately 72.77%.
-The descending triangle has a slightly higher success rate of 72.93%.
These numbers come from a study that tested over