NIFTY50 in perfect descending triangleIn my previous analysis, I spoke about NIFTY being stuck in 2 channels at a DAILY time frame. Here again, I bring to you another channel but in a smaller time frame of 15 MIN. Looks like it's in a perfect descending channel ready to break. If there's a gap down it will enter the bearish territory. FIIs are putting a huge selling pressure so my bet is that it may break to the downside and give interesting intraday shorting opportunity at a low risk-reward ratio. I will post my trades for tomorrow
Descending Triangle
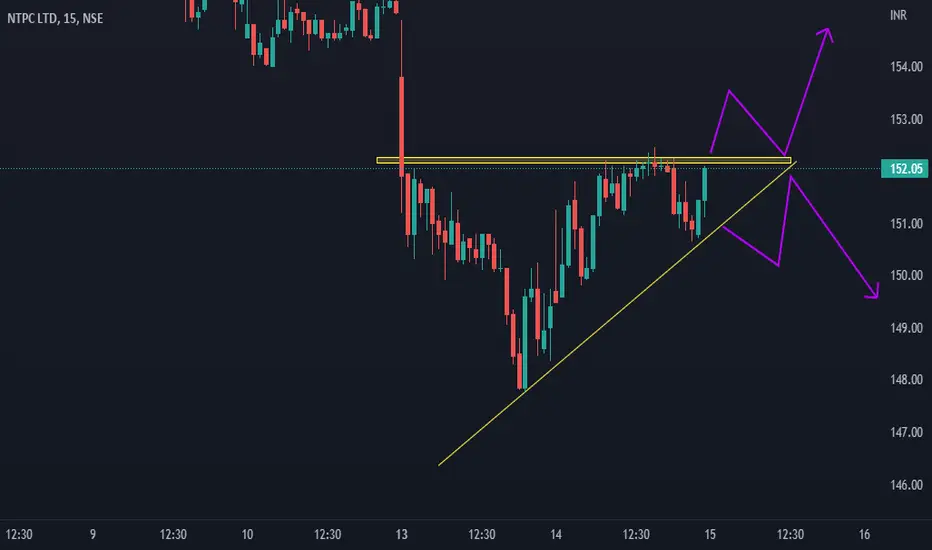
NTPC LTD 15min Descending Triangle In 15min TF, we can see that there is a descending triangle pattern. It can breakout either side in Intraday.
We can go LONG if it breaks the Resistance @ Rs150-155/-
If the price breaks the trendline of the triangle, we can go SHORT. The nearby support is at Rs. 145-147/-
Descending Triangle PatternDescending Triangle Pattern: Descending triangles have a falling upper
trendline as a result of distribution and are always considered bearish signals.
Target:-Most traders look to initiate a short position following
a high volume breakdown from lower trend line support in a descending triangle
chart pattern. In general, the price target for the chart pattern is equal to the
entry price minus the vertical height between the two
trend lines at the time of the breakdown.
CMP 406
T1/2/3 340
JKPAPER --> DESCENDING TRIANGLE BREAKOUTNSE:JKPAPER
TECHNICAL ANALYSIS
--> JKPAPER has given a breakout from its previous ATH which is 285. and also has given a breakout above its Trendline joining all previous ATH.
--> JKPAPER has broken out of the DESCENDING TRIANGLE after consolidating above its previous ATH.
ENTRY
--> Take a postion when stock gives 1 HR closing above 325.
STOPLOSS
--> SL can be placed below the breakout candle at 302.
TARGET
--> Target= Depth of the cup which is around 375.
Nifty AnalysisNifty has reversed from the lows with good momentum and broke out the Descending Channel. After the breakout the momentum is still Bullish, however index made a Gap of 200 points between 16-17Mar, possibilities are that this gap will get filled in upcoming sessions. Now talking on Support the 1st zone which can give Nifty a cushion is 16800 while 2nd support will come at 16350, On higher levels Index can see resistance at 17450, 17660 & 18180.
Symmetrical Triangle - Full ExplanationA Symmetrical Triangle is considered a bullish signal, indicating that the current uptrend may continue. It is a bullish continuation pattern. It is a volatility contraction pattern. This means volatility in the market is shrinking and a sign the market is likely to breakout, soon. A Symmetrical Triangle shows two converging trendlines, the lower one is ascending, the upper one is descending. The formation occurs because prices are reaching both lower highs and higher lows. The pattern will disp
dhampur sugar millshare name : dhampur sugar mill
call type : poistional
- share is consolidating in a tight range from a
very long time and forming a descending
triangle too
- We can see a clear breakout on descending
triangle and range too
- we can accumulate this share above 345 level
with target of 400 and 472 with sl of 300
thanks
Critical view on Nifty !!!!Nifty is forming descending triangle pattern, so we will wait till nifty gives breakout from this pattern for going long
and will wait for breakdown below 16850 to go short as there is four bottoms. More probability is of breakdown amid conditions of war.
Short nifty below 16850.
I also have attached the image of yesterday's data how negative it was which does not support yesterday's intraday bounce,
and indicated for a bad news to come tomorrow and suggested a gap down.
Nifty Analysis | Trade PlanAs per current market sentiments and global news we can see bearish momentum in Nifty 50 in upcoming days. Technically also the Index is forming descending triangle pattern taking support at 16900 -800 zone and once this support breaks than we can see Nifty to 17600 levels. Now talking about the levels plotted on chart we can plan out trade based on these area, the beaeish breakout level is crucial to watch out for but If it gets broken then we can see T1 & T2 as per our study, however the only
Tomorrow levels for Nifty 50So, guys after analyzing the chart we can see clearly a descending triangle pattern on 15 min time frame which shows us that market is looking weak. According to the chart pattern tomorrow we can look for short positions below 17235 and book our profits at 17100 price level. Best of luck.
Descending Triangle - Full ExpanationWhat is descending triangle ??
The descending triangle is one of the top continuation patterns that appears mid-trend. Traders anticipate the market to continue in the direction of the larger trend and develop trading setups accordingly.
The descending triangle is a bearish pattern that is characterized by a descending upper trendline and a flat lower trendline that acts as support. This pattern indicates that sellers are more aggressive than buyers as price continues to make lower highs. The p
What's up with KPIT?KPIT has delivered stellar returns to the investors in the past two years. Stock is currently trading at the support level of a Descending triangle pattern. If it closes below the 600 level, it can fall further to 500 levels. However, if it breakout from the pattern, it can reach its previously high levels.
Cheers! This is as per my Analysis. Feel free to share your view about this. Please do your analysis before trading/Investing.
Happy Trading
Buy entry in #Cipla @BO1. 850 zone was tested several times and acted as a strong support.
2. From 24th Jan bull run/extended move was seen. Correction was yet to be come after such move.
3. It was into consolidation (correction in time) from last 4 days i.e. from 1st Feb.
4. Also bottoming tail bar, shakeout bar, no range body bar is seen in consolidation , tug of war is fought between bulls and bears.
5. Entry will be above 959 & stoploss will be below the bottoming tail i.e. @938
6. 995-1005 will be the profit book