Education

Education

 Education

Doji Formation (Indecision Candles) is the New TrendFor the past four weeks (3rd week of June to 2nd week of July), Nifty 50 NSE:NIFTY has shown extreme range-bound volatility. The volatility imprinted each week has built a culture of forming "Doji (s)" or indecision candles. In one instance, there is also evidence of a green spinning top. Even the green spinning top is considered an indecision candle. Thus, for the past four weeks, traders have been through a roller-coaster ride.
The article aims to understand the present culture of how the Nifty 50 Index is being traded. Specifically, it highlights the way doji candles are omnipresent in the existing market conditions. Lastly, it is evident that positional trading is not viable in the present market conditions, but opting for pure intraday trading is less risky.
What is Doji?
Doji is a Japanese term that means ‘Indecisiveness’ or ‘the same thing.’ The single candlestick pattern ‘Doji’ is defined as the price behavior for a particular session where the closing price has been the same as or near the opening price. Additionally, Doji shows evidence of large wicks (or candle shadows). It means that the price has shown large fluctuations during the trading session, but ultimately it closed near or at the same zone as the opening price. In the case of Doji, there is hardly any evidence of the body. Also, the presence of longer shadows confuses traders. Thus, the pattern is infamously identified as an indecisive session.
Formation of Long-Legged Doji
It is observed that Nifty 50 has consistently formed long-legged doji for the consecutive four weeks (except one green spinning top, which can also be considered as an indecisive session). Long-Legged Doji is also considered the perfect indecisive candlestick pattern. The open and close prices are equal. Also, the body stays perfectly in the middle of the upper and lower shadows. In a Gravestone Doji, though the session is indecisive, sellers still dominate. In the case of a Long-Legged Doji, both bulls and bears fail.
Impact of Consecutive Doji formation on Nifty 50 Trading
In the weekly sessions, holding on to directional trading has been extremely difficult. From a trader's perspective, any traders who have held their directional position speculating the continuation of the trend (either bullish or bearish) have been brutally punished by the market. The moment traders have speculated a continuation of the trend is the moment the market has changed its direction. The extreme range-bound volatility has been beneficial only for the intraday trend traders and the non-directional traders.
Is Doji a continuation pattern or a trend reversal pattern?
It is observed that after the completion of the indecisive session, most of the traders lose capital or end up at break-even. Furthermore, it directs the traders to speculate on the next trading session. The biggest disadvantage of working in a Doji session is that it shows the possibility of both trend continuation and trend reversal. But nothing happens. In this case, technical analysis or speculation does not work. Here comes the significance of philosophy. Traders need to nurture the philosophy that the future is unknown. A Doji session even escalates the uncertainty of future prices. It is unfortunate but true that technical analysis fails here. A short philosophy for traders to mitigate future price speculation after a Doji session is as follows:
“Be comfortable not knowing”
What's Next in the Nifty 50 Price Action?
Even if the weekly sessions have been extremely volatile and range-bound, there is hope. For the past four weeks, it can be observed that the price is slowly forming a high-highs and lower-lows structure. At least, the closing of each week is above the closing of the previous week. Also, Nifty 50 has formed a strong support zone or neckline at (23900 - 23700). Price sustaining above the zone of (23900 - 23700) could be considered bullish. Also, we have to keep an eye on the closing of the upcoming weeks. If the closings are above the previous week's closing, then it could be a relief for the bulls.
Disclaimer:
(i) The post is purely based on technical and chart analysis. The author has not studied the fundamentals. Thus, any fundamental or macroeconomic event can disrupt chart analysis.
(ii) The author has no intention to promote buy or sell recommendations.
(iii) The post is only for educational purposes.
(iv) Novice traders should stick to the cash segment for swing trading instead of F&O. This post has no intention to promote F&O trading.
(vi) Please be mindful during trading and investment decisions. Be Responsible.
Happy Trading!
 Education

Education
 Education

Trading Masterclass #1Institutional trading means trading like hedge funds, banks, prop firms, and professional desks. They do not trade based on emotions, random tips, or gambling. They use systems, probabilities, risk control, position sizing, discipline, and psychology.
Retail traders often lose because they focus only on “entry.” Institutions focus on:
Risk Management
Capital Protection
Position Sizing
Probability
Psychology
Consistency
Repeatable Edge
Education

 Education

 Education

Part 1: Doji Trap - Why Traders Misread Market IndecisionHello Traders, this article has two parts: theory for understanding the concept, and practical for real market application.
What is a Doji?
---------------------
A Doji candlestick forms when the open and close prices are nearly equal. It shows that buyers and sellers fought, but neither side gained clear control. Think of it like a tug of war ending in a draw.
Psychology Behind It
----------------------------
A doji tells you:
1. Buyers pushed the price
2. Sellers pushed back
3. Market paused
4. Uncertainty exists
This often happens:
1. Before reversals
2. During trend exhaustion
3. Before breakouts
4. During consolidation
Yet, doji alone means nothing without context.
Types of Doji: (3 line explaination)
--------------------
1. Standard Doji
It has a small body with upper and lower wicks.
Meaning: pure indecision.
Setup: Wait for the confirmation candle.
2. Long-Legged Doji
It has Long upper and lower shadows.
Meaning: extreme battle between buyers and sellers.
Setup: Often appears before big moves.
3. Dragonfly Doji
It Looks like a “T.”
Open, close, and high are nearly the same.
The lower shadow is long.
Meaning: Sellers pushed down, but buyers rejected lower prices.
Setup: Usually bullish if found at support
.
4. Gravestone Doji
It looks like an upside-down “T.”
Long upper wick.
Meaning: Buyers pushed higher, but sellers rejected it.
Usually bearish at resistance.
5. Four Price Doji
It shows almost no movement.
It's Rare.
It shows an extreme lack of activity.
It usually has low liquidity.
How to Read Doji Correctly?
-------------------------------------
1. Where did it form?
At support = reversal
At resistance = rejection
At the middle of the range = often noise
2. What trend came before it?
After a strong uptrend? = Possible exhaustion
After a strong downtrend, = Possible buyer absorption
In the Sideways market, = Usually meaningless
3. Volume:
High volume doji = stronger signal
Low volume doji = weak signal
4. Confirmation candle:
Bullish confirmation - Next candle closes above the doji high
Bearish confirmation - Next candle closes below the doji low
Best Doji Trading Setups
---------------------------------
1. Reversal Setup
This setup appears after the market has already moved strongly in one direction and begins to lose momentum.
A doji forms near an important support or resistance zone, showing that the dominant side is starting to weaken.
It reflects hesitation as buyers and sellers reach a temporary balance after an extended trend.
The setup becomes valid only when the next candle confirms the reversal by breaking strongly in the opposite direction.
This is considered a high-probability setup because it often marks exhaustion before a trend change.
2. Breakout Pause Setup
This setup develops when the price is consolidating within a narrow range before making its next move.
A doji appears near a key breakout area, signaling temporary indecision and reduced momentum.
This pause often represents the market gathering energy before a strong expansion.
If the next candle breaks decisively above resistance or below support, it confirms the breakout direction.
Traders use this setup to identify explosive moves that begin after short periods of compression.
3. Fakeout Trap Setup
This setup occurs when the price briefly breaks above resistance or below support, creating the illusion of a real breakout.
A doji then forms, revealing hesitation and lack of conviction in the breakout attempt.
This often signals that the move was designed to attract breakout traders into weak positions.
Once trapped traders enter, the price sharply reverses back inside the range.
This setup is highly effective for spotting false breakouts and trading the reversal back toward liquidity.
4. Smart Money Trap Setup
This setup happens when institutional players intentionally push prices beyond obvious technical levels.
The purpose is to trigger retail stop-losses and create liquidity for larger market participants.
A doji often forms at this point, showing indecision as smart money absorbs positions from emotional traders.
The sharp rejection that follows confirms the liquidity sweep and reveals the true market direction.
This setup is especially powerful for traders who understand market structure, stop hunts, and liquidity-based price action.
Common Beginner Mistakes
-----------------------------------------
❌ Trading every doji as if it is a direct buy or sell signal without first analyzing the overall market context and structure.
❌ Ignoring the surrounding market structure, such as trend direction, key support and resistance zones, and liquidity areas where the doji is forming.
❌ Entering trades immediately after spotting a doji without waiting for a confirmation candle to validate the market’s next direction.
❌ Overlooking volume analysis, which often reveals whether the doji represents genuine indecision or simply weak market participation.
❌ Relying only on very low timeframes, where doji candles frequently appear as random market noise rather than meaningful price action signals.
A doji is a clue, not a complete trading signal, and its real value comes only when it is combined with context, confirmation, and proper market analysis.
]Practical Trading Rules [
--------------------------------
Always identify the overall market trend before acting on a doji signal.
Mark nearby support, resistance, and liquidity zones where a doji forms.
Wait for confirmation from the next candle before entering a trade.
Use stop-loss placement beyond the doji wick for better risk control.
Never trade a doji in isolation without a supporting market context.
A Doji is not a buy or sell signal by itself. It is a message from the market that momentum is pausing and a decision is approaching. Traders who combine doji analysis with structure, volume, confirmation, and liquidity concepts can transform a simple candlestick into a powerful decision-making tool.
Please wait for the next part, where we will cover the practical side in detail. Education 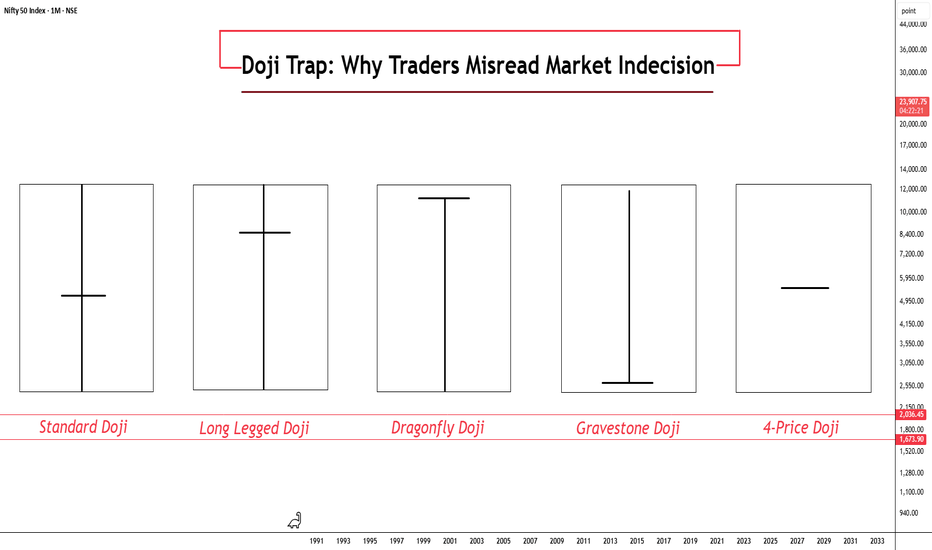


Education

Technical AnalysisCore of Technical Analysis
Technical Analysis is the study of past price movements, volume, and market trends to predict future price direction.
3 Main Principles:
Market Discounts Everything
All news, emotions, and fundamentals are already reflected in price.
Prices Move in Trends
Markets usually move in uptrend, downtrend, or sideways trends.
History Repeats Itself
Human psychology creates repeating chart patterns.
Key Tools:
Charts (Candlestick, Line, Bar)
Support & Resistance
Trendlines
Indicators (RSI, MACD, Moving Averages)
Volume Analysis
Patterns (Head & Shoulders, Double Top, Triangle)
Goal:
Find good entry, exit, and risk management points for trading.
 Education

Education

Education
Education

Education