Mahi Mahi: If A Stock Is Down 2%, It Can Be Down by 4 %That's true..down 2% doesn't mean it can not go down further. But the conditions are that: It should be in a strong downtrend on a higher time frame; and we should have proper tools and system to manage our trade.
M&M has been in a strong downtrend on Daily, 4H and H. So I thought it could be nice short. But by the time I could open my lappy, stock was already down 2%..how lame.
I opened up my Ichimoku System and saw that stock had given a fresh break down below the cloud with higher volumes on 15 min chart (See candle A) and it was already in bearish territory on higher time frames. All I need to do was to find a better opportunity to enter.
Candle B went deep into the cloud and then sold off quickly. I placed a sell order below the small swing @ 1319.50 and got hit in the very next candle C. My initial stop was above the high of candle B.
Then I kept on trailing. The doji pointed in the chart had a nice volume but price was able to breach only a few paisas above this doji, and I was not stopped.
# I always give some room above the high of the candles when I trail so that I am not hit easily.
Finally I was thrown out of the trade @ 1303.60. It was a nice 16 point trade or 1% of the stock value. Whenever I get 1% of the stock value as profit I call it a good trade. Without a good system in hand, I might not have touched the stock.
Above trade does not mean that I dun lose. I had a small loss in SRT buy, which I covered later in the session by shorting it. Sometimes it takes time for daily trend to clarify itself. I was breakeven in Tataglobal and you all know about Mindtree :)
The above experience would definitely help me to be more disciplined in future. I hope the same for all traders.
Have Fun, and happy weekend.
Hit like and comment.
Regards
Bravetotrade
Doji
Nifty: 31st July Session And Preparation For TomorrowToday market opened with a gap and faced resistance at 10048 but showed strength and held the first 15 min. low. It then broke out of the resistance, made a new high of 10061, retraced and gave a false beak out of the day's high. After that a tweezer top can be seen along with a bearish pattern which looked like a top for today. But market gave a false breakdown through the support of 10048 and the Doji gave some hope to the bulls. The rest of the session was all bull control and bears covering their shorts.
If bulls take control tomorrow we may test out minor target at 10095 and probably the final target 10114. OR the bears may be aggressive in the morning and we may face some retracement, In that case PRZ are the area (see the chart) to watch out for an upside reversal.
Hit Like/Comment if this information is useful.
Trade Safe,Stay Healthy
Best Regards
Bravetotrade
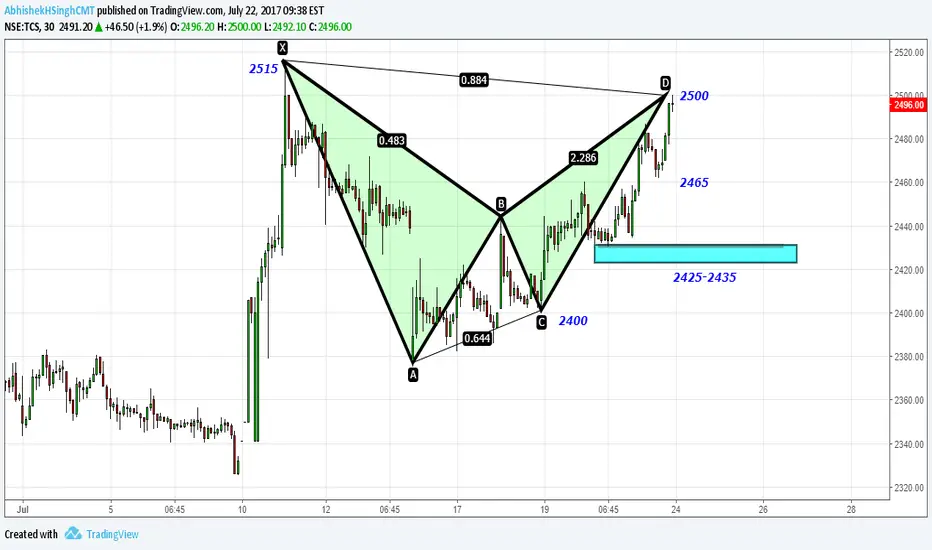
TCS - Bearish Bat & Doji Candle at 2500- Target 2465-2430-2400Bearish Bat at 2500. If TCS goes below 2490 - I shall be looking for target 2465-below 2465 for 2430 -below 2425 for 2400 & below 2400 -can be 2345.
Stoploss above 2516 ( 1 point above X- level)- In first place once it dips below 2490 - it should not bounce above 2500 which will early signal to be cautious in the trade else we enjoy 2465- 2430.
Candlestick Pattern- We have doji candle
What is a 'Doji'
Doji candlesticks look like a cross, inverted cross or plus sign. Alone, doji are neutral patterns that are also featured in a number of important patterns. A doji candlestick forms when open and close are virtually equal.
In our case open & close for current candle is 2496 so it qualifies for a doji candle.
When to execute the trade
As doji is a neutral pattern - we should wait for market to dip below 2492 - we will take 2490 as trigger point for targets mentioned above 2465- 2430 & below 2425 for 2400 & below 2400 for 2345.
If it bounces like a ball from 2425-2435 zone
Also, If TCS holds 2425-2435 - one can take long positions(buy) with stop loss below 2425 & target- 2465- 2500- 2525
IDBI Long Doji Start at Crucial Fib LevelThe stock has formed a Doji Star on 09.03 and Buy signal was confirmed on next day as price traded above the high of it. Moreover it was at Crucial 50% of the last swing so one can go long at this level by providing a small stop loss. One can easily expect 2-3 times reward of the risk taken.
Crompton Greaves LongI would go long the stock because
a. it made a bullish Doji Star 2 days ago at significant 50% retracement level.
b. Primary trend of small swings being supported by the trendline.
c. Last Bar is giving opportunity to enter at cheaper price so Stop Loss is affordable.
One can go long providing suitable Stop Loss and expecting the target double the risk provided.
CLong
Doji at the Supply zone : SAIL shortDoji candle formed at the supply zone suggests a short entry at this level. I would look for a short if it trades below 50.45 level tomorrow with stop loss of the high made in the recent bar. By risking this small Stop loss I would look to take profit 2.5 - 3 times of it. Happy trading!
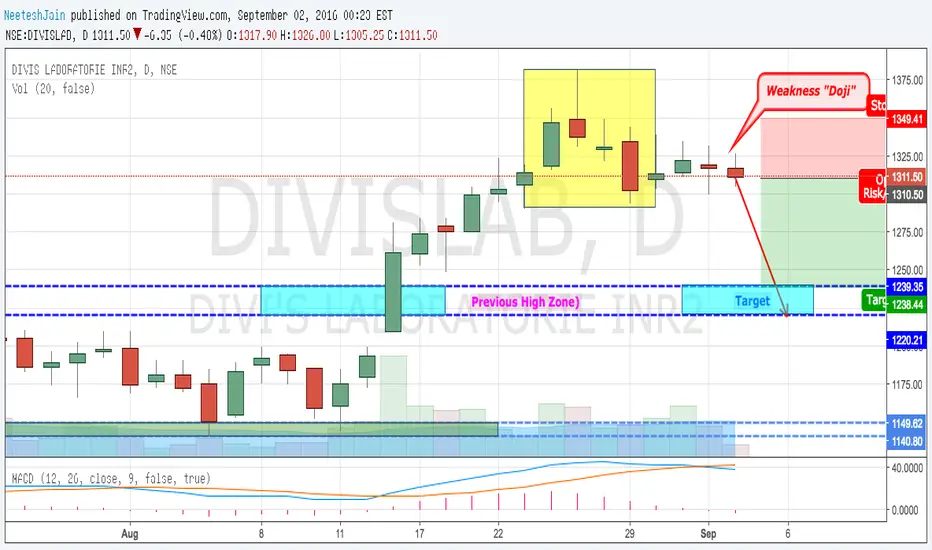
Divis Lab - Showing Weakness - After Formation of PINBAR CandlesIt is been observed that the selling pressure is high due to which buyers are having hard time to pick up the prices. Previously the bearishness was confirmed by the formation of PINBAR Candlesticks pattern that indicates weakness and rejection of higher prices. Therefore it is a good time to short at current levels for target 1240 Stoploss 1351