GPIL - Cup & Handle Breakout | Daily Chart📊 GPIL – Cup & Handle Breakout with Explosive Volume | RSI > 80
📅 Chart Date: August 24, 2025
📍 CMP: ₹238.61 (+6.91%)
📈 Symbol: NSE:GPIL | 1D Timeframe
🔍 Technical Analysis
☕ Cup & Handle Breakout
A multi-month Cup & Handle pattern has been completed.
Price gave a strong breakout above the neckline zone ₹206.81.
Next supply zone is around ₹236–₹240, which is being tested.
💥 Volume Confirmation
Relative Volume (RVol): 842% 🔥
Today’s volume 19.25M vs avg 3.2M — heavy institutional buying.
📈 RSI
Doji
CDSL Reversal !!!CDSL is on the verge or Reversal or Temporary Pull back
There are multiple learnings in this Chart
1. The Stock taking support at 200day EMA
2. The Candle stick pattern is a Doji Pattern refers to indecisiveness of the demand & supply
3. Previous Gap Resistance acting as Support
4. Hidden Bullish Divergence
5. When price is falling the volume lacks strength
SHARDACROP – Cup & Handle Breakout with Explosive Volume📊 SHARDACROP – Cup & Handle Breakout with Explosive Volume | RSI > 80
📅 Chart Date: July 26, 2025
📍 CMP: ₹1,087.10 (+19.63%)
📈 Symbol: NSE:SHARDACROP | 1D Timeframe
🔍 Technical Analysis Breakdown
☕ Cup and Handle Breakout
A clear Cup and Handle formation has completed.
Breakout above the neckline (~₹940) with a massive bullish candle.
💥 Volume Spike
Volume surged to 8.82M, against the 20-day average of ~887K — institutional buying visible.
This is the highest volume in months, confirming the b
Chola Fin. Formed Short Term BaseNSE:CHOLAFIN made a short-term base of 1168-1185 and is near its BO Levels of 1343.15 with RSI and MACD Trending Upwards.
About:
NSE:CHOLAFIN is one of India's premier diversified non-banking finance companies, engaged in providing vehicle finance, home loans and loans against property.
F&O Activity:
Significant Long Buildup With 1300 CE OI Significantly Decreased.
Trade Setup:
It looks like a good 1:1 Trade with the Recent Base as a Stop Loss for a Swing Trade after it Crosses Key L
Buy on Dips Narayana Hrudayalaya NSE:NH has a beautiful structure on the Daily timeframe it saw Good Volumes around the marked Key Levels which were previously All-Time highs around last year it broke out today and made a new ATH after a year.
Technically above all Moving Averages and RSI and MACD show an Uptrend.
About:
NSE:NH is engaged in providing economical healthcare services. It has a network of multispecialty and super-speciality hospitals spread across multiple locations.
Trade Setup:
Could be a good Positio
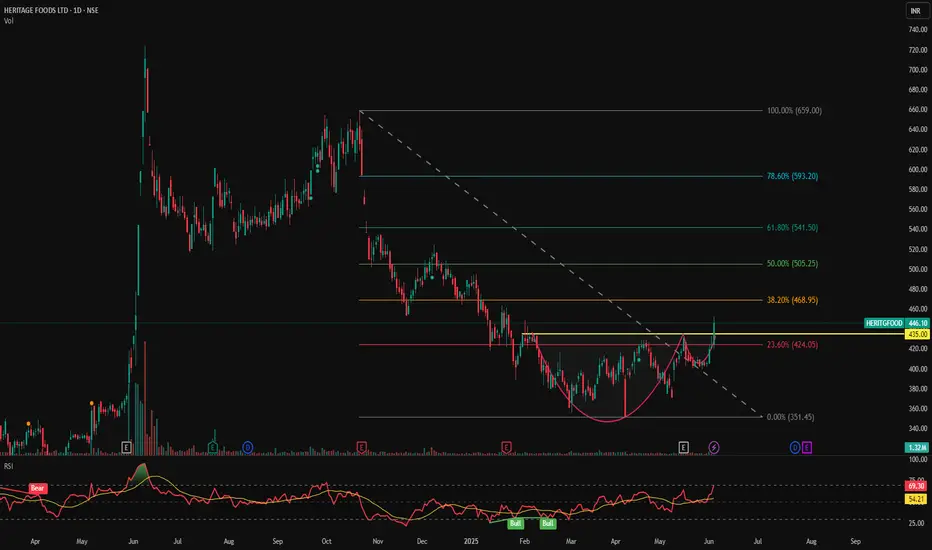
HERITGFOOD - Cup & Handle Breakout with RSI Confirmation | Daily📊 HERITAGE FOODS LTD (HERITGFOOD) – Cup & Handle Breakout with RSI Confirmation | Daily Chart
📅 Chart Date: June 5, 2025
📈 CMP: ₹446.10 (+5.94%)
📍 Ticker: NSE:HERITGFOOD
🔍 Technical Analysis Overview
☕ Cup & Handle Pattern Breakout
HERITGFOOD has successfully broken out of a Cup & Handle pattern, signaling the end of a long downtrend and a potential start of a new bullish wave. The breakout zone lies around ₹435–₹440.
💥 Breakout Volume: Supported by a strong surge in volume (~1.32M), adding co
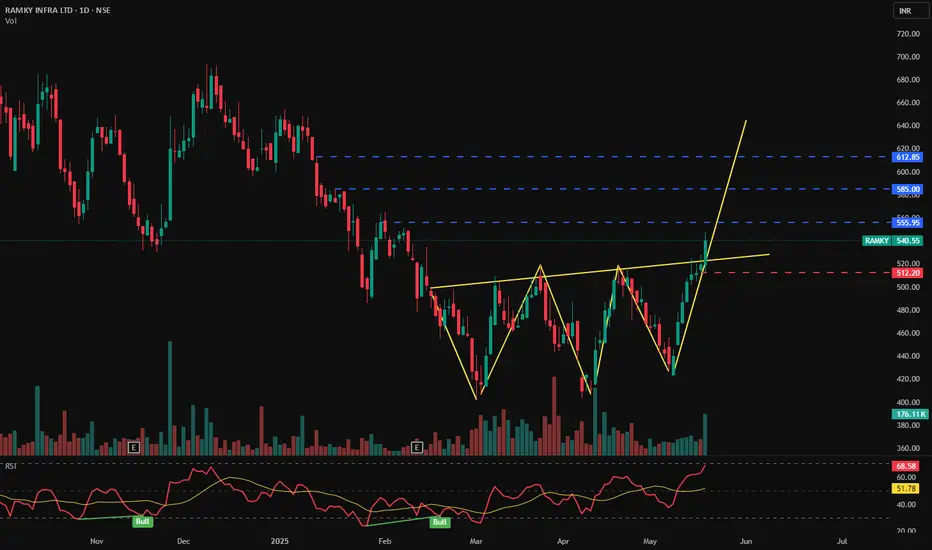
RAMKY INFRA LTD - Bullish Pattern📊 RAMKY INFRA LTD (1D) – CMP ₹540.55
📅 Date: May 21, 2025
📈 Exchange: NSE
📌 Ticker: RAMKY
🧠 Technical Analysis Overview
✅ Bullish Inverse Head & Shoulders Pattern:
Price has broken out of a clearly formed inverse head and shoulders pattern — a powerful trend reversal structure — indicating a strong bullish sentiment and possible long-term uptrend.
✅ Breakout Confirmation:
A sharp breakout above the neckline near ₹512 has occurred with strong bullish momentum and increased volume.
✅ RSI Indica
Nifty momentum turned positive with strong closing.Nifty opened with a gap up, added to the gains further and momentum truned positive. Closing was some 916 points higher from Friday's closing.
24370 is a major support now, cab=n be uses as trend deciding pivot.
24950, 25040, 25080, 25250 immediate resistance levels,
24700, 24590, 24450 and 24370 are major support levels.
Pls refer to chart text for reading on indicators.
Nifty -Some recovery was seen in momentum towards end of sessionNegative momentum continued, Nifty opened with a gap down and continued within the range of first 54 min candle. Closing was some 100 points higher than the day's low.
23947 is a major support now, and as Nifty looks a bit oversold, this may act as a medium term support.
24120, 24165, 24240, 24360, 24410, 24460 immediate resistance levels.
23950, 23900, 23860 remain immediate support levels.
Once it exceeds 24240 and sustains, stability or up-move can be seen.
Refer to the charts text for
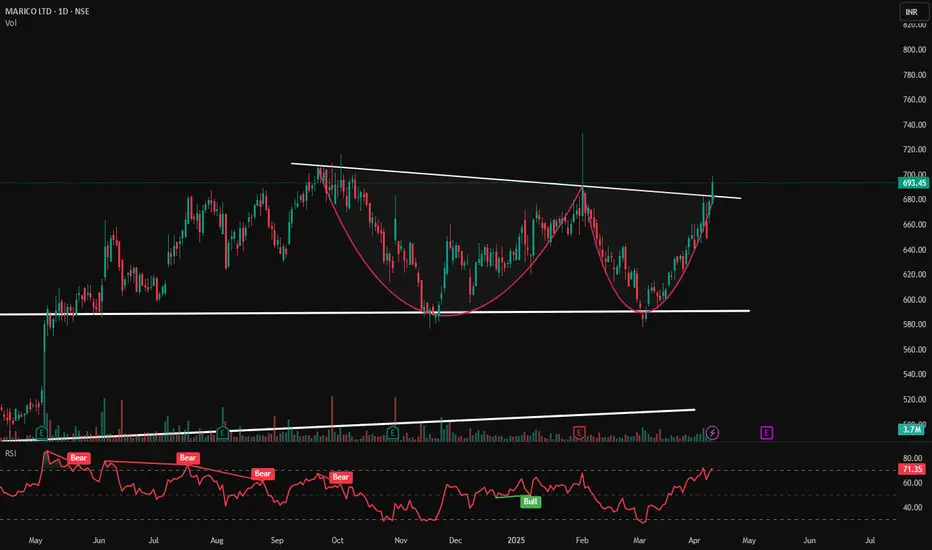
Marico Ltd- Cup & Handle Breakout Forming?Marico Ltd.—Cup & Handle Breakout Forming? ☕️📈
📆 Date: April 10, 2025
📊 Chart Analysis:
Marico is showing a classic "cup & handle" pattern, a bullish continuation setup. The price has successfully broken above the neckline resistance, indicating a potential for upward continuation if volume sustains.
📌 Key Levels:
🛑 Resistance (neckline—now flipped to support): ₹685
✅ Support (Base of Cup): ₹580
🔼 Immediate Resistance Targets: ₹710 ➡️ ₹735 ➡️ ₹765
📈 Indicators & Technicals:
☕ Cup & Handle
Reliance - Price action channel + Candlestick + RSIKey Observations from the Chart
Channel Structure -
Both resistance and support lines have been tested multiple times with precise reactions
The most recent price action shows a strong rejection at the lower channel boundary
Candlestick Formation-
This month printed a textbook strong lower wick rejection candle:
Long lower wick indicates buyers aggressively stepping in at support
RSI Confluence-
The RSI tells a compelling complementary story:
Recently retested COVID-era levels (historic over
QUESS CORP LTD- Weekly Chart Analysis📊 QUESS CORP LTD – Weekly Chart Analysis
🕰️ Timeframe: 1W | 📈 Pattern: Cup & Handle Formation
🔍 Chart Overview:
QUESS is exhibiting a classic multi-year Cup & Handle pattern, forming over 3 years — a powerful technical setup indicating potential bullish continuation.
Currently, price is approaching a crucial descending trendline resistance that has been respected multiple times. A breakout above this level with volume confirmation could signal a major upside.
🔑 Key Technical Highlights:
📉 Tre
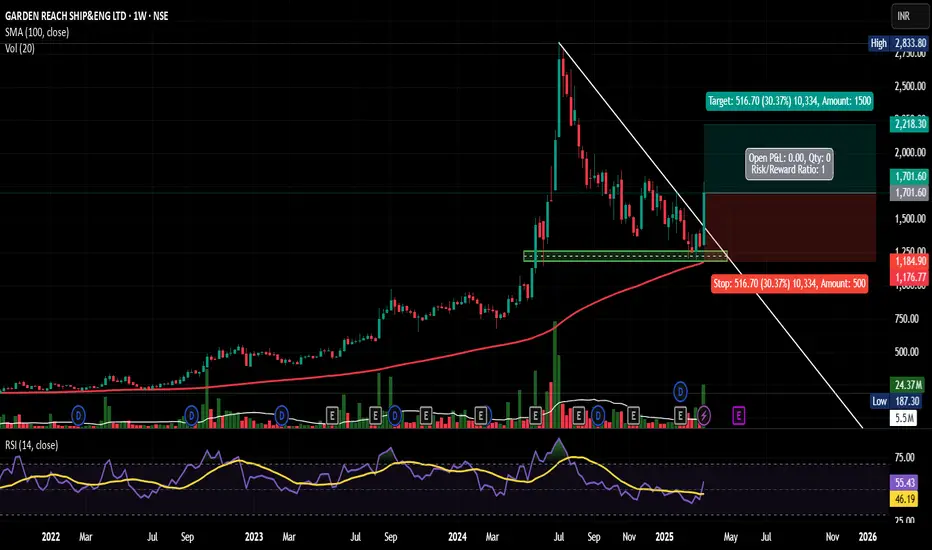
GRSE - Chart of the Week, Breaking Trendline and Made a BaseNSE:GRSE has a beautiful structure on the Weekly Timeframe to Qualify for my Chart of the Week idea, it saw Decent Volumes this week around the marked Key Levels of 100 WSMA and also broke the trendline with RSI Trending Upwards.
About:
NSE:GRSE is a premier shipbuilding company in India under the administrative control of the Ministry of Defence, primarily catering to the shipbuilding requirements of the Indian Navy and the Indian Coast Guard.
NSE:GRSE is a diversified, profit-making
Indian Bank - Crossing Swing High'sNSE:INDIANB is Crossing Swing Highs on Weekly Time Frame and Daily Time Frame with RSI and MACD Trending Upwards, it has seen consistent accumulation around 489-495 Levels.
With the RBI rate cut and 1.16 times Book Value, it's Looking Good for a Swing Trade
About:
NSE:INDIANB is a medium-sized bank that was started in 1907. It offers deposits, loans and services. The Bank's segments include Treasury, Corporate/Wholesale Banking, Retail Banking and Other Banking Operations.
Trade Setup:
Archean Chemical - Chart of the WeekNSE:ACI has a beautiful structure in the Weekly Timeframe that qualifies for my Chart of the Week idea. It saw Decent Volumes this week and closed above its recent swing high, with RSI and MACD Trending Upwards and Closing Above all Major Short moving Averages, breaking the Trendline.
About:
NSE:ACI is India's largest exporter of bromine and industrial salt in Fiscal 2021. The company is the leading specialty marine chemical manufacturer in India and is focused on producing and exporting
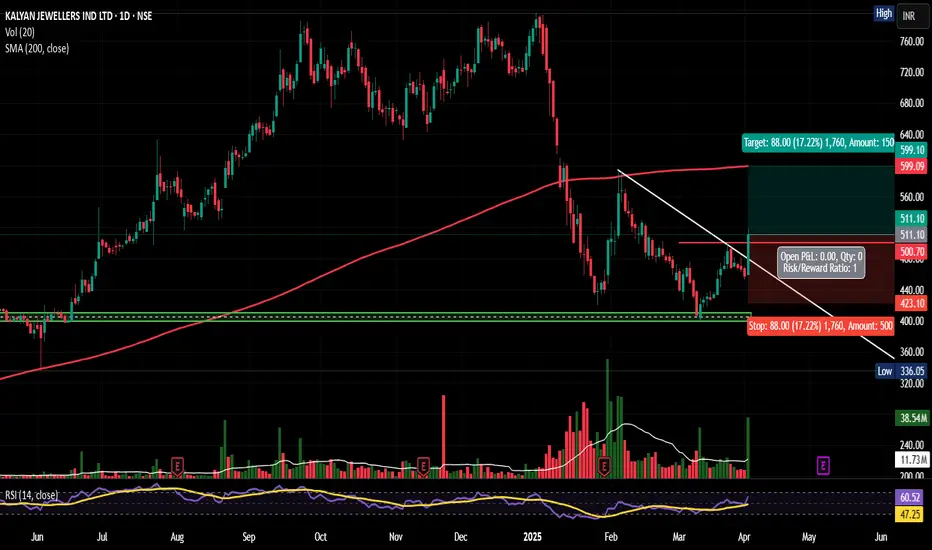
Kalyan - Pullback SwingNSE:KALYANKJIL today gave a Breakout of Falling Trendline and Closed above its Swing Highs With Good Volumes after Making a Base Just Around The Same Levels Previously in One Sided Fall From Top. Today closed above 50 DEMA with RSI trending upwards.
About:
NSE:KALYANKJIL designs, manufactures, and sells a range of gold-studded and other jewellery products at various prices. It is one of the largest jewellery retailers in India.
F&O Activity:
Significant Long Buildup With 460 PE OI Incre
Tata Consumer Prod. - Chart of the WeekNSE:TATACONSUM has a beautiful structure in the Weekly Timeframe that qualifies for my Chart of the Week idea. It saw Decent Volumes this week and closed above its recent swing high, with RSI and MACD Trending Upwards and Closing Above all Major Moving Averages.
About:
NSE:TATACONSUM is one of the leading companies of the Tata Group, with presence in the food and beverages business in India and internationally. It is the second-largest tea company globally and has significant market presen
Sumitomo Chemical - Chart of the MonthNSE:SUMICHEM showed good price action this month, showcasing strength in this market and looking to continue that further, hence qualifying for my Chart of the Month.
About:
NSE:SUMICHEM is one of the leading players in the industry, which has a balanced portfolio of technical and formulation products along with backward integration for some products.
The Company is known for domestic marketing of proprietary products of its Japanese parent, TSE:4005 in agrochemicals, animal nutrition,
HDFC Bank - Swing Trade NSE:HDFCBANK is looking Super Strong on the Daily time frame after forming a perfect base today it broke out and closed significant levels with MACD and RSI Trending Upwards it Can retest its ATH Levels soon.
About:
NSE:HDFCBANK is an Indian banking and financial services company headquartered in Mumbai. It is India's largest private sector bank by assets and the world's tenth-largest bank by market capitalization as of May 2024.
As of April 2024, NSE:HDFCBANK has a market capitalizat
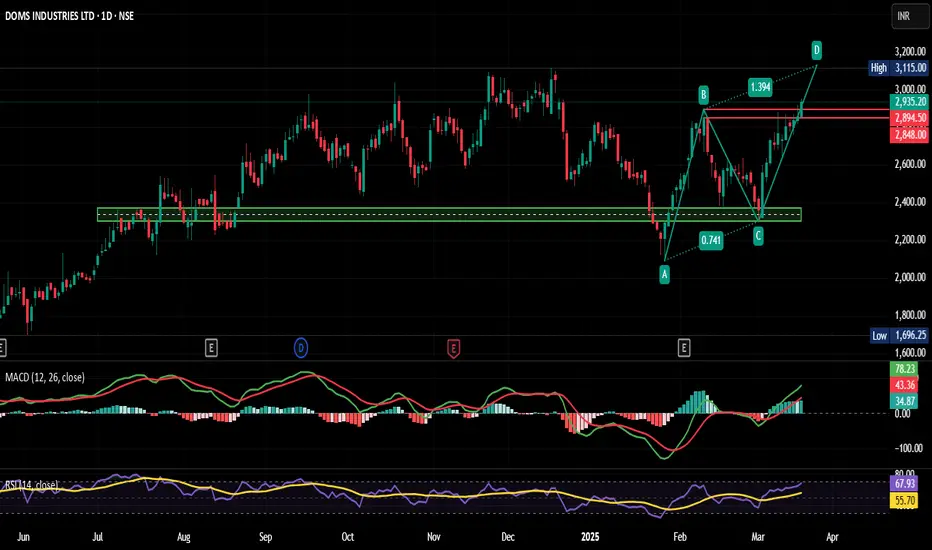
DOMS - ABCD Pattern, Crossing Swing Highs.NSE:DOMS Crossing Swing Highs with Strong Candles With RSI and MACD Trending Upwards and according to ABCD Pattern it's Likely to Cross ATH in Short Term.
About:
Incorporated in 2006, NSE:DOMS is a stationery and art product company primarily engaged in designing, developing, manufacturing, and selling a wide range of these products under the flagship brand, NSE:DOMS is the 2nd largest player in India’s branded 'stationery and art' products market. It held 29% and 30% market share for it
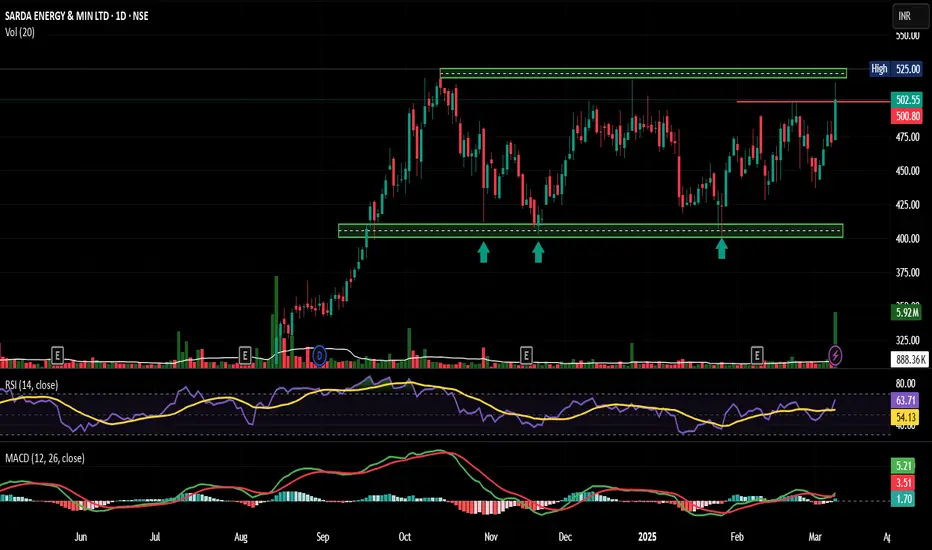
Sarda Energy - Swing TradeNSE:SARDAEN today broke key levels with good levels, it again took support near the base where it is being accumulated and is trading in a Flat Channel which makes this a good swing to the upper edge of the Flat Channel if the Flat Channel is broken it can give a good Swing Up again so keep in watchlist and can buy again at lower level of the channel if retraced.
About:
Incorporated in 1973, NSE:SARDAEN is the flagship company of Sarda Group and is engaged in the production of steel, ferro
LTIM Trendline BD and Retest Fail With King CandleNSE:LTIM today made a Bearish Engulfing or Black Marubozu King Candle, Previously Breaking its trendline and retesting which failed today completely. RSI and MACD are Trending Down.
About:
NSE:LTIM offers a comprehensive range of IT services, including application development, maintenance and outsourcing, enterprise solutions, infrastructure management, testing, digital solutions, and platform-based solutions for clients across various industries.
F&O Activity:
Short Buildup in Futures
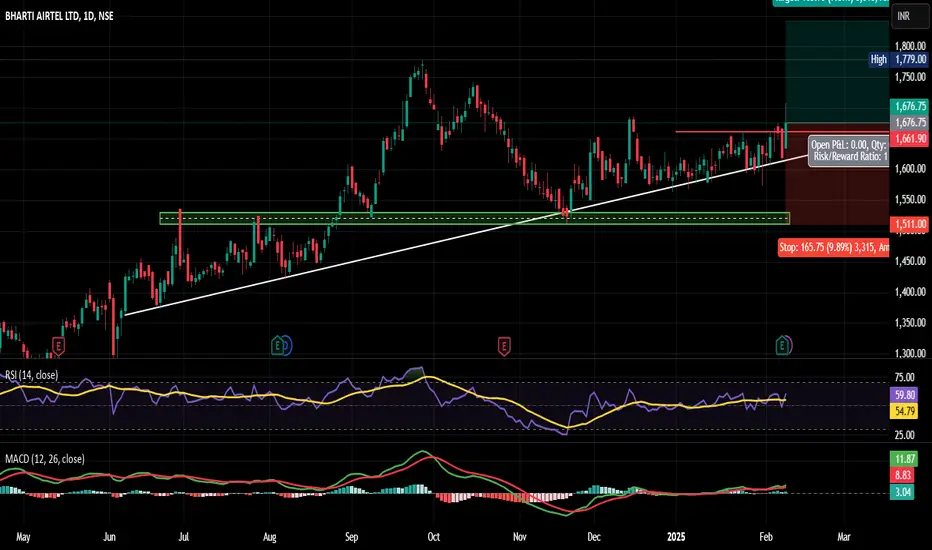
Airtel Strong Q3 and Uptrend NSE:BHARTIARTL is showing a good uptrend with good Q3 Numbers.
Revenue growth was driven by strong underlying momentum in India, sustained constant currency growth in Africa, and the consolidation of Indus Tower Limited, effective 19 November 2024. Net profit increased significantly due to an exceptional net fair value gain on Indus Tower and a forex gain due to currency appreciation. Capex for FY25 is expected to be lower than FY24, and that would expand in FY26. Fibre rollout continues to b