Double Bottom pattern breakout in LAURUSLABSLAURUS LABS
Key highlights: 💡⚡
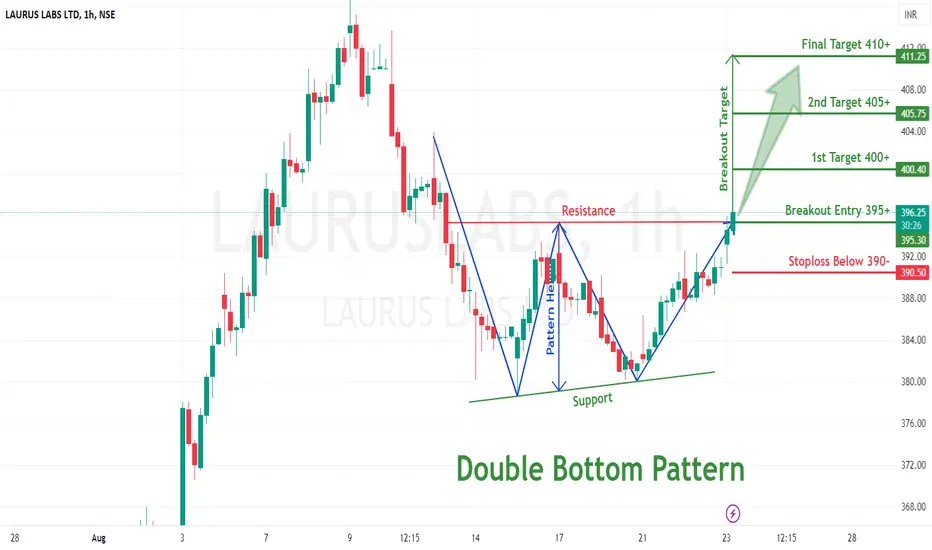
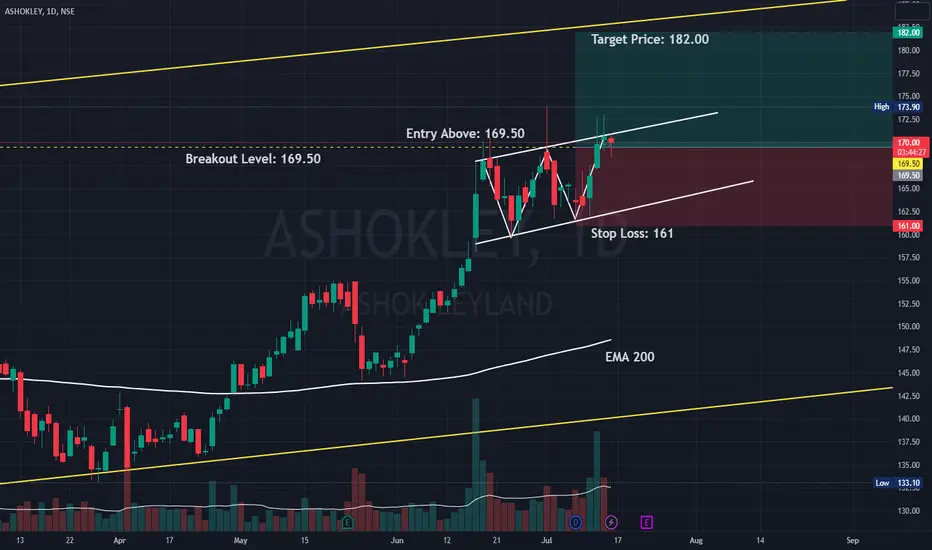
✅On 1Hour Time Frame Stock Showing Breakout of Double Bottom Pattern.
✅ Strong Bullish Candlestick Form on this timeframe.
✅It can give movement up to the Breakout target of 410+.
✅Can Go Long in this stock by placing a stop loss below 390-.
Double Bottom
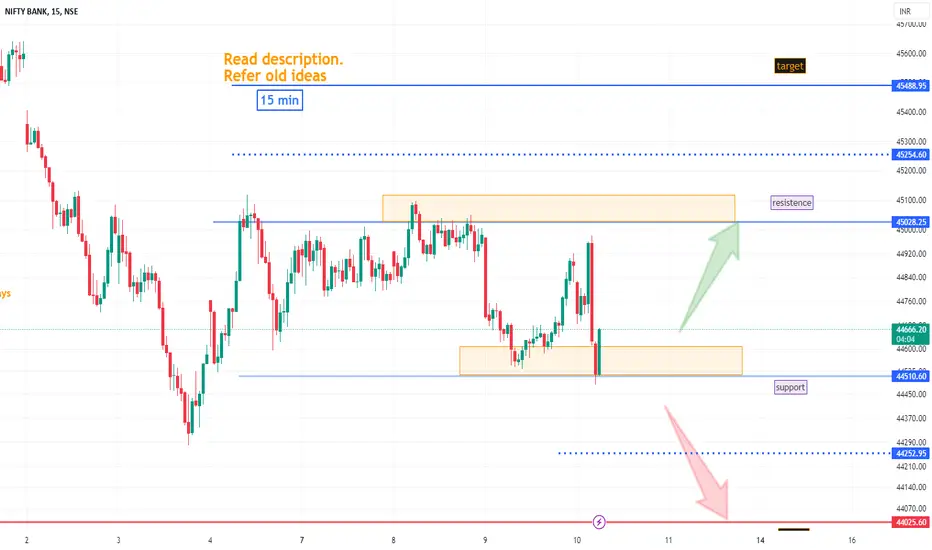
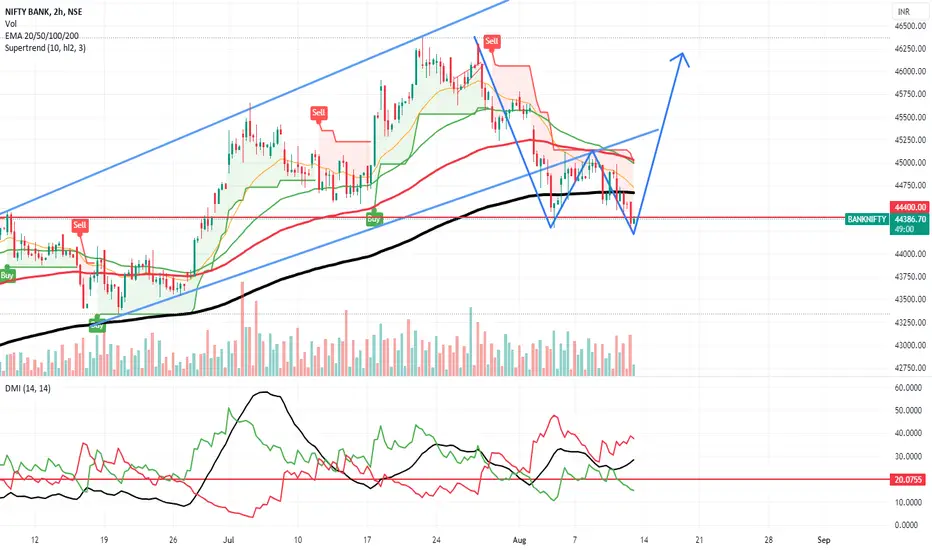
Banknifty (only for min 100-300 points target)Banknifty . (Only for Experienced traders" )
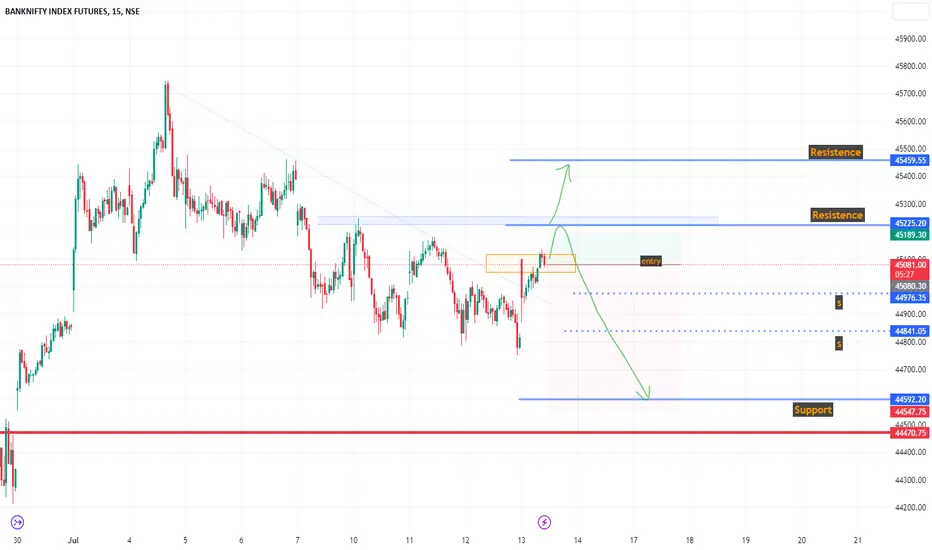
Enter after " Breakout and Retracement ".
.
.
For " long "
entry: 44620 / 45120
target: 45030 - 45250 - 45760
stoploss: 44500 / 44980
.
.
For " Short"
entry: 44410
target: 44250, 44030
stoploss: 44580
.
Enter only if market Breaks
"Yellow box" mentioned.
.
Wait for proper reversal and conformation.
.
Don't make complicated trade set-up.📈📉
Keep it " Simple, Focus on Consistency " 💹.
Refer our old ideas for accuracy rate🧑💻.
Valuable comments a
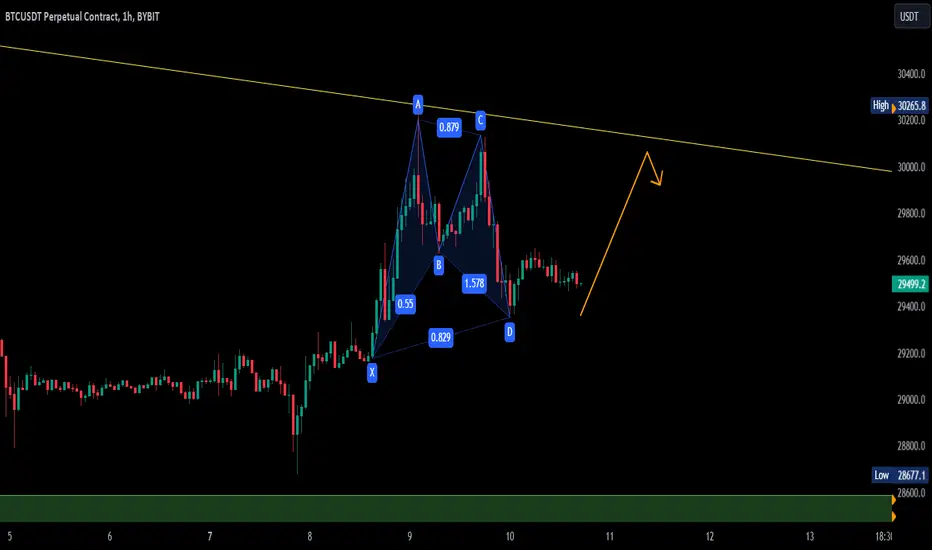
BANKNIFTY still 17th Aug ExpiryHello Friends,
This is my first bank nifty analysis and trying to trade in bank nifty
Let's quick review on it.
As after long fall it looks like making support at level 44300.
Pattern is built up double bottom so if buy ATM CE then it can be good opportunity for today or tomorrow for 2-3 days only.
There is looks like all events are done so it does not seems to be more fall and also near to complete one correction so now it should bounce back to up trend.
so lets see what we can get resul
Banknifty ( Mostly Bullish ); Intraday.Banknifty .
Enter once after " Breakout and Retracement ".
.
.
For " long "
entry: 45410
target: 45575 - 45760
stoploss: 45200
.
.
For " Short"
entry: 45230
target: 45020 - 4487
stoploss: 45350
.
Enter only if market Breaks
"Yellow box" mentioned.
.
Wait for proper reversal and conformation.
.
Don't make complicated trade set-up.📈📉
Keep it " simple, focus on consistency "💹.
Refer our old ideas for accuracy rate🧑💻.
Valuable comments are welcomed-✌️
.
refer old ideas attached below
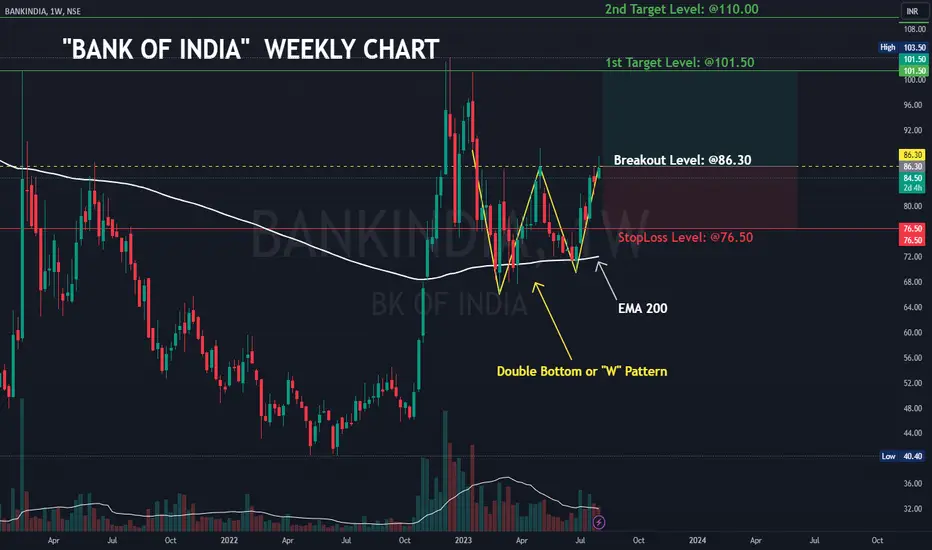
BANK OF INDIA Weekly Chart Potential Breakout LevelBANK OF INDIA Weekly Chart Breakout
If BANK OF INDIA Daily chart close above @86.30 then go for Bullish run on Short Term Perspective.
::Data Point::
Potential Breakout Level: @86.30 (Entry Point)
StopLoss Level: @76.50 ( approx. 10%)
1st Target Level: @101.50 (approx. 18%)
2nd Target Level: @110.00 (approx. 27%)
Dollar Industries Intermediate Term looks bullish!It appears that the price of Dollar Industries Ltd. has reached its lowest point after trying and failing to go below a certain level. Instead, it started going up again, which is a sign that a new upward trend may be starting. the price seems going above the highest point between the two lows, it confirms that the trend is changing to a more positive one and looks like Double Bottom .
The Double Bottom is a reversal pattern of a downward trend in a stock's price.
Note for everyone who c
HIMATSEIDE Analysis(Double Bottom)!HIMATSEIDE Analysis on Weekly Timeframe
Bullish view on HIMATSEIDE
Double Bottom Pattern Formation in HIMATSEIDE
Neckline Breakout
HIMATSEIDE has made double bottom patten on Weekly Timeframe. The price has given breakout to the neckline 85.45 and now it is trading above it. We can see the breakout has happend with the good volume. We can expect further upmove upto 107.80.
Trade Psychology and Setup =
Entry = Between 85 - 90 but it will good if we can enter with lower price
Target = 10
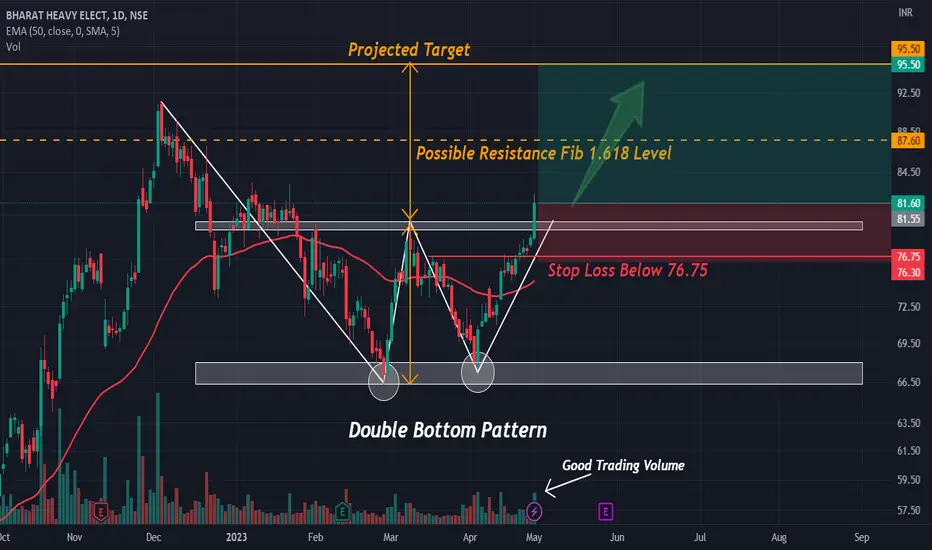
BHEL Analysis(W Pattern)!BHEL Daily Analysis/b]
Double Bottom (W) Pattern formation in BHEL
Will it move as per Double Bottom Pattern Analysis? Will See!!
BHEL has made double bottom pattern on Daily Timeframe and also it has given neckline breakout 79.85 with good volume and successfully able to close above it. BHEL is trading above 50 EMA which is also a confirmation of bullish trend.
Trading Psychology and Setup =
Entry = Entry will be between 80-82
Target = Target 1 will be 87.60 which is also a 1.618 fib le
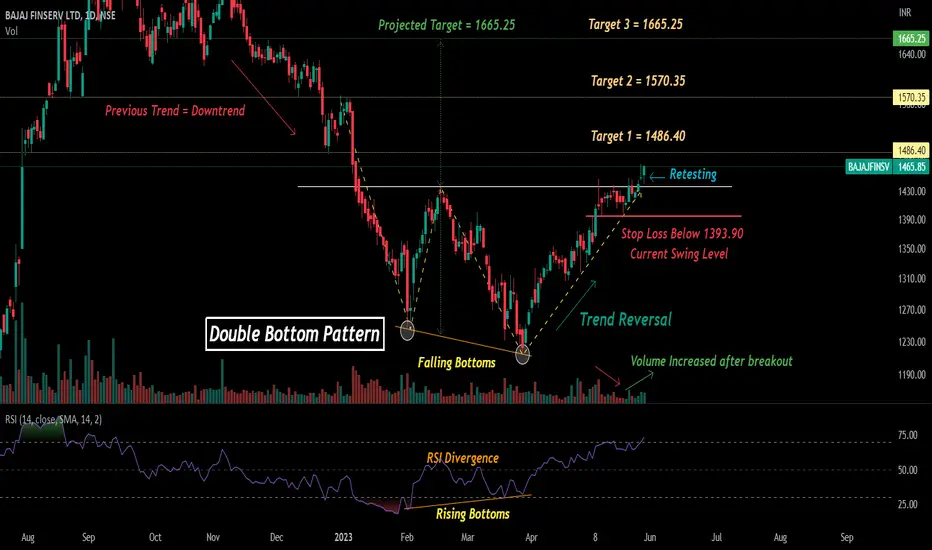
BAJAJFINSV Analysis(Double Bottom)!NSE:BAJAJFINSV ANALYSIS!
BAJAJFINSV Daily Analysis!
Double Bottom Pattern Formation and Breakout in BAJAJFINSV!
RSI Divergence in BAJAJFINSV!
Double Bottom Pattern analysis with RSI Divergence
BAJAJFINSV has made Double Bottom Pattern on a daily timeframe it has given a breakout to the neck level and retested it's support level at the neckline only. If we see the RSI we can see the clear Divergence, while price making falling bottoms RSI making Rising Bottoms. We can expect price to move
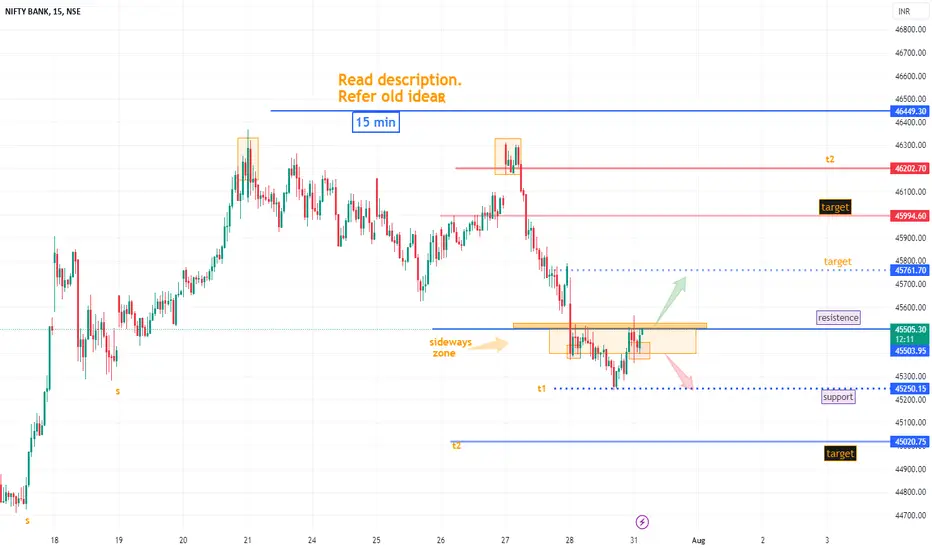
Banknifty ( 31/07/2023 )Banknifty for ( 30/07/2023 )
Enter once after " Breakout and Retracement "
.
.
For " long "
entry: 45530
target: 45760
stoploss: 45450
.
.
For " Short"
entry: 45380
target: 45250 - 45020
stoploss: 45510
.
.
Enter only if market Breaks
"Yellow box" mentioned.
.
Wait for proper reversal and conformation.
.
Don't make complicated trade set-up.📈📉
Keep it " simple, focus on consistency "💹
Refer our old ideas for accuracy rate🧑💻
Valuable comments are welcomed-✌️
.
refer old ideas attached below
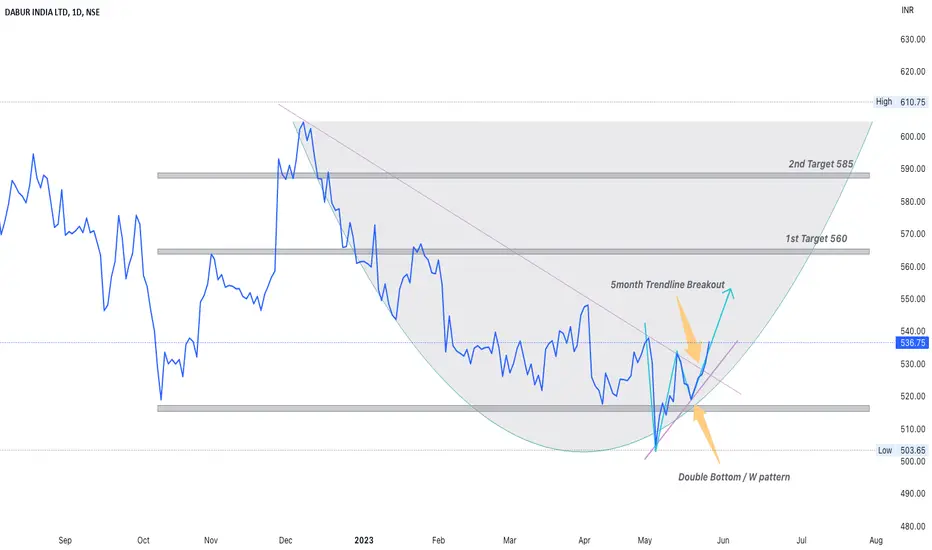
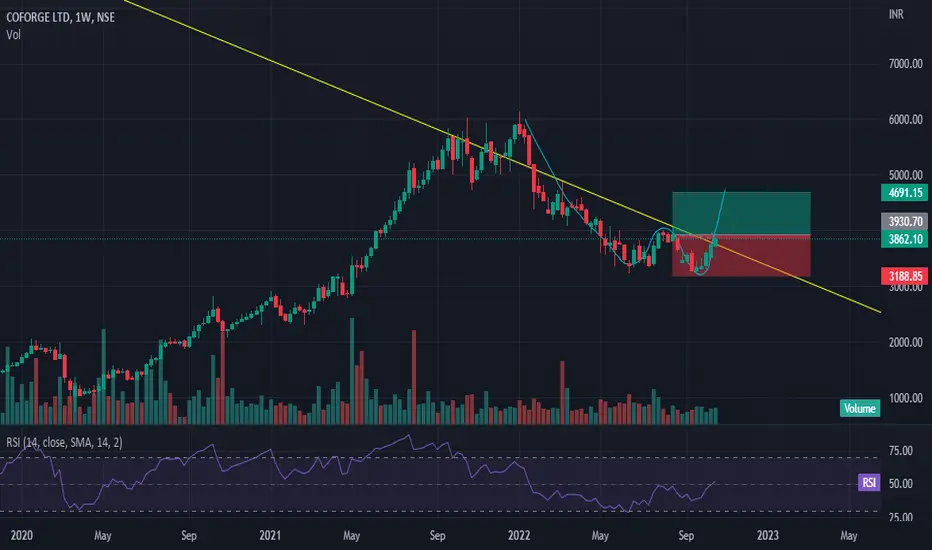
Dabur India, BullishDabur India shows bullish setup with confluence of multiple patterns. The stock is trading below and
approaching #200EMA which is important support / resistance level. The stock has given 5month
trendline breakout, along with W-pattern and is also forming rounding bottom pattern. The key levels
to watch out are indicated in the chart.
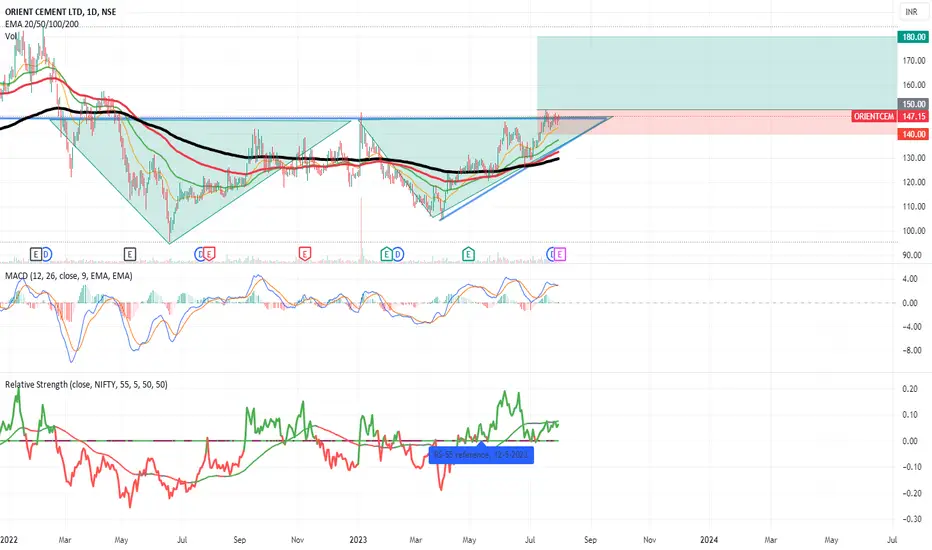
ORIENTCEM Double Bottom | Opportunity Hello Everyone,
Here one good opportunity in this stock
------------
Pattern: Double bottom
Recent it has given break out and also consolidate near break out , So it good time to take entry and try to make good profit.
Entry : 150
SL : 140
and Profit can be : 180
Its my point of view for this stock so, review it on your own and do your best. I am just try to give what i think on it.
Please give me your comments on this stock what is your point of view.
Like | Comment | Share
Thank y
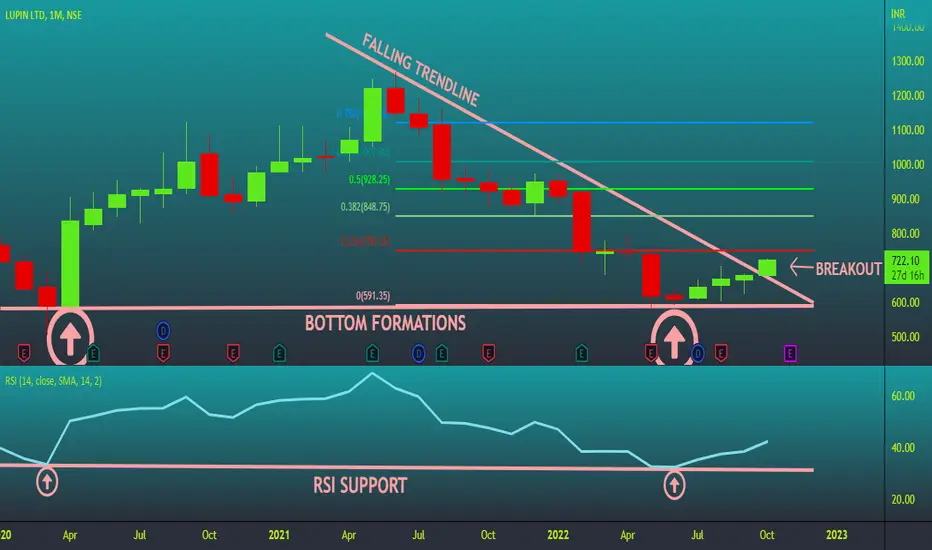
DOUBLE BOTTOMHello mates, As I know that this is month starting and this is not a appropriate time to analyze a chart on monthly time frame but I want to go some in deep to find out a pattern or kind of a reversal signs from strong support zones in it in Lupin so I may be find out some useful things could help someone that is all that it breaks a falling trendline on monthly timeframe so I considered it as a breakout and, The Rsi indicator also giving some reversal action in this stock which is showing that
Banknifty ( Next week contract )Banknifty ( Next week contract )
More probability is there for " 46000 "
.
For " long "
entry:45650 / 45400
target: 45750/ 45990 / 46200
stoploss: 45250
.
.
For " Short"
entry: 45250
target: 45050
stoploss: 45400
.
.
Enter only if market Breaks
"Yellow box" mentioned.
.
wait for proper reversal and conformation.
.
don't be aggressive.
.
refer old ideas attached below.
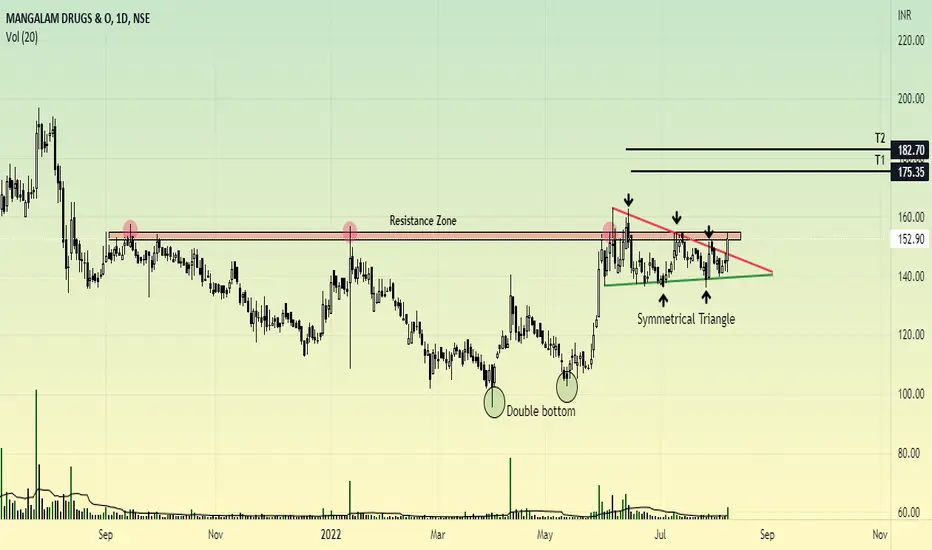
MANGALAM | INCOMING BREAKOUTMangalam Drugs has been attempting to break the 155 level, with its previous attempts getting rejected. But this time, with the solid foundation of a Double Bottom base, & a Symmetrical Triangle formed near the resistance zone, the chances of a successful breakout increases.
Following points to note before initiating a Long trade:
--------------------------------------------------------------------
1. Price keeps getting rejected from a resistance zone around the 155 level.
2. This time, price
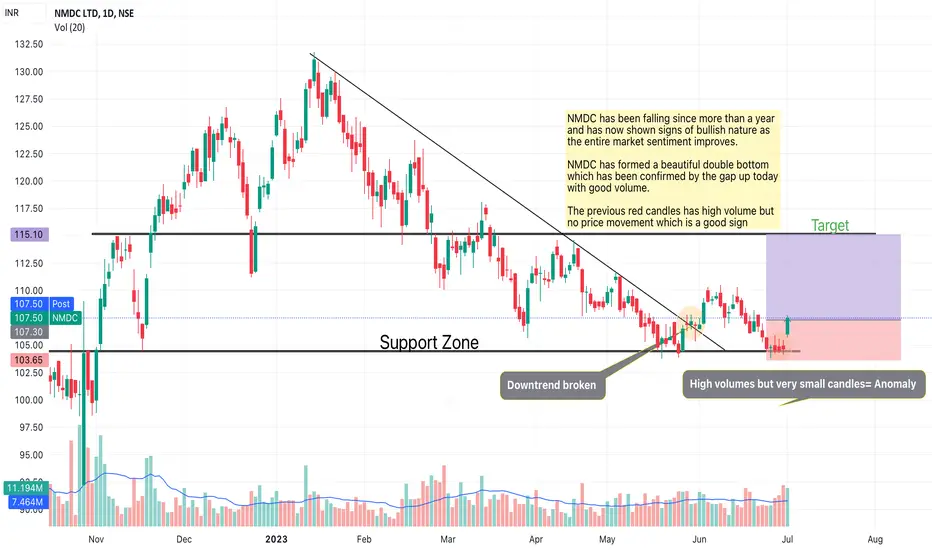
NMDC DOUBLE BOTTOM NMDC has been falling since more than a year and has now shown signs of bullish nature as the entire market sentiment improves.
NMDC has formed a beautiful double bottom which has been confirmed by the gap up today with good volume. The previous red candles has high volume but no price movement which is a good sign and shows lack of selling pressure.
NMDC weekly chart is also forming a inverted head and shoulders pattern
As the market breaks all time highs and seeks new levels, some stock
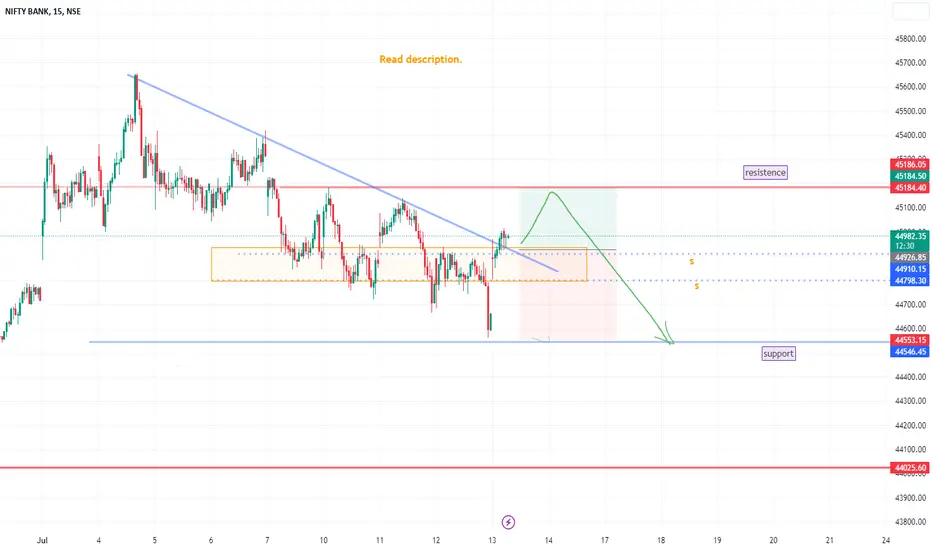
Banknifty ( next week contract )Banknifty ( Next week contract )
More probability is there for " 44500 "
.
For " long "
entry:44950
target: 45180 / 45500
stoploss: 44900
.
For " Short"
entry: 44740
target: 44550
stoploss: 44950
.
Enter only if market Breaks " S & R Zone "
"Yellow box" mentioned.
.
wait for proper reversal and conformation.
.
don't be aggressive.
.
refer old ideas attached below.