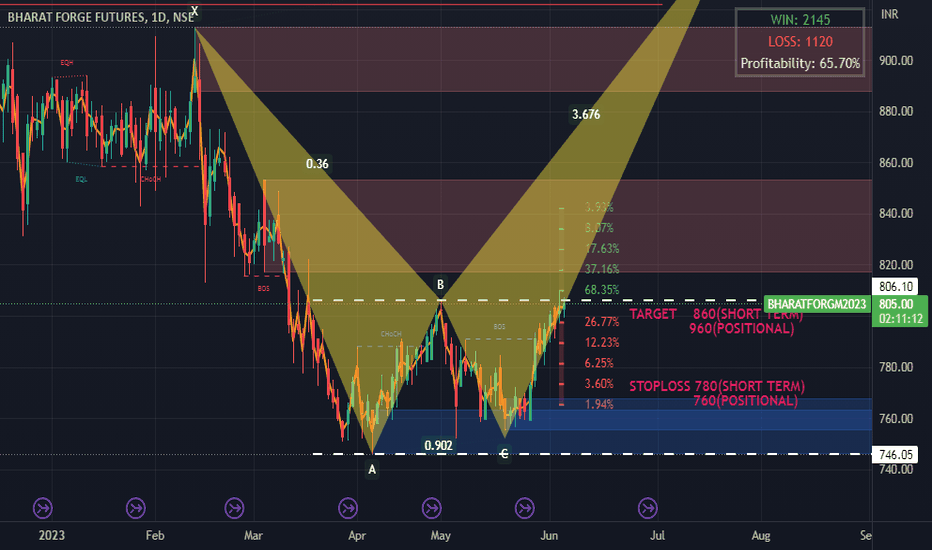
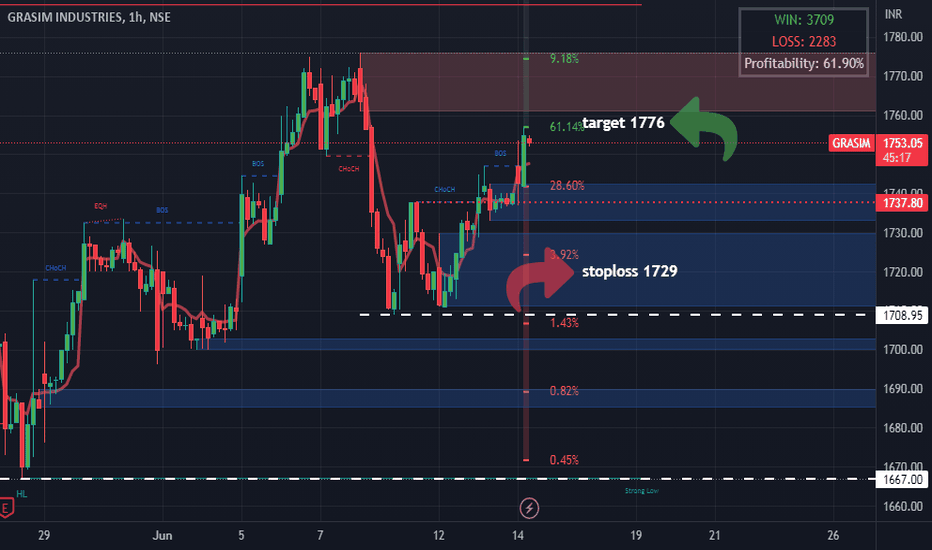
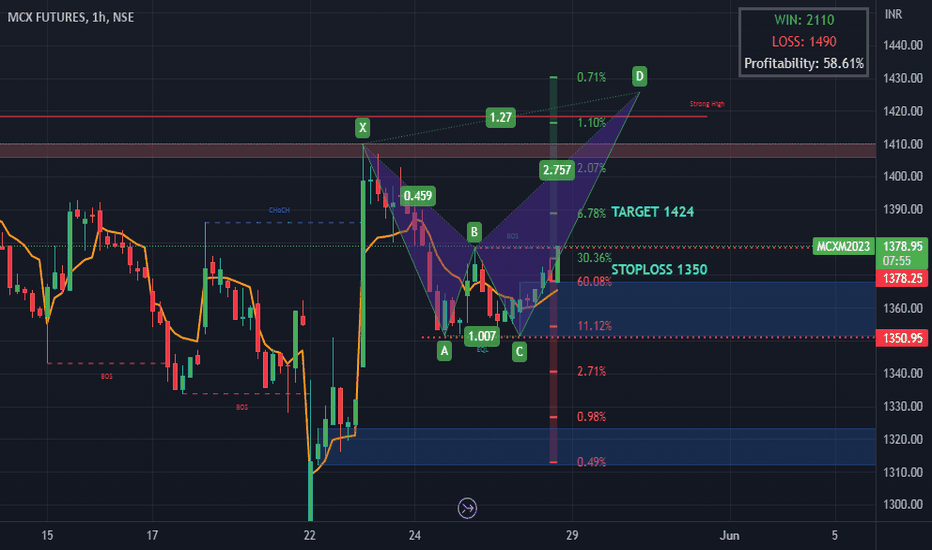
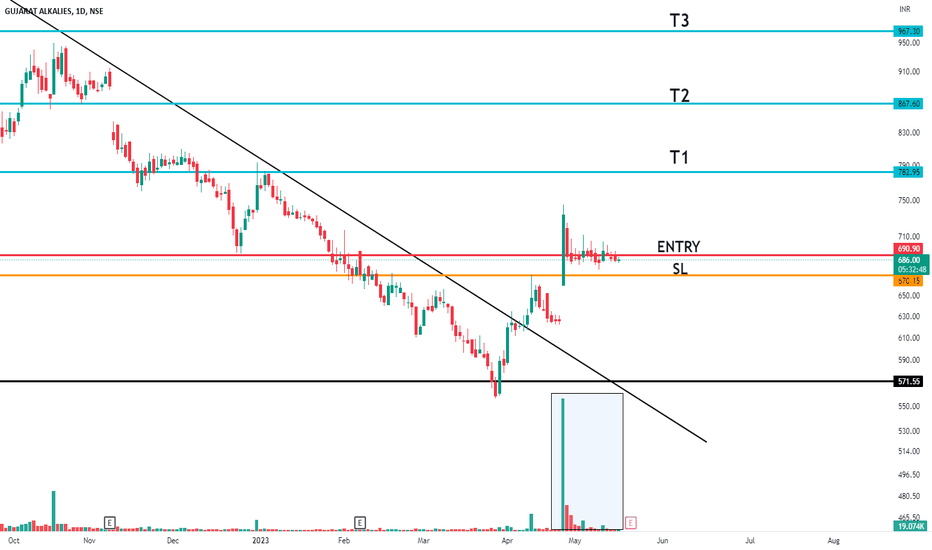
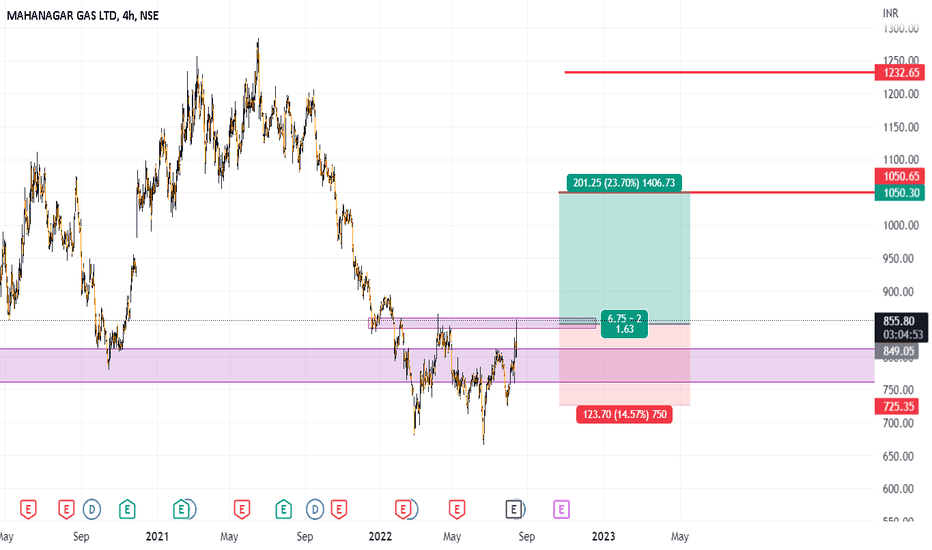
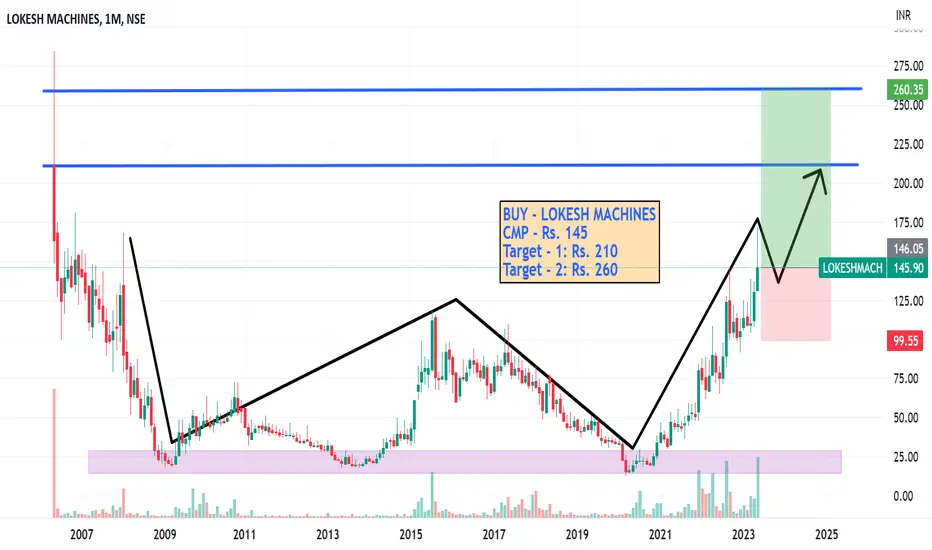
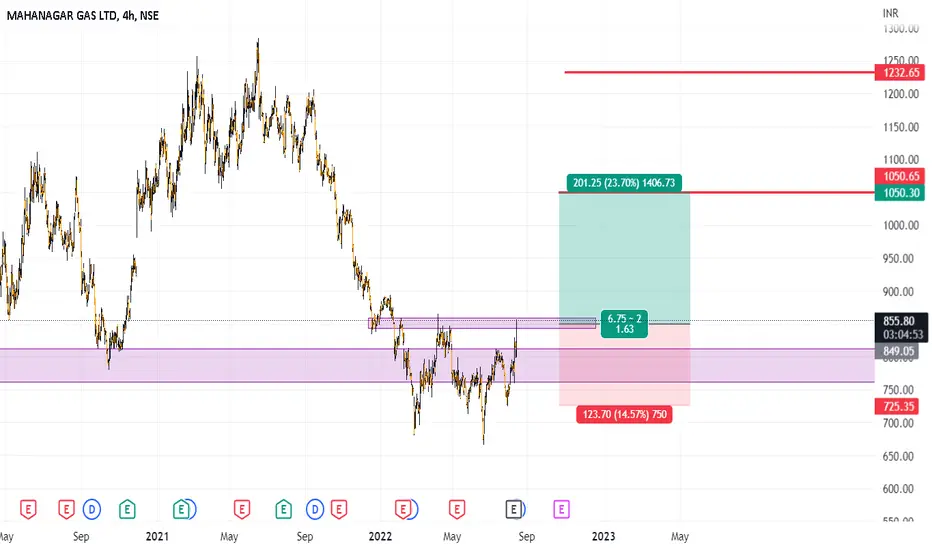
shortterm investment; min 40% return; inverted head and shoulderwait for conformation and retracement and go futher
entry after : 1880
refer our old idea attached below
midcap stocks are going to boom.
long term investment; min 40% return
huge potential is there.
investment ;
if you are intrested in investmet, go for it with small risk,
more possibility is there for breakout.
.
.
.
. more than that " deepak nitrite " is fundamentally good.
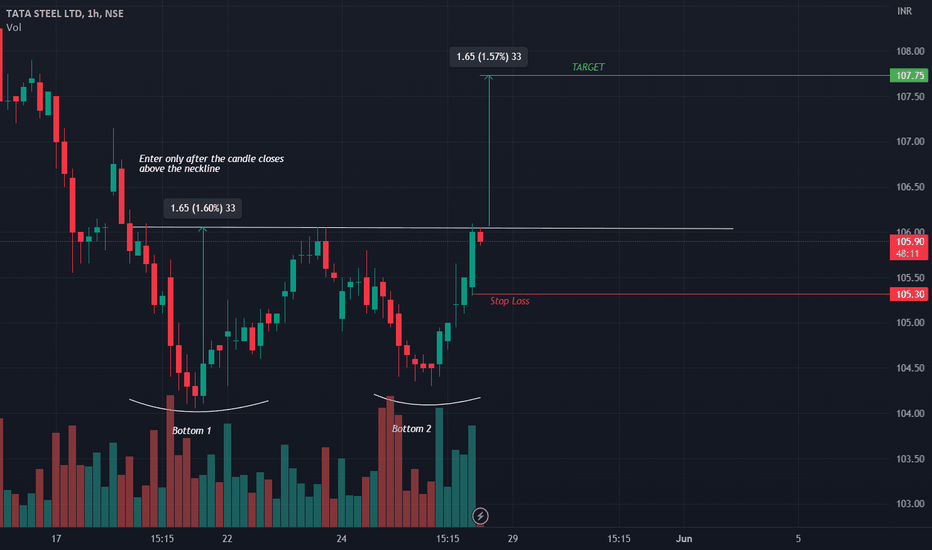
Double Bottom
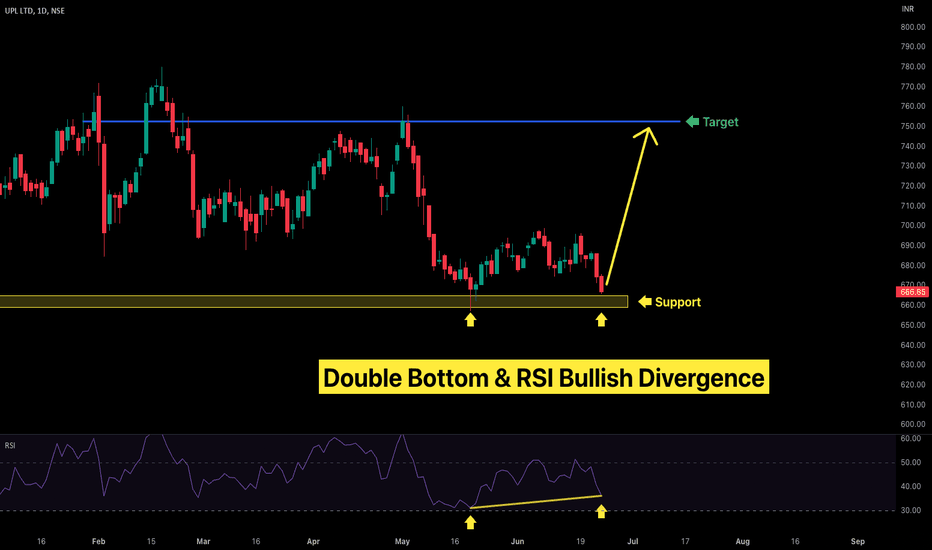
UPL Double Bottom & RSI DivergenceAccording to the daily chart, UPL has formed a double bottom pattern near a significant support zone. Notably, while the price made a double bottom near the same level, the Relative Strength Index (RSI) recorded a higher low, indicating a bullish divergence in the RSI.
Entry:
We can go long after the close of a strong bullish candle near the support zone.
Stoploss:
We can keep the stop loss below the support zone with some buffer.
Target:
We can keep the target near the next resistance zone as marked on the chart.
Please Like & Follow me.
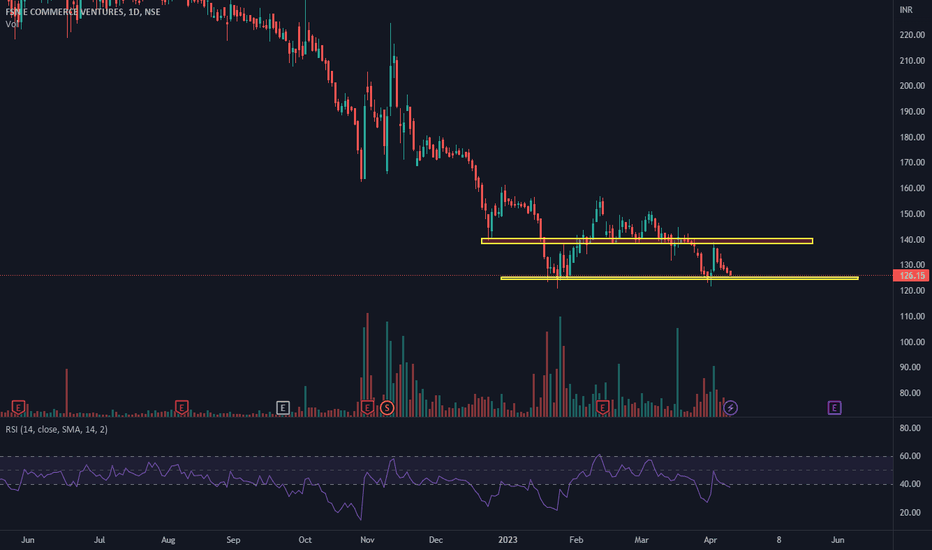
NYKAA might be forming double bottom Nykaa share has been under constant beating from its listing.
Currently, the share is consolidating and it might form a double bottom pattern to bounce from 120-125 levels. RSI is already forming higher lows.
The major resistance is 145-150 levels above which the stock might show signs of reversal.
Idea shared is not a recommendation but just for educational purposes.
Asian Paints W PatternAsian Paints has formed W pattern on daily chart. We can take a swing trade here.
Entry:
We can go long after close of strong bullish candle near neckline of W pattern.
Target:
We can keep Target1, Target2 near the next resistance zones as marked on chart.
Stoploss:
We can keep stoploss below the neckline of W pattern.
Please Like 👍 & Follow Me ✅.
KNRCON Analysis(Double Bottom)! NSE:KNRCON Analysis!
KNRCON Analysis on Daily Timeframe!
Double Bottom Pattern Formation in KNRCON!
Neckline Breakout in KNRCON!
Trend Reversal in KNRCON
KNRCON has made Double Bottom Pattern on a daily timeframe. It has given neckline breakout but experienced high selling pressure around this level. We can observe the retesting is happening now.I have extended previous support trendline we can expect price may take support on this trendline also neckline can acts as a support if we consider current price level. We can see RSI is also trending and took support at support trendline recently it has given breakout to the resistance trendline. So we can expect the price can move upwards.
Entry = Aggressive investors can buy at current levels, Conservative investors can wait for small retest.
Stop Loss = Below 242.65
Targets = 1) 258.95 2) 265.95 3) 271.70 4) 280.40
Disclaimer = All my analysis are for Educational Purpose only. Before entering into any trade - 1) Educate Yourself 2) Do your own research and analysis 3) Define your Risk to Reward ratio 4) Don't trade with full capital
Looks Good for Short termKitex Garments Ltd.
The price seems to have reached a bottom after failing to break through a support level and ultimately rising higher in a sign of reversal to a new uptrend.
The Double Bottom pattern has formed during a downtrend as the price reaches two distinct lows at roughly the same price level. Finally the price breaks upward above the highest high to confirm the bullish signal.
Short term target is marked.
Note for everyone who came across this study:
This chart is only for educational purpose.
This is not buying or selling recommendations.
I am not SEBI registered.
Please consult your financial advisor before taking any trade.
SUNTV | Beautiful setup - Potentially can capture 30-35%SUNTV | Beautiful setup - Looks easy opportunity to capture 30-35%
-> Hammer at channel support
-> W pattern
-> Higher low formation in daily time frame
-> Small breakout in Daily time frame
CMP : 448 (Dip : 420)
SL : 385
Target : 580
1:3+ risk reward setup
#TITAN Weekly double bottomTitan after my previous sell signal (related idea section), and achieving the downside target is now making Weekly double bottom with a better elevated (green) trendline support from the previous one (brown), signifying bulls are much more active.
Double bottom has also come at a good Fibo support zone of 50 to 61.8% retracement levels from June low bottom to recent high made in Oct.
On daily tf, price is consolidating near resistance / neckline of double bottom placed around 2545 and if it breaks out post good consolidation that would mean a significant rally on upside can come in this stock.
It has previously given a falling trendline resistance breakout in July'22 and stock rallied for almost 30-35% from there on and similar falling trendline resistance breakout is visible now.
Overall, the setup looks very strong and having a bullish bias in it.
Keep it in radar
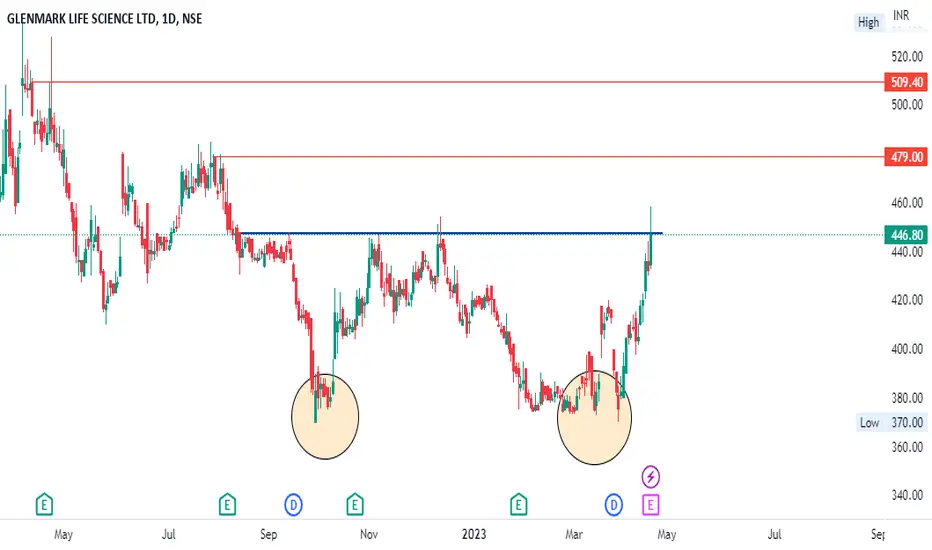
GLSGLS:- Looking at the chart of the stock, there is a way of showing a double bottom pattern, plan something only after the breakout, till then keep your eye on the stock.
Hello traders,
As always, simple and neat charts so everyone can understand and not make it too complicated.
rest details mentioned in the chart.
will be posting more such ideas like this. Until that, like share and follow :)
check my other ideas to get to know about all the successful trades based on price action.
Thanks,
Ajay.
keep learning and keep earning.
GLong
Welent looks goodDouble Bottom pattern is formed in Welent. A bullish reversal pattern that is formed when the price reaches two distinct lows, or bottoms, at approximately the same price level. This is usually a sign that the selling pressure has been exhausted, and buyers are starting to take control.
The volume tends to decrease as the pattern forms, which is an indication that there is less selling pressure in the market. However, there may be a slight increase in volume at each low as some traders may try to buy at what they perceive to be a bargain price.
The confirmation of the Double Bottom pattern occurs when the price breaks above the highest high between the two bottoms. This is often accompanied by an increase in volume, indicating that there is a renewed buying interest in the market.
Overall, the Double Bottom pattern is a popular chart pattern among traders and can be a useful tool for identifying potential buying opportunities. However, like all technical analysis tools, it should be used in conjunction with other indicators and not relied upon solely for making trading decisions.
Note for everyone who came across this study:
This chart is only for educational purpose.
This is not buying or selling recommendations.
I am not SEBI registered.
Please consult your financial advisor before taking any trade.
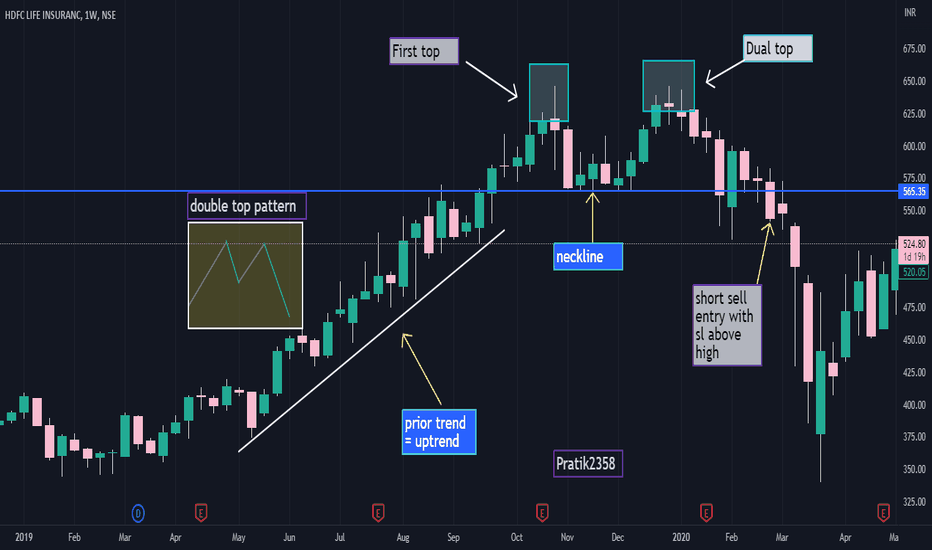
dual top pattern explained in simple form The dual top pattern is a popular technical analysis pattern that can signal a potential trend reversal. This pattern is formed when the price of an asset reaches a resistance level twice and fails to break above it. The two peaks of the pattern look like two mountain tops that are approximately equal in height, with a dip or valley in between them. The neckline of the pattern is drawn by connecting the lows between the two peaks. A breakdown below the neckline is considered a sell signal, as it suggests that the price is likely to continue to decline.
The dual top pattern is an important tool for traders because it can help to identify potential trend reversals. However, it's important to confirm the pattern with other indicators and analysis before making trading decisions. For example, traders might look for other technical signals such as a bearish divergence or a break below a key support level to confirm the dual top pattern. Additionally, traders may use fundamental analysis to gain insight into the underlying factors that are driving the price movement of the asset.
Overall, the dual top pattern is a powerful tool for traders to identify potential trend reversals, but it's important to approach it with caution and to use other analysis techniques to confirm the signal before making trading decisions.
In the below example, a newbie too would be able to learn and practice trend reversal using double top pattern
Dual top pattern = potential trend reversal.
Look for two mountain tops with a valley in between.
The resistance level was reached twice but was not broken
Draw the neckline by connecting lows between the peaks.
A breakdown below the neckline = sell signal.
Remember, the dual top pattern can be a powerful tool for traders to identify potential trend reversals, but it's important to confirm with other indicators and analysis before making trading decisions.