aud-chf crate double top pattern. after pattern market sentence major zone. wait for breakout upside breakout- buy downside breakout - sellby fxserver2
intraday / RSI Bullish Divergenceboth side potential avoid first 15min breakout wait for 15 min candle closing targets are marked follow risk management do your own analysis do workout do meditation start reading bookby hunterhunt7771
intraday midcap stocks are going to boom there is possibility for big move instead of intraday its better to go for 3 to 4 days of holding with proper risk management Longby TheNuraTradingUpdated 3
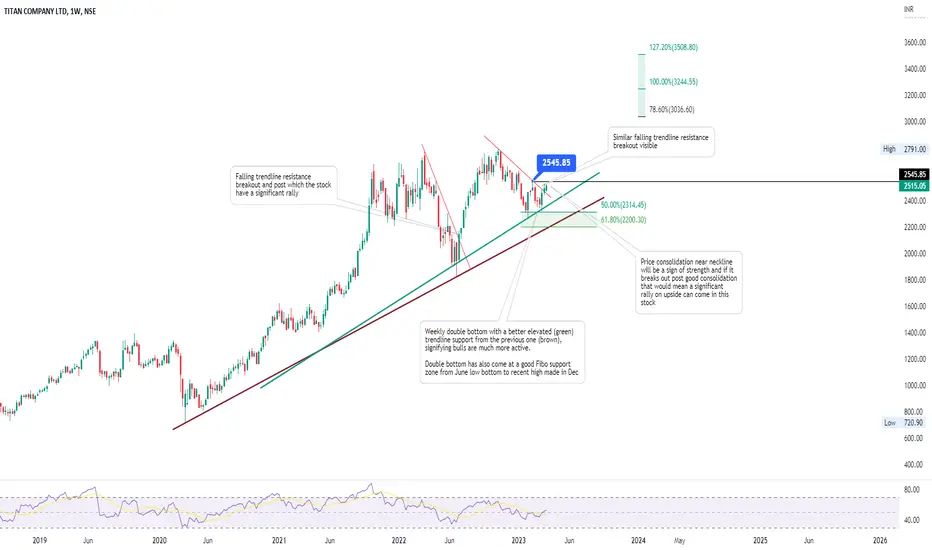
#TITAN Weekly double bottomTitan after my previous sell signal (related idea section), and achieving the downside target is now making Weekly double bottom with a better elevated (green) trendline support from the previous one (brown), signifying bulls are much more active. Double bottom has also come at a good Fibo support zone of 50 to 61.8% retracement levels from June low bottom to recent high made in Oct. On daily tf, price is consolidating near resistance / neckline of double bottom placed around 2545 and if it Longby aktradelearningUpdated 39
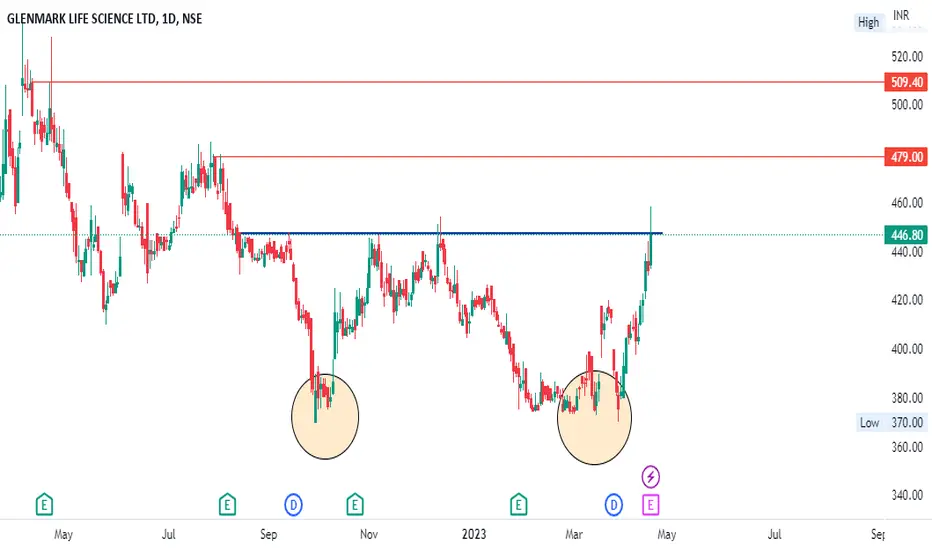
GLSGLS:- Looking at the chart of the stock, there is a way of showing a double bottom pattern, plan something only after the breakout, till then keep your eye on the stock. Hello traders, As always, simple and neat charts so everyone can understand and not make it too complicated. rest details mentioned in the chart. will be posting more such ideas like this. Until that, like share and follow :) check my other ideas to get to know about all the successful trades based on price action. Thanks, AGLongby AjayDhakad_Keep_it_simpleUpdated 0
GREENPLY INDUSTRIES - 120% RETURNS!!!BUY - GREENPLY INDUSTRIES CMP - Rs. 144 Target - 1: Rs. 210 Target - 2: Rs. 270 Target - 3: Rs. 320 . . Technicals - Double Bottom Pattern . This is just a view by an expert analyst, please trade at your own risk. . Follow me for more!Longby nilakshgupta3
Welent looks goodDouble Bottom pattern is formed in Welent. A bullish reversal pattern that is formed when the price reaches two distinct lows, or bottoms, at approximately the same price level. This is usually a sign that the selling pressure has been exhausted, and buyers are starting to take control. The volume tends to decrease as the pattern forms, which is an indication that there is less selling pressure in the market. However, there may be a slight increase in volume at each low as some traders may try by hardeepssethiUpdated 0
dual top pattern explained in simple form The dual top pattern is a popular technical analysis pattern that can signal a potential trend reversal. This pattern is formed when the price of an asset reaches a resistance level twice and fails to break above it. The two peaks of the pattern look like two mountain tops that are approximately equal in height, with a dip or valley in between them. The neckline of the pattern is drawn by connecting the lows between the two peaks. A breakdown below the neckline is considered a sell signal, as itEducationby pratik235815
EXIDE INDS - 42% RETURNS!!!BUY - EXIDE INDUSTRIES CMP - Rs. 183 Target - 1: Rs. 212 Target - 2: Rs. 260 . . Technical - 1) Double Bottom Pattern (before breakout). 2) Bullish Flag Breakout 3) Targets have been set using previous swing highs and Gann Fan. . . Fundamentals - 1) The automobile batteries manufacturer has bought 24.80 lakh equity shares in Ulric Renewables, at a price of Rs 80 per share, amounting to Rs 19.84 crore. With this investment, its shareholding in Ulric Renewables stands at 39.08%. 2) Strong anLongby nilakshgupta5
IRB INFRASTRUCTURE - BULLISH MOMENTUM!!BUY - IRB INFRASTRUCTURE CMP - Rs. 26 Target - 1: Rs. 34 Target - 2: Rs. 40 Target - 3: Rs. 58 . . Technical - 1) Flat Base Pattern. 2) High Volumes in previous trading sessions indicating potential breakout. 3) Double Bottom chart pattern. 4) Positive breakout at first resistance, LTP>R1. . . Fundamentals - a) The Highway construction company has recorded toll collection at Rs. 369.9 crore for the month of March 2023, growing 20.6% Longby nilakshgupta6
DONEAR - Retest + Reversal with a breakout - Swing Trade The analysis is done on Daily + Weekly TF hence price may take few weeks to few months in order to reach the targets. Checkout the weekly chart as well here - Trade setup is explained in image itself. The above analysis is purely for educational purpose. Traders must do their own study & follow risk management before entering into any trade Checkout my other ideas to understand how one can earn from stock markets with simple trade setups. Feel Free to comment below this or connect withLongby TradewithAditya1
BALRAMCHINBALRAMCHIN:- Double bottom pattern is formed, wait for breakout of neckline, till then keep an eye on the stock Hello traders, As always, simple and neat charts so everyone can understand and not make it too complicated. rest details mentioned in the chart. will be posting more such ideas like this. Until that, like share and follow :) check my other ideas to get to know about all the successful trades based on price action. Thanks, Ajay. keep learning and keep earning. Longby AjayDhakad_Keep_it_simpleUpdated 1
#Nifty #fallingwedge on hourly chartsNifty on hourly timeframe is showing a falling wedge formation with double bottom placed at the bottom of the falling wedge channel and also a very important support placed around 16800-16850 support zone band. 20 DEMA is placed around 17400 currently and as that acts a magnet, it can't be ruled out that price is going to a move around that. This zone is also currently coinciding with the around 50 to 61.8% pullback zone of fall from 17800 to 16830 levels. Price is also showing a consolidatioLongby aktradelearningUpdated 21399
RBA(Burger king)Formaly known burger king monthly chart showing bullish side. Even RSI showing oversold. Formed W 'or' Double bottom pattern Target 1: 115 Target 2: 130 Strict SL: 80 Note: Only for education purposeLongby talkativeparma13
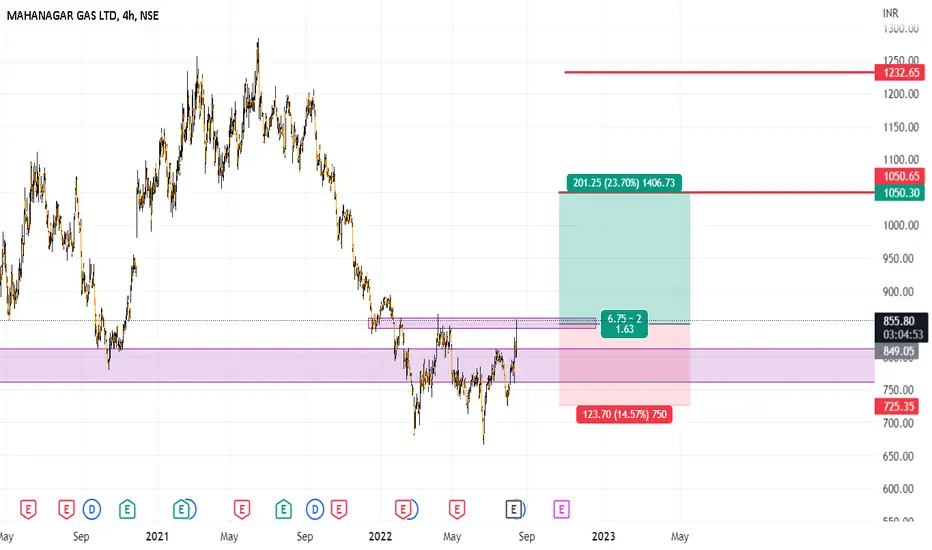
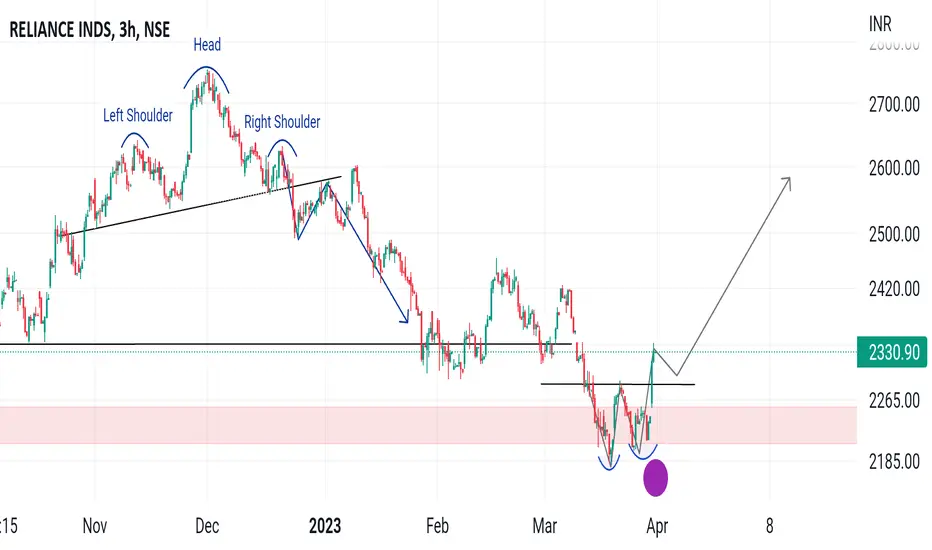
Buy on dip Double bottom pattern breakout in RELIANCE Buy on dip Keep SL below swing lowLongby vinodhvinayan11
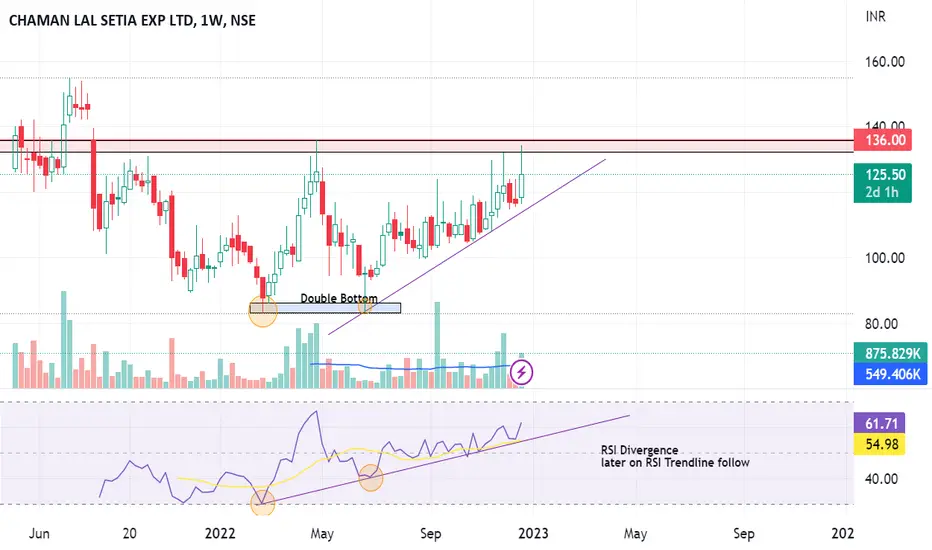
A potential multi-bagger stock (3)After PSU BANKS and sugar stocks rally Its potentially turn for rice stocks and Railway stocks now One can consider NSE:CLSEL CMP-122 Buy above-137 on closing basis TARGET- 155 then ATH+ Stop loss- Breakdown of trendline with below 107 RSI Divergence observed with RSI Trendline formation too NOTE: Stock represents chart pattern similar as shown by GRM Overseas So one can keep accumulation the stock on dips if possible " JUST AN IDEA SO KEEP YOUR RISKS AND REWARDS IN MINDS BEFORE INLongby Paras_gujjarUpdated 14
Trade Idea on SRF with Bird Eye View and Notes Following is the bird-eye view of SRF point-wise: 1 and 2) I see two patterns here on a Weekly time frame; 1 is a parallel channel, and 2 is a symmetrical triangle ( Note: Both can be bullish or bearish patterns depending on their previous more significant wave, here it was bullish ) ( Note 2: Currently sitting at the support of bottom parallel channel making a W pattern and sitting at bottom support of symmetrical pattern too ) 3) It's a Fibonacci extension, made for the consolidation zoneLongby Apoorv-Dubey_SEBI-RA14
SBI Life Double Bottom RSI Divergence SBI Life has formed double bottom pattern on daily chart. while the RSI is making higher lows which is sign of RSI Bullish Divergence. Entry: We can go long after close of strong bullish candle near support zone. Stoploss: We can keep stoploss below the support zone. Target: We can keep target near the next resistance zone which will be also the neckline of W pattern in future, as marked on chart. Please Like and Follow me.Longby vt_trader211
Chennai Petroleum Corporation LimitedTechnical- Double Bottom Base Structure stock given breakout with volume pop up Buy at pullback near 10 WMA trading above 10 WMA looking good for mrntined target in chart buy near pullback Industry Sector looking Strong Concern- Nifty is weakLongby nikhilkashid19940
intradaywe can buy on support zone or we can sell in breakout depend on the candle both side potential avoid first 15min breakout wait for 15 min candle closing targets are marked if the breakout comes after 10:00 am then the probability of winning will be more. follow risk management do your own analysis do workout do meditation start reading booksPby hunterhunt7772
Bajaj Finance Swing TradeDouble Bottom Pattern is formed on daily chart while the RSI is making higher lows which is sign of RSI Bullish Divergence . We can take a swing trade here. Entry: We can go long after close of strong bullish candle near the support zone . Target: We can keep the target near the resistance zone which will be also the neckline of W pattern as marked on chart. Stoploss: We can keep stoploss below the double bottom support zone . Please like & follow me.Longby vt_trader528
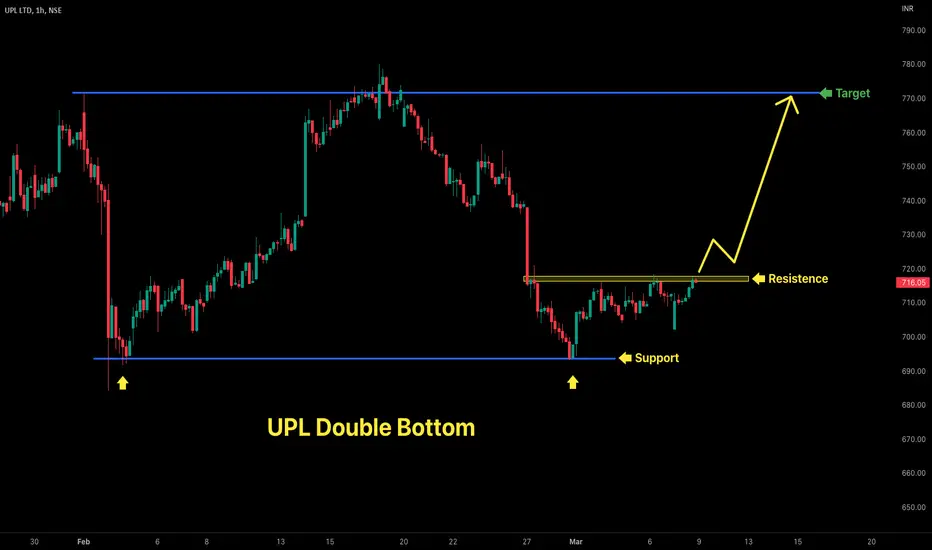
UPL Swing TradeUPL has formed Double Bottom Pattern. Which is a bullish pattern and it may form W pattern. So we can take swing trade here. Entry: We can go long when price gives breakout above the resistance zone with strong bullish candle. Target: We can keep target near the next resistance which will be also the neckline of W pattern as marked on chart. Stoploss: We can keep stoploss below the resistance zone. Please Like and Follow me. Longby vt_trader213
HDFC Life Double Bottom RSI DivergencePrice has formed a double pattern on daily chart. while the RSI is making higher lows which is clear sign of RSI Bullish Divergence. We can take long trade. Entry We can go long on open of next candle. Target Target 1 will be the nearest resistance zone which will be also the neckline of W pattern as marked on chart. Target 2 will be next next resistance zone after the neckline of W pattern is broken as marked on chart. Stoploss We can keep stoploss below the double bottom support zone. PleaLongby vt_trader520
DOUBLE BOTTOM BREAKOUT STOCKStock is created W pattern and expected good buying from this levelLongby RANATRADINGIDEAS0


 Long
 Long
 Long

 Education
 Long
 Long
 Long
 Long

 Long
 Long
 Long
 Long
 Long
 Long
 Long
 Long
 LongLong
 Long