Long term W pattern with 3 more Ideas for 27 October markets I daily make educational content videos on financial markets Long07:36by Apoorv-Dubey_SEBI-RA222
Reliance Double Bottom BreakoutHello Every one ... So Now Today We Share Analysis Of Reliance With Proper Price Action based.. As Per Chart pattern Reliance has Given breakout Of Double Bottom. If Sustain Above 2440 level Than We can see Good upside Movement In coming days .. TRADE WITH YOUR RISK MANAGEMENT Longby ronak_saldiyaUpdated 312
W Pattern formation W Pattern formation in banking stock Daily Time frame Follow me for daily Chart pattern Longby Santosh_Sonwane13
Double bottom in formation: Apcotex IndNSE:APCOTEXIND is forming the double bottom formation. Here trade should be taken after the breakout. Will breakout occur? Note - Breakout is very important for the pattern to be success.Longby VanshikaUdeshi16
What is Trading in the zone | Example with trade Idea I daily make educational content videos on financial markets Long08:32by Apoorv-Dubey_SEBI-RA934
APOLLOTYRE W Pattern (Double Bottom)NSE:APOLLOTYRE #NSE:APOLLOTYRE formed beautiful double bottom (W) Pattern. Levels marked on chart for study.by Market_Order94
Few Most Profitable Chart Patterns1) Double Top, a Bearish reversal chart pattern It is a trend reversal chart pattern formed after good bullish price movement (a continuous upward price movement for a good duration) where the upward price movement loses its steam (formed a first top) and it retraces a bit (to neck line or mid point). Then again it moves in direction of original trend and reaches the first top level there by forming second top . It again cannot move above first top and start moving to neckline (NL). Once HEducationby Divyaapugal423
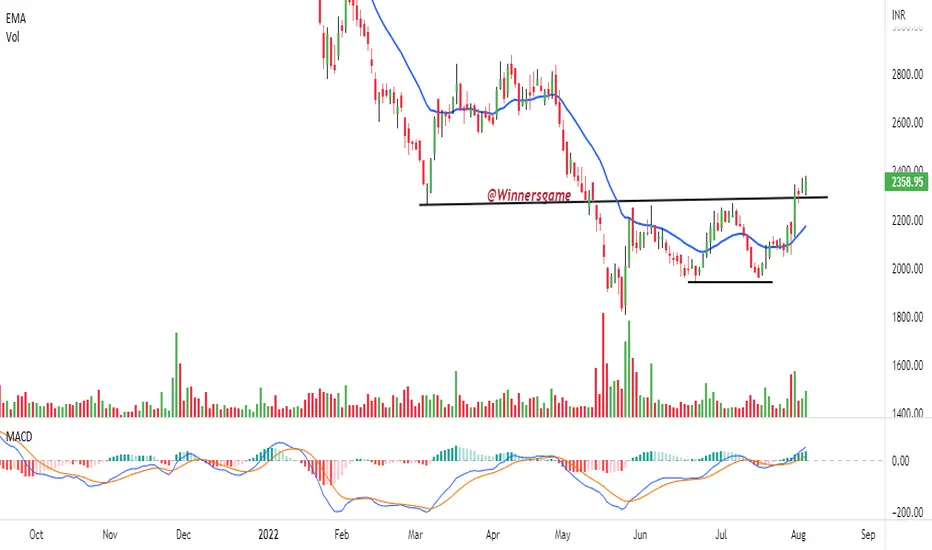
DrLal Path giving bullish breakoutBuy DR LALPATH 2300-2350, for 2450,2600/2650. invalid below 2230. Stock has given double bottom breakout with all leading indicator turning bullishLongby wiinnersgameUpdated 10
Double bottom in 15 Mins: Bank NiftyThere is double bottom in 15 mins. Can we see the Pattern complete or will there be failure of pattern? *It is analysis and no recommendation Longby VanshikaUdeshi55
BUY MONTE CARLOBuy Monte carlo 700, till 580 for 950,1050. Double bottom made at 450 range and stock is regularly surging higher. Today at 700 is highest weekly close. Exit if falls below 450 on weekly closing basis.Longby wiinnersgameUpdated 43
TEGA Industries B/O and reversal from bottomThis stock has made double bottom in Daily time frame and has reversed the trend. The stock is trading with good volumes so liquidity wont be an issue. the stock is new to market as this was listed recently through IPO window and has created a great returns through listing gains. profit booking in the stocks by big players led the stock to decline. now it is slowly gaining the momentum. Place strict stop loss according to your risk appetite and holding period. do not allocate major chunk of the Longby harshithshetty_Updated 8
M&M Finance Short Term Profit BookingBuy Above 168 for TGT of 180+ SL of 155 My First Trading Idea based on Price Action. For Education Purpose OnlyLongby Victory4sureUpdated 1
Double bottom patternThis isn't buying recommendation... I'm just validating / sharing my analysis with community of traders. Although, I have bearish view on Infy because of recent news and thoughts of CEO about the employees. ;) Well, Targets are %age of removal of total investment. 25% removal at every target. And shifting S/L to recent target. 👍Longby hs-sahota618
coromandel - Equity / F N O / Intraday - swing - long termNSE:COROMANDEL INTRADAY - SWING - LONG TERM Date of analysis : 27 January 2021 Time Frame : 60 Minutes Graph Pattern : Double Bottom RSI Indicator : RSI Bullish Divergence Observation : 1. Accumulation between 745 - 750 2. Trendline Breakout in zone of 745 - 750 3. Important support 725 -730. 4. After channel breakout Trend will be bullish. 5. Price action, indicator and pattern indicates possible Bullish move after channel breakout. Intraday : 768 - 770 / or as soon as channeLongby FalgunPrajapatiTradingUpdated 1
spandan : Twizzer Bottom , Bullish Engulf, Multiple BottomNSE:SPANDANA Price Action : Twizzers Bottorm - Bullish Engulf RSI: BULLISH DIVERGENCE Pattern : Double/Multiple Bottom Probability to break Green Trendline Observation: Buy with Given Target. Trendline breakout will be the Long opportunity for given Target Buy: @ 343.5 - 370 Stoploss : 330 Target : 390 - 408- 440 - 484- 500 - 510 + + + + + + + + + + + + + + + + + + Note: Never Trade without stop - loss.Long term Stop loss should not be more than 4 %Longby FalgunPrajapatiTradingUpdated 4
Poonawalla Multisupport with possible range breakoutNSE:POONAWALLA View: Bullish Time Frame : D Structure Range Bound Range: 210 - 268 CMP : 248.60 View : Bullish till 260 then expecting breakout of 268 due to multiple buying between 210-216 Important support or Buying Zone : Multi support at 211 -216 Buy at > = 248.60 Stop Loss : 238 Target 260 - 270 - 295 Longby FalgunPrajapatiTradingUpdated 0
DOUBLE BOTTOM PATTERN BREAKOUT IN DIVIS LABS.Hello traders , here is the analysis for this stock let me know in the comment section below if you have any questions , the entry will be taken only if high of today is taken out . I suggest you keep this stock on your watchlist and see if the rules of your strategy are satisfied.. According to me, an up move of 20-25% can be expected in DIVISLAB. Keep trading ❤️ Hustle hard ✅Longby sunandan290
lti back in uptrendstock corrected almost 50% from its 52 week high and we can see double top formation and price corrected and now double bottom is formed and cup is made of double bottom with falling wedge as handle now we can consider it to be in the buyzone and we also see rsi positive divergence + price closing above 75 ema so multiple signals prove that we have a strong up trend LLongby master-oogway4
tech mahindra back at where it started we can see double bottom , rsi positive divergence and now the price is above 75 ema so it is in buying zone and price already corrected from 52 week highs can accumlate for good risk reward ratioLongby master-oogway0
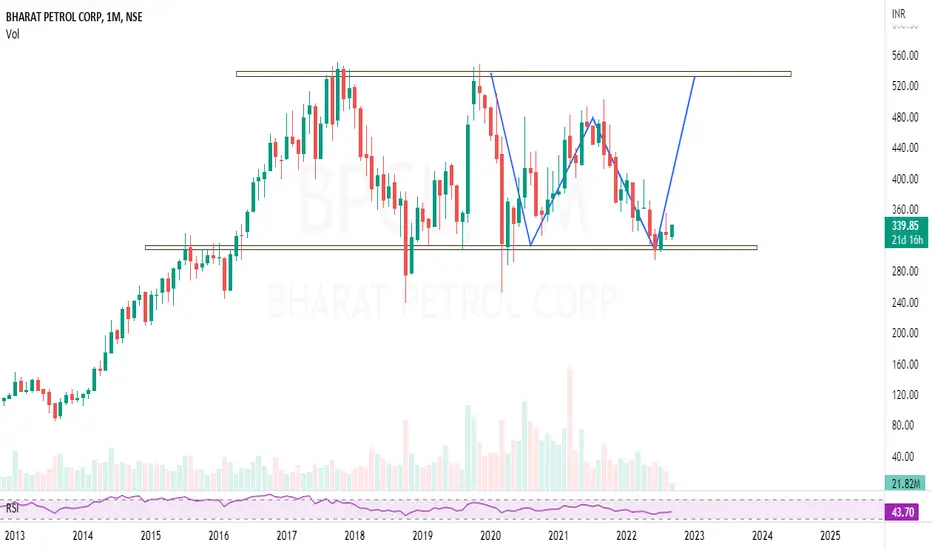
BPCL | Things aligned properly - Looks good for a long term betBPCL | Things aligned properly - Looks good for investment than short term trading Quality stock High dividend yield, Discounted price, Has atleast 60-80% room to rally. Technically a good setup aswell.Longby srikartiram30
[Positional] HAVELLS Double Bottom BreakoutHavells has formed a nice double bottom.Today it has come out of Double bottom pattern also it has broken the resistance zone- so higher levels are expected going forward. The length of bottom is quite high - and it exceeds the ATH of HAVELLS if projected upwards - so our R:R will be low in this case. Entry - 1348-1350 Target - 1486 SL - 1200 Though R:R is very low - Probability of profit is high.Longby Santosh_A_ChavanUpdated 11
BHARTI AIRTEL ANALYSISHello.., 1. airtel traded sideways in weekly.., its exactly bounce back from demand zone around 640-650 levels. 2. already institution players entered in demand zone. 3. now we got a double conformation double bottom formed in day chart. 4.if its break 700 day close basis target would be 770 5.target period 15 to 18 days Longby sathiyans31Updated 1
Gold XAUUSD Technical Analysis UpdateAs you can see on the Gold XAUUSD chart, The price has reached a significant support level and it's possible that it forms a double bottom pattern and pushes the price higher to the trendline. In the lower time frame based on the minor levels we can look for breakout patterns or pullbacks to open the trade for the TPs. On the dollar index ( DXY ) the reversal pattern hasn't formed yet so this analysis 60% can be correct. Wish good luck for everyone Risk Warning Trading Forex, CFDs, Crypby pullbacksignal8
UPL respects its uptrend !UPL Has formed a beautiful double bottom pattern with its first support off the 200 EMA and second off the long term trendline. UPL has given a double confluence 1. Rejection candle and respect of the long term trendline 2. Golden Cross( Crossing of 50EMA and 200EMA) A long position can be taken on break of the resistance zone Risk To Reward of 1:2 or a more riskier approach would be if trendline is broken. Keep It Simple by Krish_Kohal3
 LongLong
 Long
 Long
 Long
 Long

 Long
 Long
 Long
 Long
 Long
 Long
 Long
 Long
 Long
 Long
 Long
 Long
 Long
 Long