Nifty 50 Outlook for the Expiry week May 23 – May27Falcon Analytics Outlook Nifty 50 for the Expiry week ( May 23 – May27 )
As Discussed in Last Weekly Analysis Nifty sold off from major resistance @ 16387 while the major support for the week @ 15560 was not breached.
Technically for this week on the daily charts we see major support on the downside for Nifty50 index lies at 15726 levels,
whereas major resistance on the upside is capped around 16386 levels.
If Nifty50 index breaches major support on the downside and closes below it, we may see fresh break down and index can drag towards major support on lower side around 15474/15222 and and if breaches major resistance on the upside and closes above it, we may see fresh breakout and index can head towards higher levels around 16542/16794.
Currently Nifty50 index is trading Below 200 day EMA @ 16783 suggests long term trend is Bearish .
Range for the week is seen from 15222 on downside and 16794 on upside.
Below Mentioned Spot Levels can be used to trade Long Or Short during the week ahead.
( All Spot Levels)
RESISTANCE 4: 17046
RESISTANCE 3: 16794
RESISTANCE 2: 16542
RESISTANCE 1: 16386
WEEKLY PIVOT LEVELS: 16134
SUPPORT 1: 15882
SUPPORT 2: 15726
SUPPORT 3: 15474
SUPPORT 4: 15222
All above views for education purpose only.
Regards,
MD .
Double Bottom
#StockMarket #StockIdeas #StocktoWatch #StockToBuy #positionalPAYTM
After listing stock corrected very much upto 75%.
Stock corrected upto 510 levels & it looks strong support and form double bottom pattern.
Buy for mid to long term view and add more at 510 levels
But keep Strict Stop loss of 495 levels.
----
Note:
Above levels are for education purposes only
Do your own analysis before taking any trade
Please Like & Follow
ANDHRAPET started moving higher ANDHRA PETROCHEMICALS LTD is ready for uptrend. After been in a downtrend for almost a year, this stock is ready to move up from here on. Recently this stock has formed double bottom pattern and has broken the neckline of the same. Huge volume is clearly seen at the time of breakout. Now that all stocks in this sector are moving higher, this is also ready. Swing traders keep an eye on this stock and can accumulate on pullback
SHAKTIPUMP to revers it's downtrend from strong weekly support.SHAKTIPUMP is has been in a downtrend for a long time. Now it has formed double bottom pattern on its strong weekly horizontal line support. Also is forming a bullish hammer candlestick pattern on weekly support line. This suggest that there is a strong demand for this share around this level. The stock has closed above the neckline of double bottom in hourly chart in the back of huge volume. It clearly shows strong buying interest. Swing traders keep this stock on radar and look to enter in dips. Swing traders may book their profit around downward sloping trendline. If it breaks that line then the stock will surely touch new highs in coming future.
ACCELYA may reverse it's downtrend.ACCELYA Solutions Ltd. A small cap IT company catering to Airlines & Tourism Industry. Toady it came up up with good quarterly results. Stock has been in a short-term downtrend. Now price has reached it's weekly support trendline. Also if we go back to MAY-JUNE 2021, we can see huge volume around this price. In daily time frame stock has formed a pattern similar to double bottom. On hourly chart symmetrical triangle has formed and price is inching towards narrower range. On 15 minute chart in the last trading session, we have seen a buying with volume. Considering all these factors, I believe that smart money is interested in this stock around this level. Long term investors and swing traders can keep this chart on radar.
TV18BRADDCAST - MultibaggerTV18BRDCST (monthly chart)
double bottom (w) breakout
Buy 70-75
Target 126 & 215
Stoploss 56
Investment stock
T
#StockMarket #StockIdeas #StocktoWatch #StockToBuy #ShorttermMARUTI SUZUKI
Stock on daily chart formed bullish Adam-Eve pattern followed by Double bottom pattern
Also give trendline breakout in last trading day & closed above all EMA.
Buy above 7950 for Intraday target of 0.6-1%
Also further add above 8000 levels for swing targets of 8200/8350
----
Note:
Above levels are for education purposes only
Do your own analysis before taking any trade
Please Like & Follow
IIFL will reach All-time high levels?IIFL recently broke out from the W pattern(Tripple Top) and retested the same levels within a few days. It bounced back from the previous resistance levels and looks like it's gonna reach the all-time high level which is around 440.
Cheers! This is as per my Analysis. Feel free to share your view about this. Please do your analysis before trading/Investing.
Happy Trading
Dual breakout in IIFL !!!!
IIFL has given dual breakout from Double bottom and
Double top pattern above 360.
IIFL has finally given breakout above 360, after two
attempts i.e. Double top breakout with buzzing volume.
IIFL has also formed Double bottom pattern whose breakout
also came above 360 which is a strong bullish sign.
Both RSI and MACD is showing strength,
RSI breached above 60 and MACD crossover
is visible.
#StockMarket #StockIdeas #StocktoWatch #StockToBuy #ShorttermMAX Ventures
Looks good, Double bottom pattern formation
& Also trendline breakout on daily chart
Buy at CMP or above 119 levels for
Targets of 125 / 135/ 140 levels
Keep SL at 110.
----
Note:
Above levels are for education purposes only
Do your own analysis before taking any trade
Please Like & Follow
MLong
RATEGAIN forming bullish continuation patternRATEGAIN is forming a bullish pennant pattern after breaking out from double bottom i.e. trend reversal pattern. Few weeks earlier it rose sharply after breaking double bottom pattern and now this vertical rise can be considered as flag. The stock is now consolidating, volumes are also drying and moving eastside towards apex point of pennant. Intraday traders and Swing traders can keep eyes on this, as it may breakout anytime. Once you see volume picking up, one can enter.
SHALBY - Short Term SwingSHALBY
Buy-Above 130
Sl-112
T-155 165 180
Short Term To Mid term
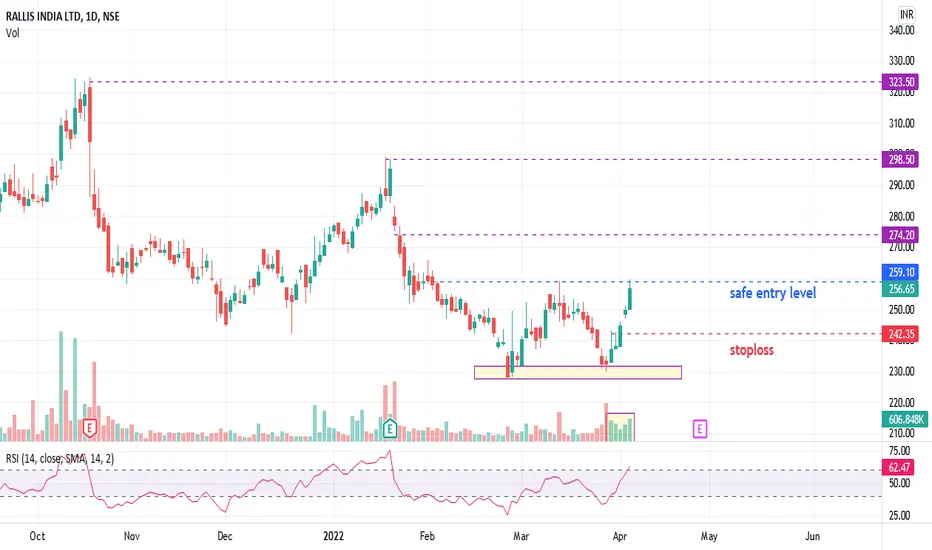
SHALBY has been in correction phase since last 7 months. On 4th April the stock has given trendline breakout of the whole correction phase. Suggesting some kind of retracement of the down move. Stock has made double bottom and the neckline is also tested. Stock is good in Short term to mid term.
44 MA support + double bottom There is a support from 44 MA and as well as there a double bottom .Stop loss is just below the moving average and the support and resistance area.You can also choose 50 but i prefer 44MA
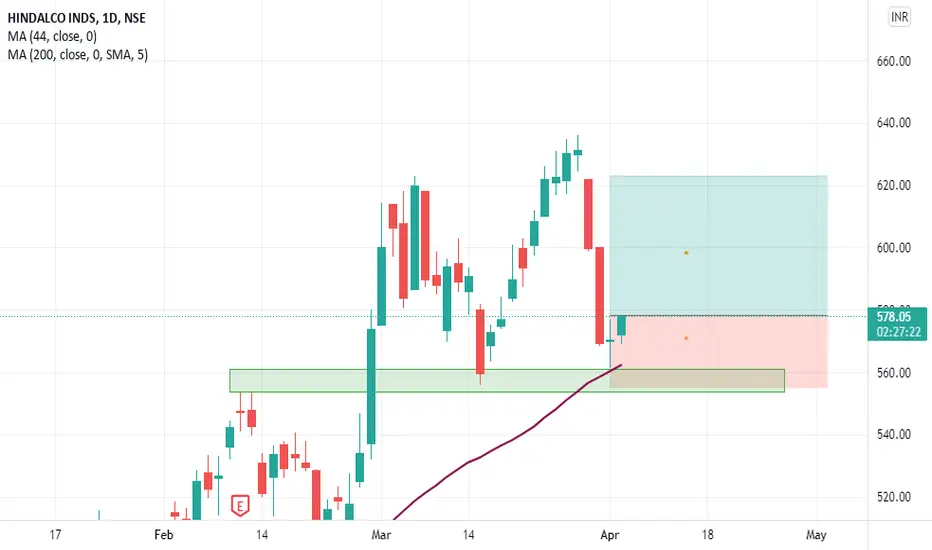
Risk and Reward is 1:2 .
Also double comformation is giving by support and resistance area .
Trade must go on for one week or so .
#StockMarket #StockIdeas #StocktoWatch #StockToBuy #positionalMAS FINANCIAL SERVICE
Although Stock is in downtrend, we bet soon Uptrend will start
On weekly Chart Inverted Flag pattern can be seen
On Daily Chart we can see Double bottom pattern
Buy At CMP for positional targets of 650/700-725 levels
Keep SL of 480
Mid to long term View
----
Note:
Above levels are for education purposes only
Do your own analysis before taking any trade
Please Like & Follow


