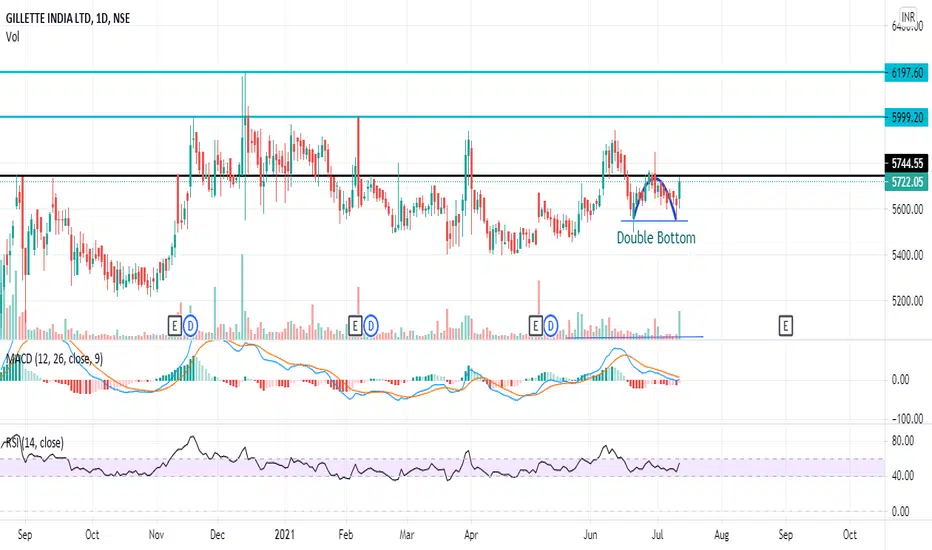
Double Bottom
DFL Intraday Breakout on 15 MinutesPossibility 1:
As it seems to look like Inverted Head and Shoulder with Double Bottom. Why Double Bottom? As we can see consolidation after 12:15 PM, and ATR is also quite Weak. It might go down for previous Bottom of the chart. Then it will go up to test the Resistance 335.60 and come back to 335.60 and then will all power it'll break all the Resistance for the Ultimate Target of 342.50.
Possibility 2:
It will simple go up, and if it breaks the resistance between 335.60 to 336.60 for the ta
What is Dounle Bottom Pattern?What is Double Bottom Pattern?
The double bottom pattern looks like the letter "W". It indicates an trend and momentum reversal in a particular asset. It is best for analyzing the intermediate to longer-term view of a market. Double Bottom Pattern one of the most reliable reversal pattern after Head and Shoulders Pattern.
How does Double Bottom Pattern Work?
Double Bottom Pattern works in two phases:
Phase 1:
When the major trend is downtrend and forms the first down peak, then from the suppor
SIEMENS IS BULLISHSIEMENS IS READY FOR A BULL MOVE
Trade idea- Double Bottom chart pattern.
Price is above 50SMA, hence is trending
BEARS tried to push the price down twice and failed. a beautiful support is take from 1924.65 and
BULLS were aggresive enough to push the price back up
FUNDAMENTALS:
Dividend Yield 0.34 %
ROCE11.4 %
ROE 8.29 %
Piotroski score 5.00
Graham Number ₹ 410
SOURCER: screener.in
THIS TRADE IDEA IS ONLY FOR EDUCATION PURPOSE
ETH-USDOnly 2 days are left for Ethereum's Hard Fork, this upgrade will be very critical for the Ethereum based dApps. Ethereum London Hard Fork popularly known as EIP-1559 Upgrade is scheduled to go live on August 6th. The upgrade is expected to reduce the gas fees being charged on transactions by implementing a base fee pricing mechanism that would dynamically change with respect to the congestion in the blocks of the Ethereum blockchain.
On the Daily TF, ETH was trading in a Bullish Descending Tri
Double Bottom: Bullish Move in EtheriumAs per my last analysis, etherium has broken the 2400 resistance.
The price pumped almost to the 2700 mark before falling down for a sharp correction.
Meanwhile, you can see a double bottom pattern forming on the daily chart as well as the one hour chart.
This signifies a major upward movement with a potential of breaking out the 2900 level which has been the ATH for some time.
The ema at 2400 level which can be seen on 4 hour time frame is confirming that price won't fall below 2400, hinting
HEROMOTOCO | 20-25% potential | Low risk tradeCMP- 2828
SL-2700 - 2730 (on closing basis)
Target - 3200, 3500
30/7/21
- Market structure negative making LH - LL
- Key level of support around 2700-2800
-Trading below all EMA's
- Fib retracement 0.38 zone
- Can se potential W pattern if price holds 2700 levels
- Price is near area of value
- Making a double bottom like pattern in the week
Keep strict SL to 2700-2730 on closing basis.
LTI | Breakout | Double Bottom | Swing Technical Analysis with Chart Patterns
1. Uptrend
2. Double Bottom chart pattern in Daily Timeframe
3. Breakout supported by successive buying volumes
BUY Calls
1. Wait for a pullback as shown on the chart to reduce stop loss
2. Buy on the rebound after a pullback
TARGET
Crossing 5000 and above till 5200
LLong
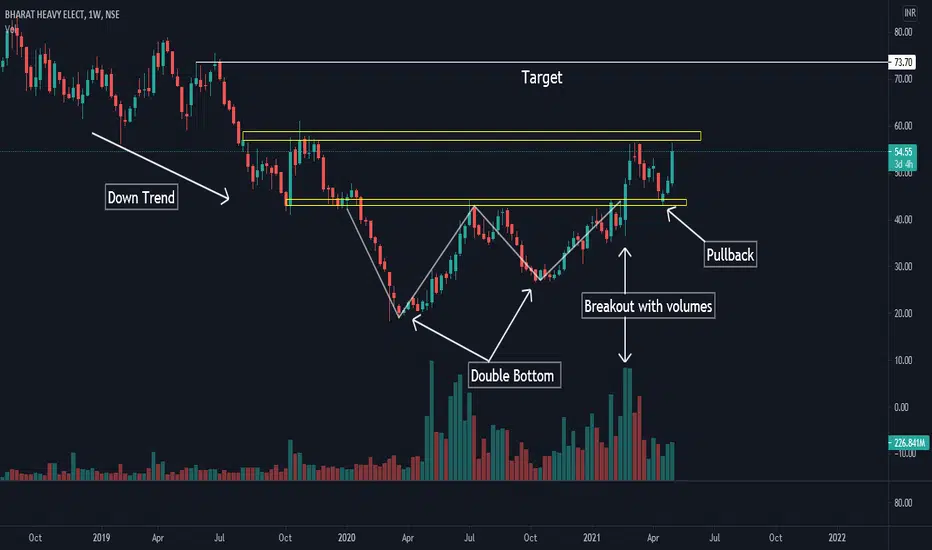
BHEL Trend Reversal with Double bottom at long term SupportAll observations on chart.
Stock is in bear market for many years. It formed a double bottom pattern, gave breakout with volumes & now there is a strong pullback.
Double bottom is trend reversal pattern preceded by down move. After pattern breakout trend reverses to up-move. Location of pattern is important, such patterns workout superbly when such pattern is formed at long-term supports or a strong support.
In Case of NSE:BHEL Double bottom pattern is formed at multi year supports check be
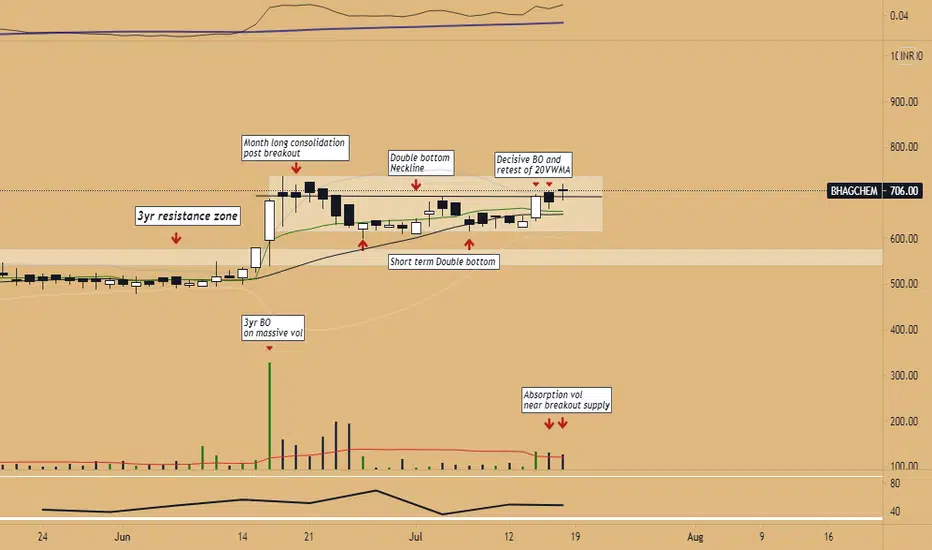
Bhagiradha Chem - 3yr BO retest with Double bottomThe stock is showing interesting price action. From here on, wait for volumes to drop very low, or wait for the price to breach the short term upper resistance (whichever happens early), and then take entry. Price action explained on chart.
Mkt Cap ~ 600Cr
D/E ~ 0.1
SL: Depending on your risk appetite: Below Weekly BO Candle / Below Daily BO Candle / 50% of Weekly BO candle / Below 20DMA
TGT: After a 10-15%+ vertical move, breakdown of 20DMA (on a daily close basis)
BUY GUIDANCE:
Never ever b
Motherson Sumi Double Bottom Pattern (will it repeat again)NSE:MOTHERSUMI
This is for Positional Trade
Mothersumi is forming double bottom pattern same like it did before.
I have marked the formation of double bottom pattern and also the previous formation of it.
You can take position once the neckline will get tested for support. And then it will be easy target of 35-40 points up move in just couple of days.
All the best for trading in next week.
Comment below if my Ideas are helping you to understand the levels.
Also comment your suggestio
MLong
Breakout Expected this week. Keep in RadarThis stock has the superb fundamentals and looks very good on chart for swing trading.
Double bottom formation is near to complete if it gives breakout.
Majority of buying done in last few days.
A good momentumeis expected any side, mostly up move as per price action patterns.
This post is for information purpose only