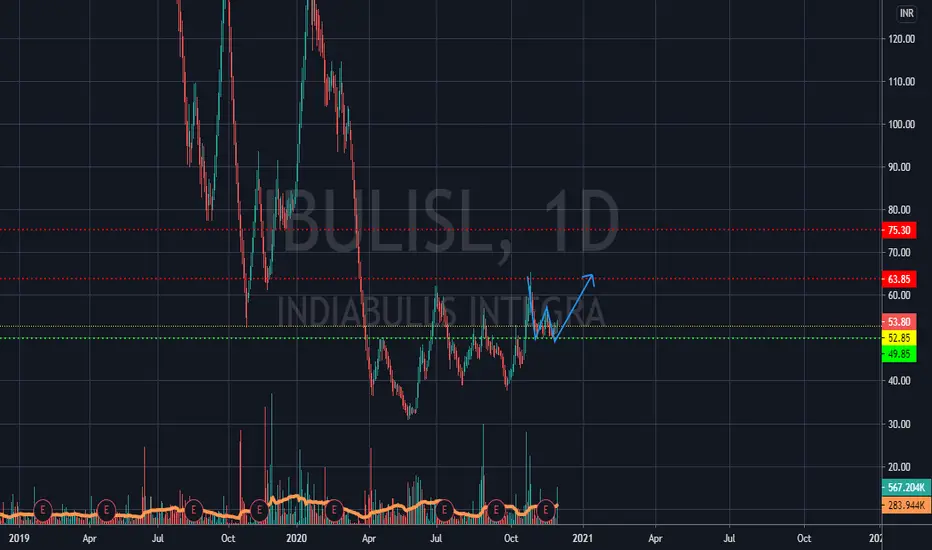
Double Bottom
SUNTV : make or break point on 1hr/2hr/1DDisclaimer: This is only for educational purpose.
SunTv near crucial resistance zone. if break it can head towards 550+ zone, whereas RSI shows a long bearish divergence. We can see a small correction before or after breakout or consolidation before a significant move.
Breakout in PNB PNB has given breakout ( double bottom pattern as well as long term trend line) on daily chart . This breakout is supported with huge volume . post breakout, it has tested the support and ready for fresh upmove. Minimum upisde should be about Rs 50
Disclaimer : for education purpose only
GAIL INDIA LTD- W PatternGAIL India Ltd daily chart shows a beautiful W pattern. It is likely to follow the W pattern. The dotted lines shows the probability of the movement. If everything falls in place, it might complete the W pattern. A double bottom pattern is a technical analysis charting pattern that describes a change in trend and a momentum reversal from prior leading price action. The double bottom looks like the letter "W". Can go long with trailing stop loss.
Note: I am just a beginner. This chart is for learning and educational purpose only. Kindly invest based on your research and analysis. Do not forget to give a like if you find this chart helpful. Happy investing :)
ILong
Long Tata Consumer 1. Price broke above the downtrend trendline and making higher lows.
2. Double Bottom confirmed as the neckline (494.20) broke with a huge volume.
3. RSI Divergence: Price making lower low but RSI making Higher High (see daily chart, low made on 14 Oct and 21 Oct 2020)
4. RSI in Harmony: Price making higher high but RSI making Higher High (see daily chart, high made on 15 Oct and 27 Oct 2020)
buy only above 510
Target 530/560/580
SL 483
WLong
INFRATEL | W Pattern and about to take trend line support (18%) INFRATEL | W Pattern and about to take trend line support. Can see 18%
CMP : 177 (Buy range 173 to 174)
SL : 170
Target : 205
ILong