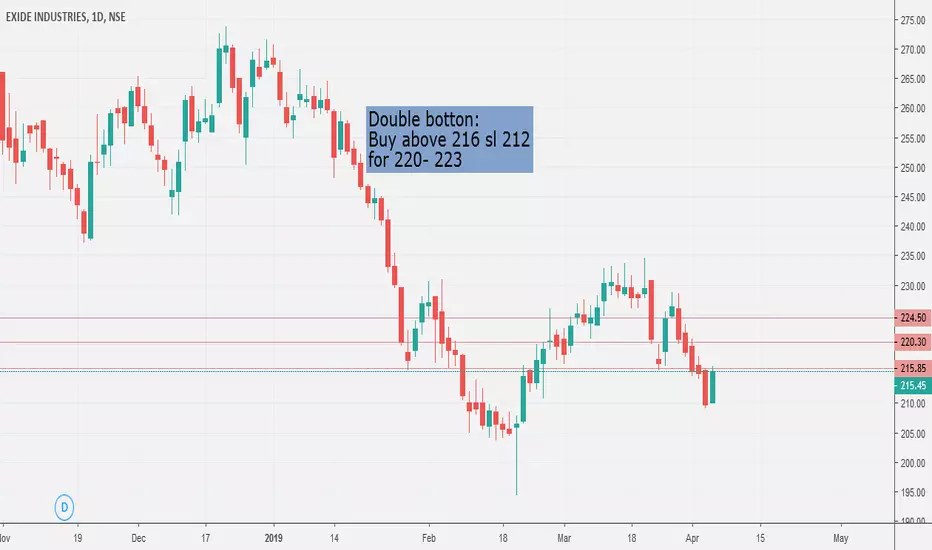
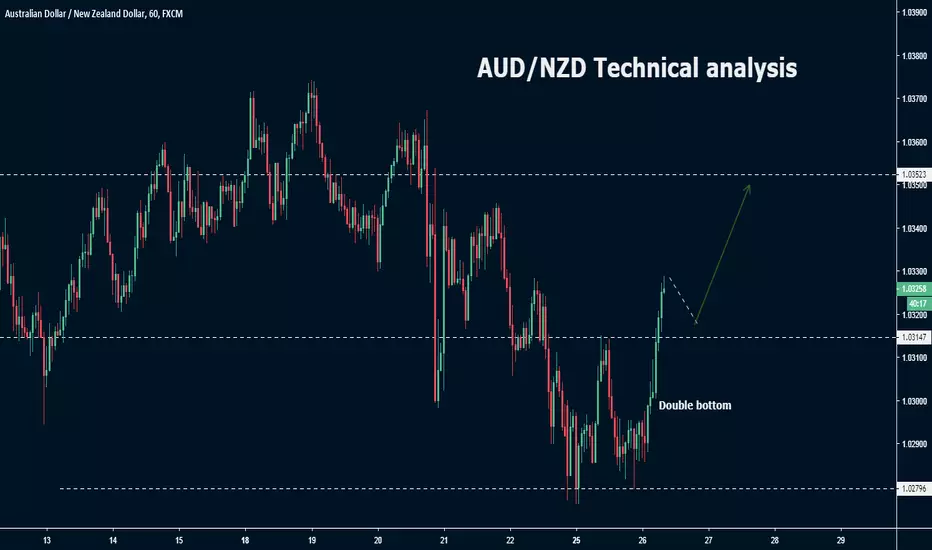
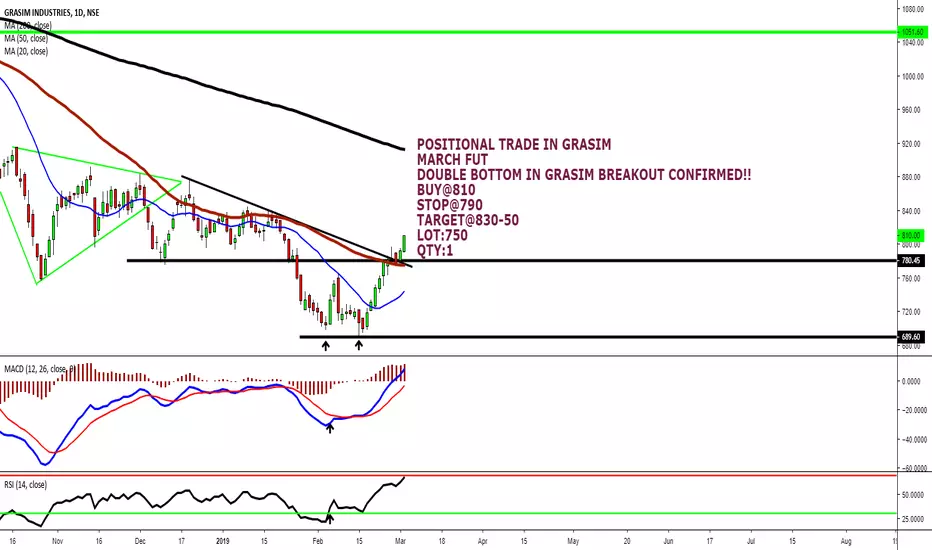
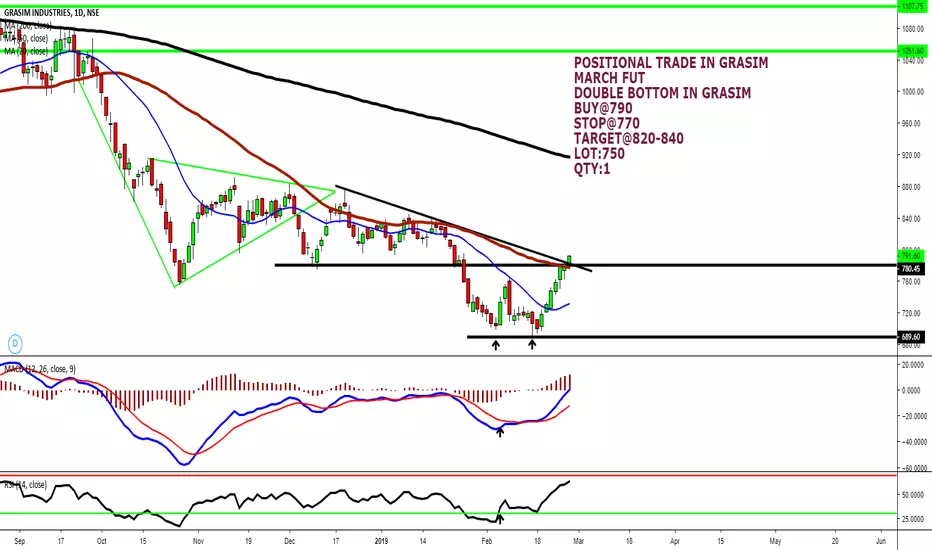
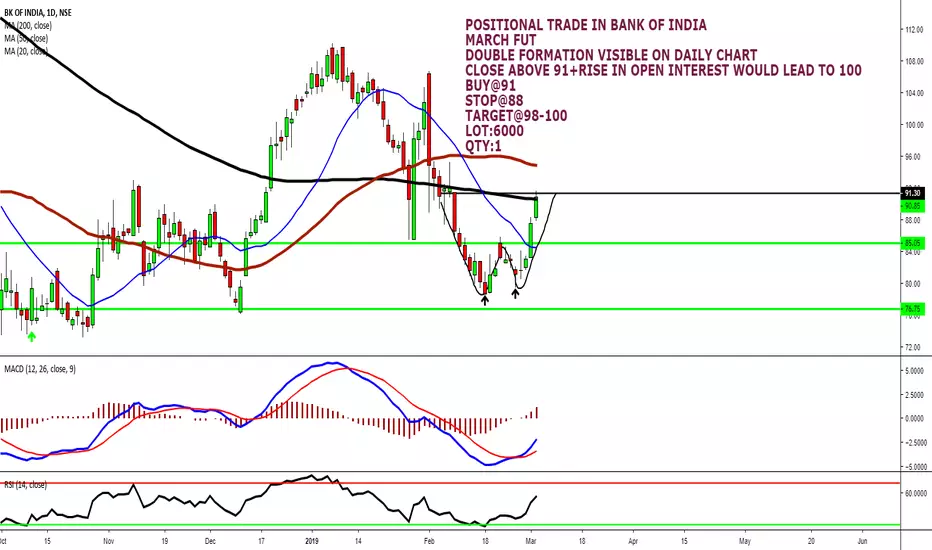
Double Bottom
Dhanuka Agritech | Will Monsoon help?Price action of Dhanuka Agritech exhibits a sustained weakness in Weekly time frame. The stock has consistently formed lowers and lower highs until recently.
By analyzing the recent price action, we could see that the two relatively new lows formed are at the same level indicating that bears might be losing steam. In fact previous weekly candle was huge thereby breaching a falling trendline. Assuming that the recent recovery will continue, the stock might be en route towards 475-490 levels. T
TATA ELXSI ANALYSIS- PLAYING W/ DOUBLE BOTTOMLets look at the analysis --->
1> EW ANALYSIS :-
Assuming this trend from 1490.9 level in corrective phase, we will assume impulse wave completed at 830.1, after that it slightly got complicated, still we will keep prefer count as B as flat, now we might be in wave c of B.
2> Classical TA :-
a. the downtrend channel has given a breakout
b. formed a minor double bottom (named as double bottom 1) with neckline at 911 (marked with red horizontal line)
c. formed a major double bottom (named
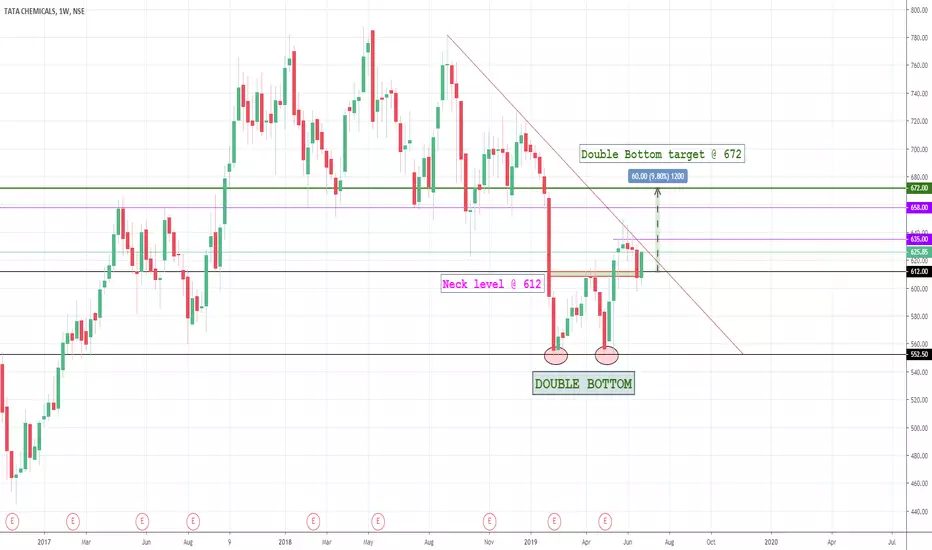
Tata Chemicals | Double Bottom - WeeklyDouble Bottom pattern observed in Tata Chemicals. Neck level was broken in second week of May thereby confirming the pattern. The recent fall could be counted as neck level retesting. In that case the stock will move up to 672 where the pattern target falls. However, a trendline still holds and we could see noticeable resistances at 635 and 658. A break above 635 will be key. Hence, if resistance at 635 fails Tata Chemicals could move swiftly towards double bottom target.
(Disclaimer: Our ch
Auropharma - Elliottwaves - Will It Repeat The Fall of 2016!!!Auropharma Profile Page at
in.tradingview.com
Note -
Use Signature Field to put 3rd party links / website details / social media details which comes as a part of “Premium subscription” (Promoting 3rd Party Links apart from premium version –do check with the moderators as it could violate house rule )
Reach Moderators
in.tradingview.com
Pricing Details for TradingView Subscriptions at
in.tradingview.com
Trading Strategy
Long Term Strategy
Plan A
Expect Explosive Move Upside
Nifty- 29th April 2019 - How will you sell ? - X -Wave MissionWe are now in Plan F as mentioned in the video idea published on 9th April 2019
9th April 2019 - Elliottwaves - Let us make some wedges
-------------------------------------------------------------------------------------------------------------------------------------
Trading Strategy
Once Head & Shoulder Pattern gets activated as explained over the video look for below mentioned targets
Activates below 11550
Target - 11300-11325
Target - 11125-11150
Risky Traders Selling bel
Tata Coffee-Enjoy the Coffee in The Cup
Thanks for your precious time & do put your feedback below in comment section - I would love to hear from you. Most of us can learn as well -
-----------------------------------------------------------------------------------------------------------------------------------------
Correction -
Sorry using "circular shape" over the video - Its a curve shape from 168 to 185 - silly mistake -happens.
----------------------------------------------------------------------------------------
TEducation
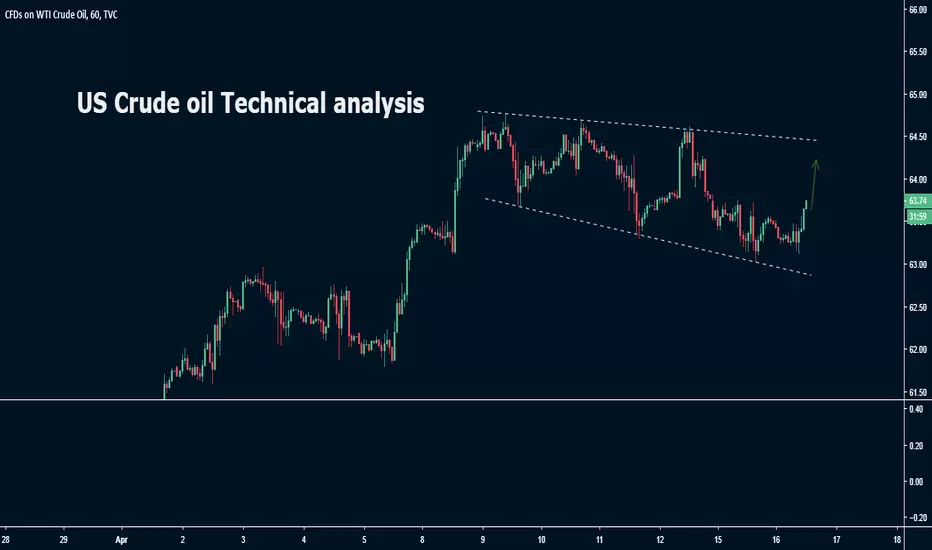
US Crude Oil Technical analysisAfter hitting the mark of $65, crude oil is consolidating in the form of a bullish flag pattern.
Two legs of the flag pattern has completed and it is currently at its third and final leg.
Although, we expect the flag pattern to render a bullish breakout, for now, we expect a movement to the resistive trendline only.
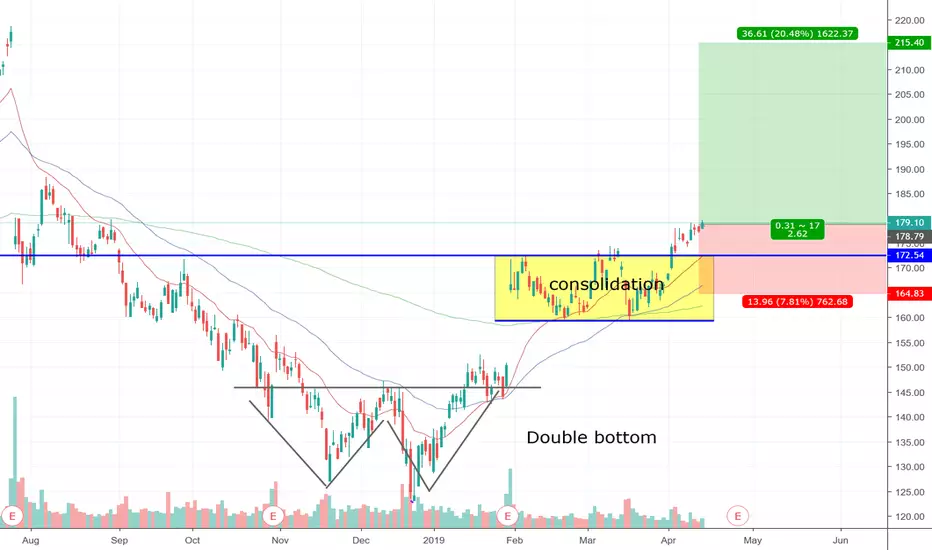
Uptrend in FBFB formed a double Bottom from 11/18 to 02/19 which was confirmed by the succesful breakout on 14 january. Fueled by the earnings Reports on 30 january FB had a big upside gap. Now we have breakout of the consolidation and so we have further updside potential.
Profit Target 215$, Stop loss 165$
2:1 reward : risk ratio
FLong
EUR/AUD Technical analysisThe pair is confined within the ranges of 1.57393-1.60778 for the past 2 months.
It can be construed as ABC correction and the pair is assumed to in bull cycle.
The value of 1.57393 provided strong support to the counter and it reversed the pair from the downtrend.
A double bottom pattern formed at the formidable support of 1.57393 is actually the wave 1 and 2 of the bull cycle.
The break of the trendline and the formation higher high also adds strength to the above theory.
Currently, the pair i