PARAMOUNT COMA LTD📊 PARAMOUNT COMA LTD (1D) – CMP ₹60.08
📅 Date: May 20, 2025
📈 Exchange: NSE
📌 Ticker: PARACABLES
🧠 Technical Analysis Overview
✅ Bullish W-Pattern (Double Bottom):
Price has formed a strong W-pattern, also known as a double bottom, indicating a potential trend reversal. The neckline breakout above ₹58.00 confirms bullish momentum.
✅ Downtrend Breakout:
The long-term falling trendline has been broken decisively with strong bullish candles and increasing volume – a classic reversal signal.
✅ Vo
Double Bottom
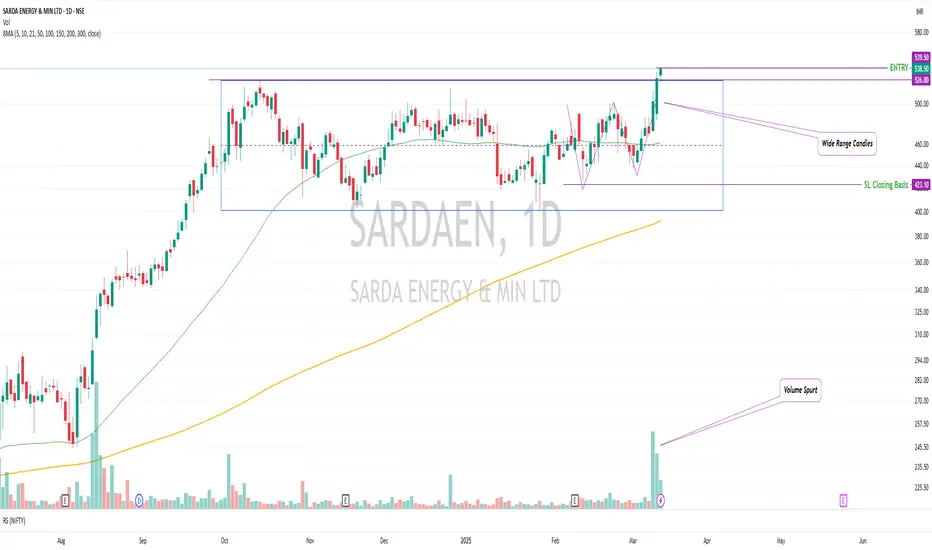
SARDAEN - Breakout WatchlistWhy This Stock?
✅ Base Breakout – Breaking above ₹526.2 with strong volume confirmation (4-5x past trading sessions).
✅ Trading Above Key DMAs – Strong price structure with good RSI.
✅ No Left-Side Resistance – Clean chart structure with potential for an uptrend.
✅ Formation of W Pattern + VCP – Classic bullish continuation setup.
✅ Resisted Market Fall – Showcasing relative strength despite overall weakness.
Safe traders wait for a weekly close above the break-out level ₹526.2.
Key Levels
BDL – Weekly W-Pattern + Sector Strength + Volume Surge 📈 BDL – Weekly W-Pattern + Sector Strength + Volume Surge = High-Potential Positional Setup
BDL is showing textbook technical confluence at the right time:
Sector: Defence index at all-time highs
Stock: BDL forming a clear double bottom (W-pattern) over several months
Weekly breakout underway with strong green candle and volume confirmation
Structure: Rounded base, higher lows, long support holding strong
Price just broke key levels with momentum — setup for multi-leg positional rally
🧠 T
BEL – Sector Strength + Double Bottom + Volume Thrust 📈 BEL – Sector Strength + Double Bottom + Volume Thrust = A Setup Worth Tracking
The India Defence Index just broke into new all-time highs, possibly driven by rising geopolitical tensions — but beyond the headlines, the sector remains structurally strong.
BEL (Bharat Electronics Ltd) is showing powerful confluence:
A double bottom breakout
Sectoral support
Rising volumes
Key moving averages reclaimed
All of this sets up a technically sound positional opportunity.
🧠 Technical
ICICI Bank-Aiming for Double Bottom Breakout?ICICI Bank – Technical Analysis & Trade Plan
📈 Trend Analysis:
Stock is in a strong uptrend with a higher high, higher low (HH-HL) structure intact.
Consolidating since September 2024, forming a base.
Double bottom formation visible, with a potential VCP (Volatility Contraction Pattern) at play.
Trading above key DMAs, confirming strength.
Sectoral strength: Finance & banking showing momentum and could lead the next market move.
📊 Market Context:
Broader market is showing slight improvem
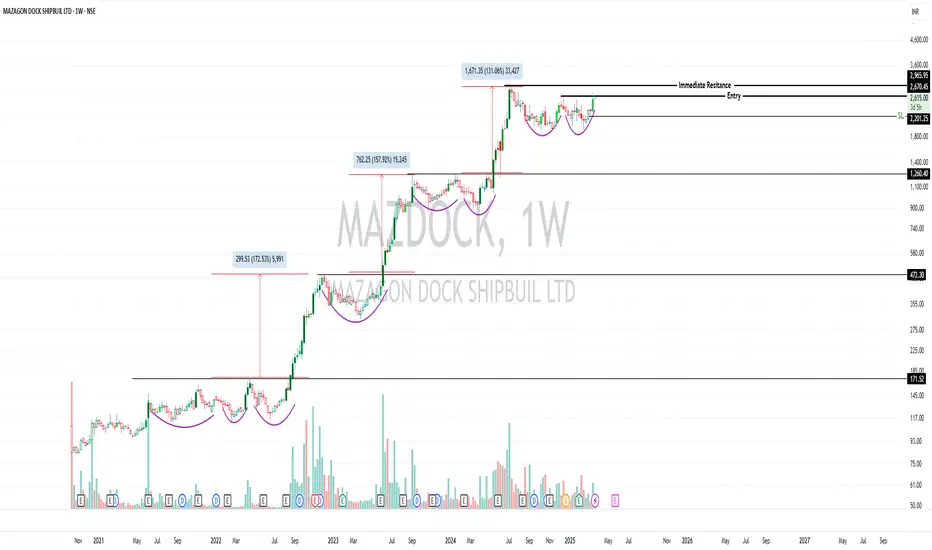
Mazagon Dock| VCP & Double Bottom – Watch for a Breakout!Mazagon Dock ⚓ | VCP & Double Bottom – Watch for a Breakout! 🚀
Mazagon Dock (MAZDOCK) is forming a Volatility Contraction Pattern (VCP) + Double Bottom on the weekly chart. A potential breakout is in play.
📌 Entry: Above 2671 (preferably on a daily close).
📌 Immediate Resistance: 2966 (All-Time High). Watch price action at this level. A strong breakout with volume could signal further upside.
📌 Stop-Loss: 2201 (Daily close). ⚠️ SL is deep (~17.6%), so position sizing is critical.
Trading St
Mangalore chemical:(Ready to shoot up); Take a look; Min 50% RoiHuge potential is there.
For short term investment ;
Leave a " Like If you agree ". 👍
.
.
Wait for Breakout & then Daily candle to close above - "135"
.
If you want to enter now "Go for it with stoploss".
.
.
Enter after Price Breaks
"Yellow box" mentioned.
.
Don't make complicated trade set-up.📈📉
Keep it " simple, focus on consistency " 💹
Refer our old ideas for accuracy rate🧑💻
Valuable comments are welcomed-✌️
.
Follow for regular updates.👍
MLong
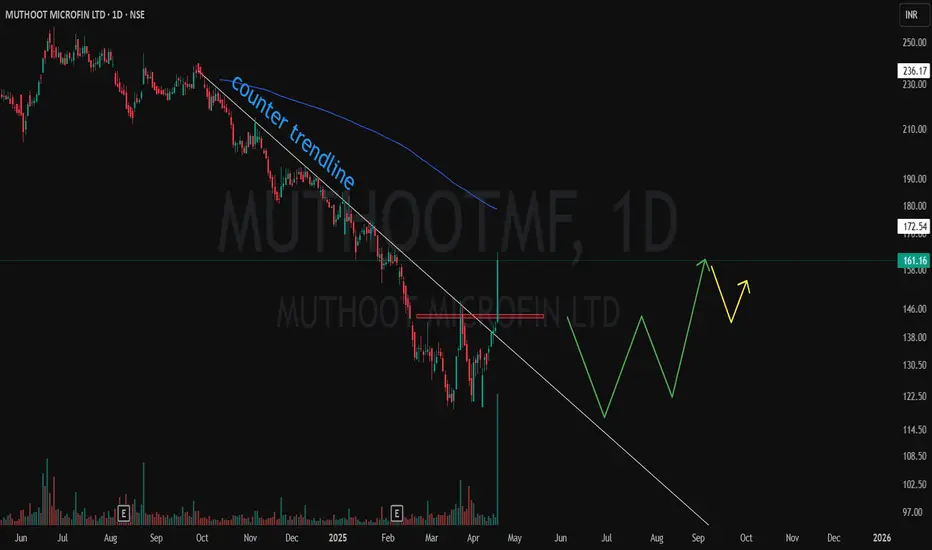
Muthoot Microfin LTD – Major Breakout in Play!🟦 Blue Line: 200 DEMA
Still overhead, but the recent price action indicates a potential shift in trend. Price reclaiming above this zone will be another bullish confirmation.
📌 Breakout Highlights:
Counter Trendline Breakout: Price shattered the CT-based trendline with high volume.
W-Bottom Formation: A textbook double bottom structure is visible with neckline breakout.
Green Path: Illustrates the bullish trajectory already played out post breakout.
Red Zone: Key resistance turned support — now
WELSPUN – Double Bottom Reversal with Trendline ConfluenceSetup Type: Reversal + Breakout | Conviction: Medium (Confirmation Needed)
Chart Framework: Price Action + Chart Patterns
WELSPUN is printing a strong bullish reversal structure, supported by both horizontal and diagonal resistance levels:
🟡 Double Bottom at Equal Lows – Classic reversal base forming after a downtrend.
📏 Equal Lows Liquidity Grab – Smart money may have hunted stops before pivoting.
🟢 Massive Volume Spike – Indicates strong interest building up.
📐 Bearish Trendline Resistanc
Gujarat Alkalies | Explosive Double Bottom Breakout!📈 Stock: Gujarat Alkalies & Chem (NSE)
💰 CMP: ₹647.75 (+14.50%)
🚀 Why This Chart Stands Out?
✅ Double Bottom Breakout: A textbook bullish reversal pattern with a strong retest.
✅ Supply-Demand Flip: The red zone acted as a resistance, now turning into support.
✅ DTF CT Resistance (White Line): Broken! A major trendline breakout signals momentum shift.
✅ WTF Resistance (Yellow Line) Next: The last hurdle before a potential strong rally.
✅ Volume Confirmation: Increasing volumes validate the brea
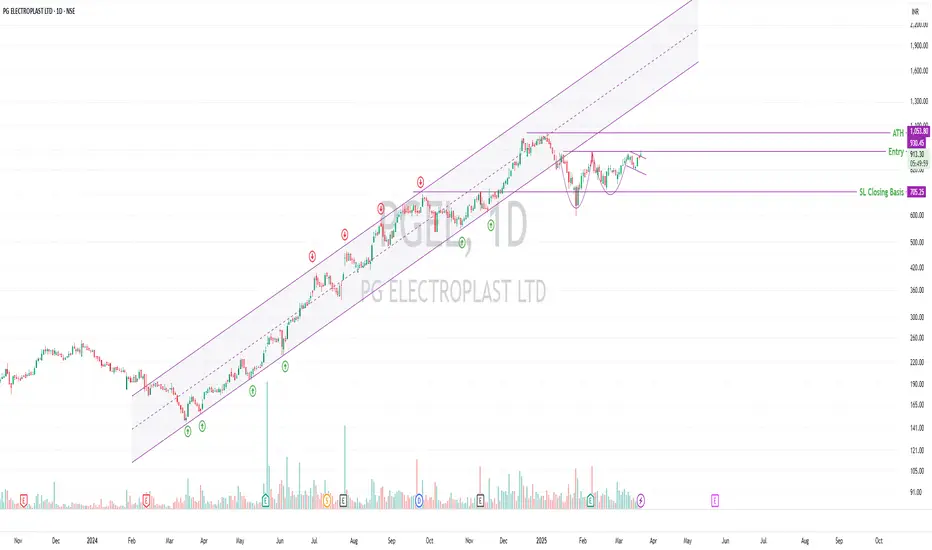
PG ELECTROPLAST LTD (NSE: PGEL):Double Bottom & CNH📈 PG ELECTROPLAST LTD (NSE: PGEL) – Trade Setup & Analysis
🔹 Trend: Stock is in an uptrend, previously a cycle winner. Corrected significantly in the recent market fall but is now recovering and trading close to ATH.
🔹 Technical Highlights:
Trading above key DMAs ✅
Double bottom, VCP, and CNH formation (not textbook-perfect but forming)
Volume missing but RSI improving 📈
Price action near ATH to watch – a high-volume breakout could signal a strong move.
🔹 Key Levels:
Entry: ₹925.70
SL
Tanla Platforms Swing -Double Bottom + CT Breakout with Volumes 📈 Technical Breakdown:
Double Bottom Formation at the base, signaling a potential reversal (though weak).
CT Breakout on the Daily Timeframe (DTF) (White Line).
Higher Timeframe (WTF) Resistance Zones marked by Yellow Lines, acting as hidden reactive resistances.
Massive Volume Spike Today – the highest in recent times, confirming strong breakout momentum.
🎯 Trade Idea:
A clean breakout from the CT with blasting volumes suggests a 1:1 trade opportunity at max for now.
Price might face resistanc
Godrej Properties good to go long
Godrej Properties On Double Bottom + 61.8 Fibo ratio + RSI Diversion (clearly Show on 4 hrs & Daily)
Good to Go long for Positional buy.
Infra Sector is on good move in last 2years - this stock also correct perfectly
i thing this stock will give good returns in Next few months.
Amber Enterprises Breaks Out from Double Bottom – Bullish ViewHello Everyone , i hope you all will be doing good in your life and your trading as well. Today i have brought a trading idea on the double bottom chart pattern. Stock name is Amber Enterprises. So let's start guy's
Amber Enterprises (NSE) has given a strong bullish breakout from a double bottom pattern on the daily chart, indicating a potential trend reversal . The breakout has been accompanied by strong volume , confirming buyers’ dominance at current levels. If the stock sustains above th
Double Bottom - Power Finance Corporation (PFC)PFC is currently in the process of forming a Double Bottom chart pattern at a strong support zone, indicating a potential reversal from a downtrend to an uptrend. The price is testing the support area, and the second bottom confirms strong demand in this region. A key signal for a bullish outlook is the breakout of the minor downtrend line, which suggests a shift in market sentiment from bearish to bullish.
Key Observations:
1. The Double Bottom pattern aligns with the psychological support l
Oil India Double bottom Bullish TradeBuy oil india
Entry- 430
Support- 410
Target- 460 470
Pattern- Double bottom at support and a bullish engulfing candlestick pattern.
Note- It has result tomorrow so Keep this in Mind.
Disclaimer- This is just for educational purpose please take advice from your financial advisor before making any decision.
Jai Shree Ram.
IRB Double Bottom Swing NSE:IRB confirmed a Double Bottom today with RSI Showing Strength and Excellent Q3 FY 24-25 Resluts out today and now looks likely to give a good swing.
F&O Activity:
Significant Long Build-up with 55 PE showing a Significant Increase in OI.
Trade Setup:
Looks like a good double-bottom Formation can give a swing to the previous Double Top and if Crosses 200 DSMA Postionally will look very good
Target(Take Profit):
Upper Resistance Levels of Double Top for Swing Trader. Positional Trade
Coal India. Buy the Dip?Stock: Coal India (COALINDIA)
Current Price: ₹385.05
Technical Analysis:
1⃣ Descending Channel: The stock is trading within a descending channel, forming a base with a potential double-bottom pattern.
2⃣Structure: Lower Lows (LL) and Lower Highs (LH). The overall market structure remains weak.
3⃣200-DMA: Stock is trading below its 200-day moving average, indicating caution for bullish momentum.
Trading Plan:
Entry: Above ₹400.30 on a breakout candle backed by 3x-5x volume.
Stop Lo
Zensar Technologies W pattern Breakout. 🚨 Zensar Technologies Trade Alert 🚨
🔍 Setup at a Glance:
Pattern: W-pattern forming within a trading channel 📈
Breakout Level: ₹840
Support Zones:
Channel support
200 DMA (holding since March 2024)
Trend: Overall uptrend, trading above key DMAs ✅
Volume: 🚀 2x-3x higher than previous sessions today!
RSI: Strong and supportive – signaling momentum.
💡 Trading Plan:
Entry: Above ₹840 (start small; e.g., buy just 10% of your usual quantity).
If the stock closes above ₹840, you can consider
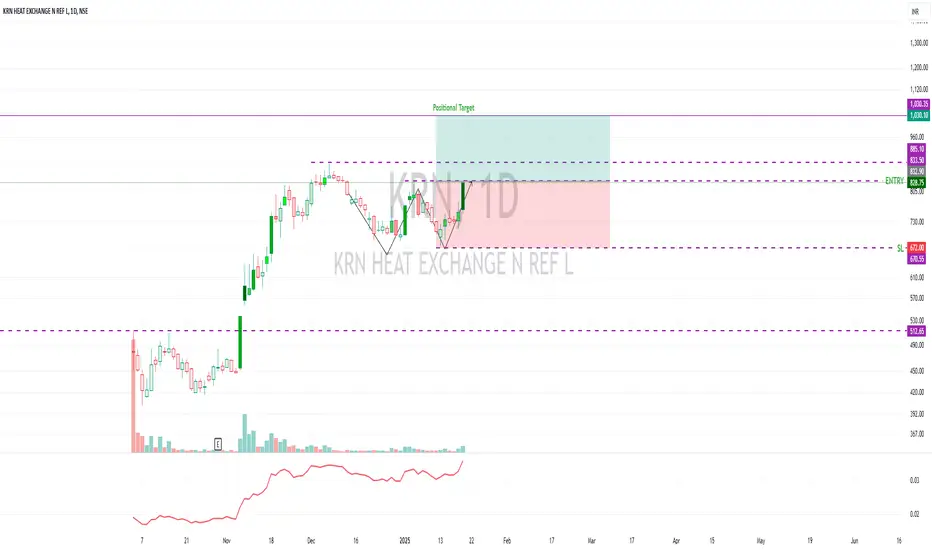
W-Pattern Breakout Alert: KRN Heat Exchanger📊 Setup Overview:
Entry: Above ₹828.75
Stop Loss: ₹670
Target: ₹1030 (Positional)
RR: 1:1.2 (📌 Close to 20% risk, so trade light!)
📈 Technical Highlights:
Bouncing off 30DMA & 50DMA, forming a wide-range candle with strong volumes.
RSI looks bullish.
ATH Resistance: ₹833.5 🚧 — if broken with volume, add more and trail your SL!
💡 Fundamentals:
ROCE: 42.1% | ROE: 41.9% ✅
Market Cap: ₹5153 Cr
PE: 129 😬 vs Sector PE ~32. (Expensive, but growth potential seems priced in.)
Trend: Trading against