IRCON International has formed a double bottomWhat has the international stock done? It has
closed above 50 EMA and has also done a Trendline
breakout and here is also a double bottom. There
is also a bullish divergence in the weekly chart here so
if it breaks the neckline of the double
bottom. So we can think of taking a trade here.
Double Bottom
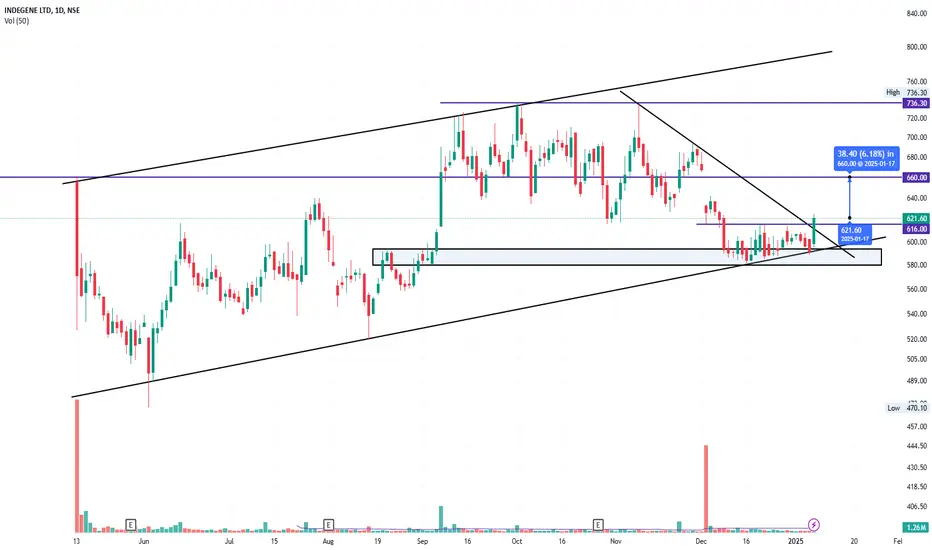
INDGN - 1 Month Consolidation / DowntrendIndegene Ltd
1) Time Frame - Daily.
2) The Stock has been in a Consolidation since (December, 2024) and in a downtrend since (November, 2024). Now, It has given a Consolidation/Downtrend breakout & Closed strong in Daily Time Frame.
3) The stock may find it's next set of resistance around the price (636 and 660) in short term.
4) Recommendation - Strong Buy.
SBICARD Price is at break even levelSBICARD made a like double bottom in daily time frame and the price is currently trading at the neckline of the double bottom. If it breaks the neckline, a momentum setup will be formed here and we will entre on the breakout candle. The stoploss below the breakout candle and target will be Rs 808.
PTC India WBuy in PTC India with a very good risk reward.
Pattern- Double Bottom and A bullish engulfing in Daily TF.
Entry- 148-150
Support/SL- 140-138
Targets- 180, 200, 220
Jai Shree Ram
Disclaimer- This is just for educational purpose please take advice from your financial advisor before making any decision.
Technical Analysis for Bector Food Specialties Ltd. (BECTORFOOD)
Trade Type: Swing trade for 3-12 months
Key Highlights:
Near strong support zone
Double bottom pattern indicating potential reversal
Targets marked based on technical levels
Stop Loss (SL): ₹1499 for risk management
📌 Disclaimer: This analysis is for educational purposes only and not investment advice. Please consult a financial advisor before making any trading decisions.
#BectorFood #TechnicalAnalysis #SwingTrade #DoubleBottom #StockMarket #SupportZone #TradingStrategy #RiskManagement
Sanofi probable trade set upPrice action analysis for Sanofi India (SANOFI) indicates a bearish trend in the short term. The stock is currently trading below its 20-day Simple Moving Average (SMA) and is in the lower range of its Bollinger Bands, suggesting downward momentum. The price has broken a strong support level of 6257, which could lead to further downward movement.
Key price action indicators:
1. The stock is trading near its recent lows, reflecting strong selling pressure.
2. The current price (as of December 2
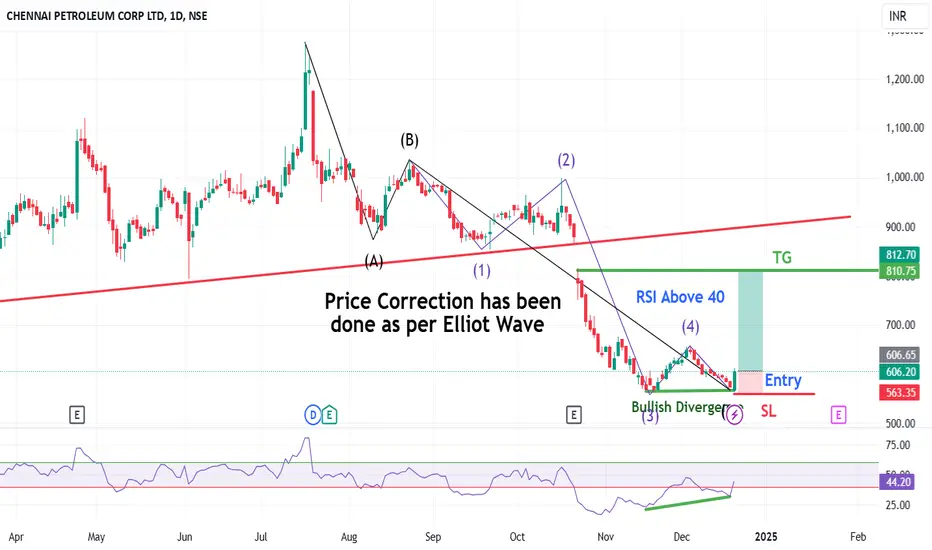
Chennai Petroleum Corp Ltd Stock | Like a Double BottomChennai Petroleum Stock made Elliot web ABC correction and made correction in 12345 period in C wave correction and it is like double bottom at the bottom. So here today bullish divergence is also formed. So Here We Can make entry and Stop Loss can be 559 and entry 590 and target can be 799.
This Trade only education purpose only.
$ETH Bullish Shark Pattern: Key Levels and Potential New ATHCRYPTOCAP:ETH has formed a bullish shark pattern, indicating a potential move towards the $3,850 level initially. Following this, there's a likelihood of a drop to around $3,550, possibly forming a double bottom before rallying to a new all-time high.
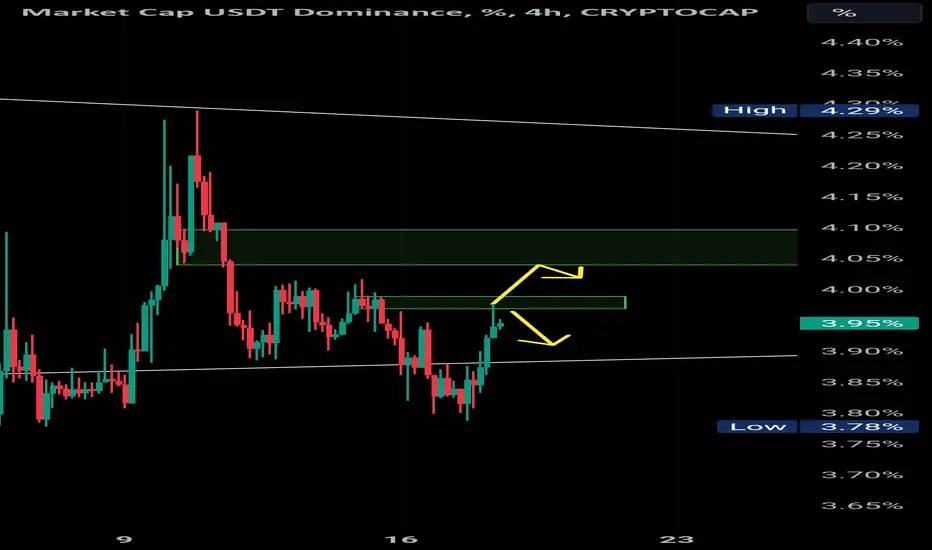
USDT.D BULLISH DIVERGENCE SET TO BLEED BTCCRYPTOCAP:USDT.D has formed a bullish divergence and a clear double bottom with proper higher lows, signaling a potential surge toward the 4% to 4.10% resistance area. This movement could lead to a significant drop in BTC and altcoins, as USDT.D and the crypto market are inversely correlated.
RVNL Forming Good Patterns. Ready for an upmove?RVNL
At a support level and forming multiple patterns. It offers good RR at this level.
- Double Bottom
-Cup & Handle
-Trendline Breakout.
-Candles were narrow right before a breakout and volumes were dry during the pullback.
Positional SL is 13%, If you are an aggressive player then you can place the SL below 428. Adjust the SL and Targets as per your style/appetite.
520 will be a crucial level. Watch the PA there and decide on booking/further addition or fresh entry.
Please consul
Exide Double bottom An early bullish entry in Exide.
Pattern- Double bottom ( Note it's an early entry pattern has not completely formed)
Entry- 449 450 levels
SL- 447-448
Target- 455 458
Note- Risky trade.
Disclaimer - This is just for educational purpose please take advice from your financial advisor before making any decision.
USDT.D DOUBLE BOTTOM & BULLISH DIVERGENCE , POSSIBLE RETEST 4.7%#USDT dominance ( CRYPTOCAP:USDT.D ) has formed a double bottom on the higher timeframe, aligning with another double bottom visible on the daily timeframe. The RSI is showing a clear bullish divergence, further strengthening the probability of a retest toward the 4.7% resistance area from the current 4% level. Looks bear in BTC & altcoins go short correction.
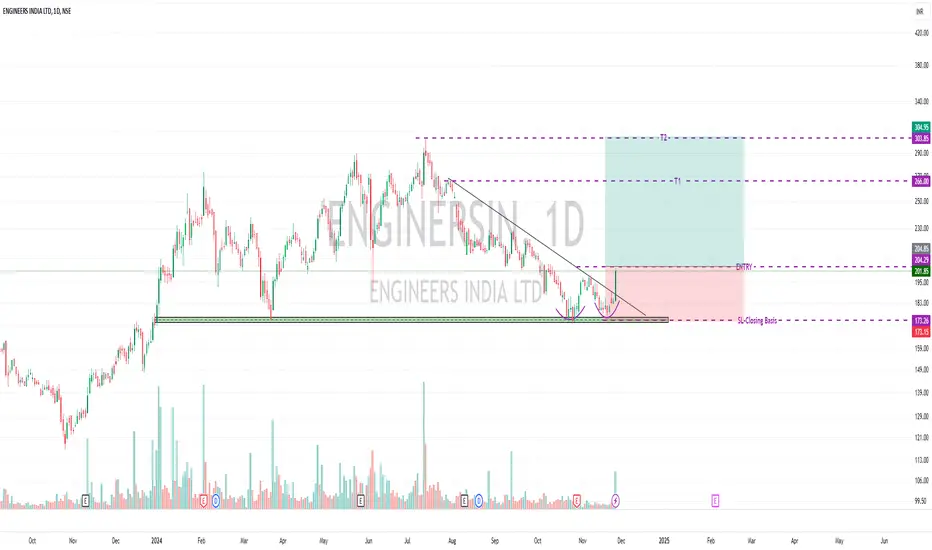
Engineers India offers good RR from this price level. -Good RR setup.
-Bouncing from a support level with Volume.
-Formed a bullish engulfing candle.
-Broke out of Trendline.
-Double Bottom at support level.
Overall, it's good for a swing.
This is not a Buy/Sell Recommendation. Please do your due diligence.
Risk- 15.4%
Reward: 29.8%
RR- 1:1.9
ADFFOODS - Double Bottom Pattern Breakout on Daily ChartADFFOODS - Double Bottom Pattern Breakout on Daily Chart
After giving a good rounding bottom base breakout, the stock is moving up by forming some patterns like Darvas Box pattern and Double bottom pattern.
Currently, it has give a double bottom breakout with massive volume indicating more possible upsides.
MATRIMONY - Ready for BreakoutMATRIMONY - Matrimony.com Ltd shows a promising technical setup with signs of a potential bullish move, given certain conditions are met.
Here’s a detailed analysis:
103-Week Downtrend and Consolidation: The chart indicates a prolonged downtrend lasting about 103 weeks, followed by a consolidation phase of similar length. This long consolidation after a downtrend typically signifies accumulation, where sellers lose strength and buyers start gaining control.
Double Bottom Pattern: A double
Vedl- Bullish from short term to very long termVedanta- First sign of bullishness shown after two months of fall. Always the lower timeframes indicates the change in trend. So lets start from the smaller timeframes.
1. 15 mins- Low to high and higher low is the first indicator of the bullish trend which can be seen now. Higher high and higher low is not formed clearly still as they are almost at the same level to their previous highs and lows.
1 hour- Formed double bottom because of the same levels of previous highs and lows in the 15 min ti