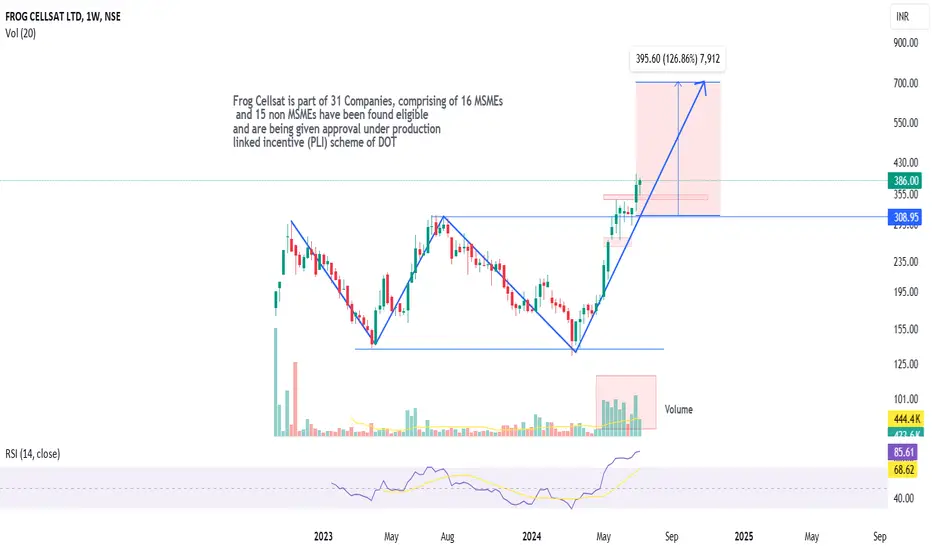
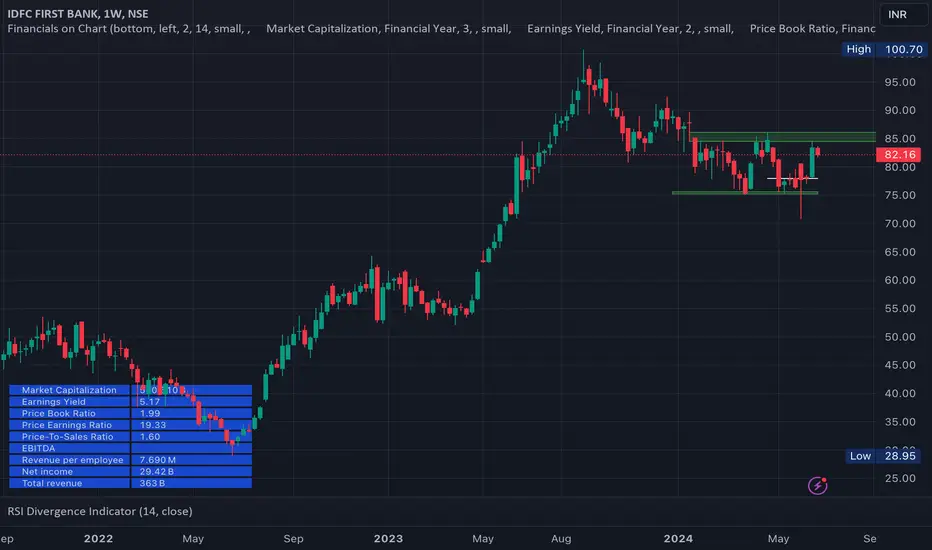
Frog Cellsat - Strong Fundamentals and Technicals.-> The company has shown a good profit growth of 151.97% for the Past 3 years.
-> The company has shown a good revenue growth of 15.20% for the Past 3 years.
-> The company has significantly decreased its debt by 6.08 Cr.
-> Company has been maintaining healthy ROCE of 25.02% over the past 3 years.
-> Company is virtually debt free.
-> Company has a healthy Interest coverage ratio of 30.48.
-> The company has an efficient Cash Conversion Cycle of 60.53 days.
-> Company has a healthy liquidity po
Double Bottom
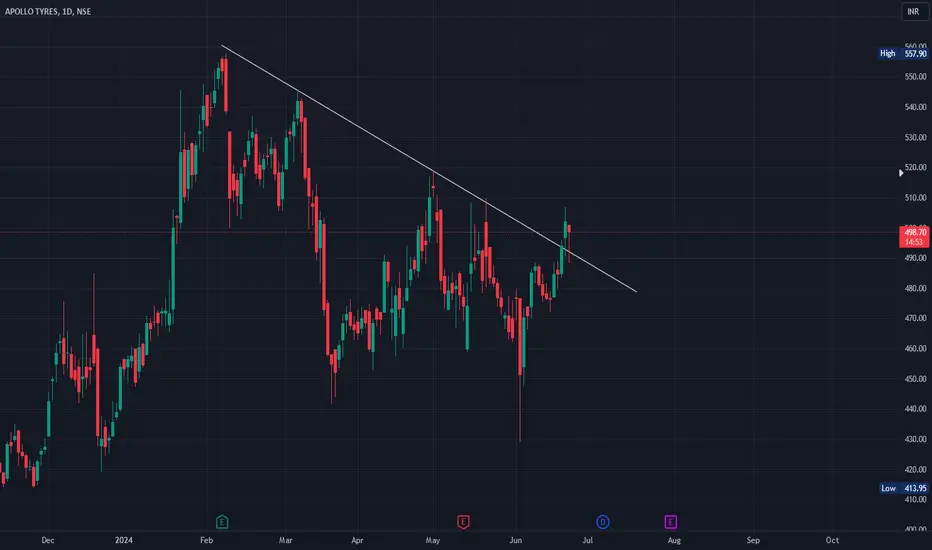
Publishing my 50th idea on this platform. NSE:APOLLOTYRE broke out of falling trendline resistance yesterday and re-tested today. Expecting some good moves here for July expiry. Seems like it will not take much to break above the base for a double bottom breakout 520+ level. It should have closed in green today but it did not so may take some time as well before the big breakout.
Dalmia Bharat - Double Bottom Chart PatternThe "Double Bottom" pattern is a bullish reversal chart pattern that suggests the end of a downtrend and the beginning of an uptrend. When observed in Dalmia Bharat's stock chart, this pattern indicates a potential increase in the stock's price. It took almost 2 months to complete the pattern.
Key Characteristics:
Shape: The pattern consists of two distinct troughs at approximately the same price level 1700, resembling a "W" shape.
Neckline: The highest point between the two bottoms forms the
BALMLAWRIE BREAKOUT (6 year range breakout)Balmer Lawrie & Company Ltd is extremely bullish with rising volume as visible form the chart .
The financials of the company are pretty solid as well :
1. Rising PE
2. Increasing sales
3. increasing net profit
4. rising EPS
Along with all this the company also gives pretty solid dividend as well.
It is the stock to watch out for🚀🚀.
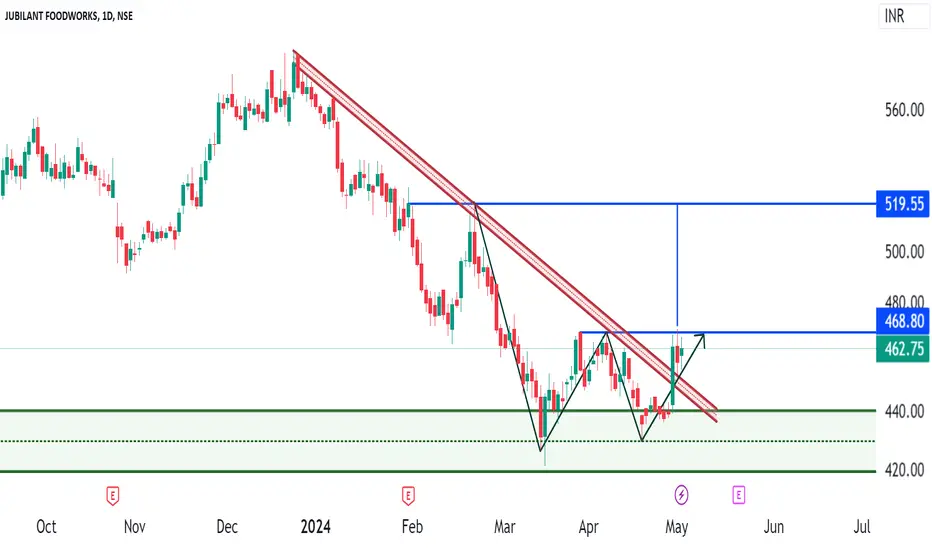
JUBLFOOD formation of Double BottomDouble bottom chart pattern formed in JUBLFOOD and pattern will active only after break and close above 470.
It is also important to note that JUBLFOOD is bounced back from prior support level with formation of bullish candlestick called Hammer.
Price is also pierced the downtrend line and currently price is consolidating near neckline.
We have also found inside bar pattern near the neckline, if upside breakout is sustained then we can get sharp up move or else pattern will be invalid.
Gravita-A support reversal you shouldn't miss!Gravita is looking strong to retest ATH levels soon.
Stock had given breakdown from trendline support which was a bear trap.
Stock formed double bottom near support and today gave a huge volume move.
If broader markets support, this stock can make new ATH!!
TITAN FOR TARGET 3570Titan Company Limited is an Indian company that mainly manufactures fashion accessories such as jewellery, watches and eyewear. Part of the Tata Group and started as a joint venture with TIDCO, the company has its corporate headquarters in Electronic City, Bangalore, and registered office in Hosur, Tamil Nadu.
Now i am considered titan for bottom fishing. i am expecting a good move in titan for 3/4 %.
CMP : 3458
SL : 3360
TARGET : 3570
Note :This is not stock recommendation this only for educat
ELECTROSTEEL CAST - W formation! Overview & Observation:
1. Beautiful Double bottom formation.
2. Prices are showing weakness currently.
3. Might see some strength build up later once it starts moving ATH (200 levels)
Trade Plan:
1. Just keeping it on my radar and will observe its price behaviour in coming weeks...
- Stay tuned for further insights, updates and trade safely!
- If you liked the analysis, don't forget to leave a comment and boost the post. Happy trading!
Disclaimer: This is NOT a buy/sell recommendation.
EQUITAS SMALL FIN BANK - Picture perfect 'W' setup w/ 40% upsideOverview & Observation:
1. Double-bottom formations.
2. Moving with W Demand.
3. EMAs support taken confirming the up trend momentum.
4. RRR is favourable
Trade Plan:
1. Entry = Marked blue line
2. SL = 6-7% Marked red line
3. TP = 40% Marked green line
- Stay tuned for further insights, updates and trade safely!
- If you liked the analysis, don't forget to leave a comment and boost the post. Happy trading!
Disclaimer: This is NOT a buy/sell recommendation. This post is meant for learnin
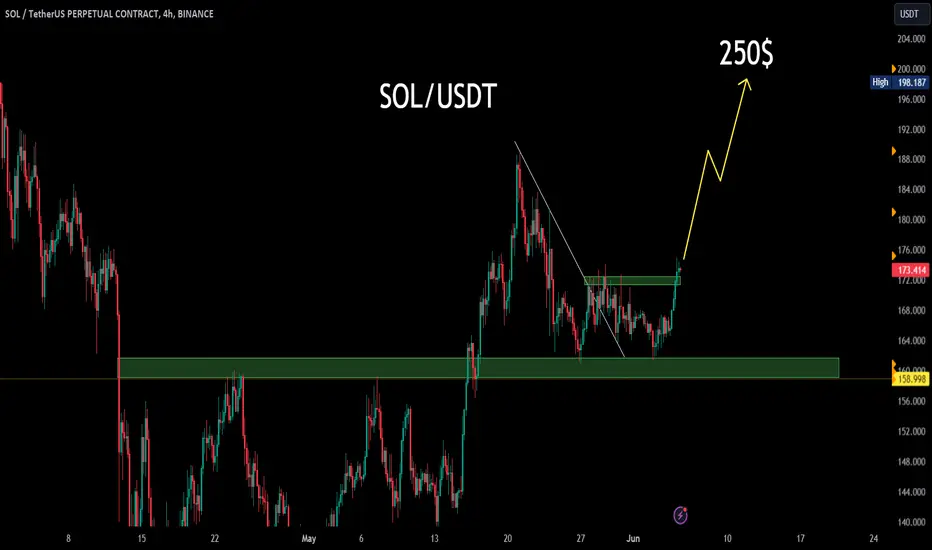
#SOL/USDT Bullish Momentum: Eyes on the $250 Target#SOL/USDT Double Bottom Formation and $160 Support Retest: Eyes on $250 Target
In the recent price action of SOL/USDT, Solana has formed a classic double bottom pattern, signaling a potential bullish reversal. This pattern, often indicative of a shift from a downtrend to an uptrend, is characterized by two distinct lows at approximately the same level, forming a 'W' shape on the chart. The key support level at $160 has been successfully retested, further validating the double bottom formation a
#BTC's Bullish Pattern: Double Bottom Sets Target at $64k! 📈#BTC/USDT forming a double bottom, bouncing from an important trend line, and making a bullish divergence, with a potential liquidity grab around $74k:
---
**Title: #BTC/USDT Double Bottom Formation with Bullish Divergence: Targeting $74k**
**Description:**
**#BTC/USDT Analysis**
**Pattern Formation:**
Bitcoin (BTC/USDT) has recently formed a classic double bottom pattern, a strong bullish reversal signal indicating that the downtrend might be coming to an end.
**Trend Line Support:**
The
Hindware-Looking strong for a big uptrend!Hindware has formed a double bottom pattern at a very strong support trendline and has given breakout of the neckline.
If Q4 results are better then expected, we can see a good trending bullish move in the stock.
Keep in watchlist. A relatively Safe trade as big targets can be expected.
Time to get IDEATelecom stocks are positive for long term and Vi is now preparing for turnaround with 5G rollout. Management has done everything they can to ensure things change for the company. It is finally breaking above its previous high. A double bottom breakout is on screen. Waiting for some pullback to enter this.
SBIN DOUBLE BOTTOM CONFIRMATIONState Bank of India (SBI) an Indian multinational public sector bank and financial service ready for big rally.
In recent quarter we saw a tremendous growth in banks financial statements and we got confirmation on chart that stock is ready for Rally.
In past few weeks we do see stock form double bottom pattern on weekly basis.
CMP : 820
SL : 760
T1 : 880
Note : This is only for educational purpose
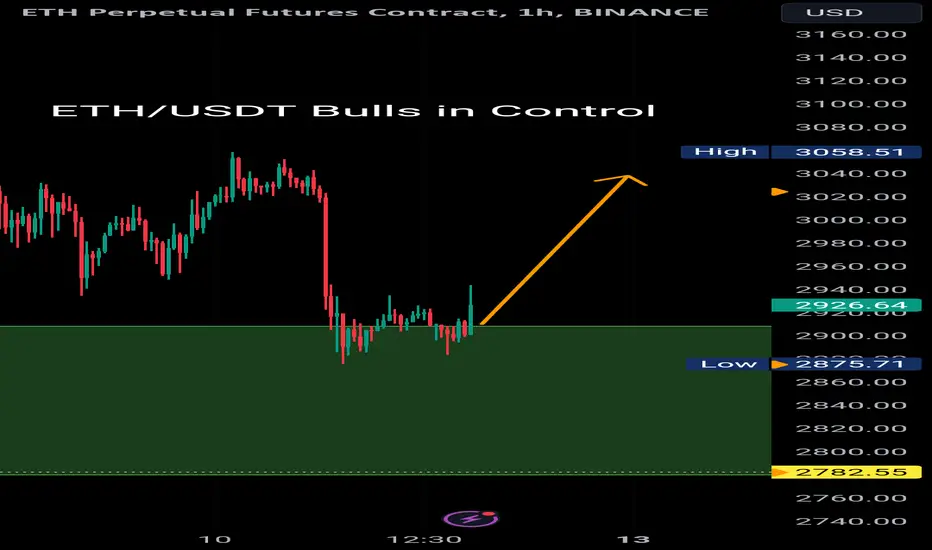
#ETH/USDT Bulls in Control#ETH/USDT pair has recently formed a double bottom pattern, finding significant support within a crucial trend box area. This pattern suggests a potential reversal of the previous downtrend and signifies a bullish sentiment in the market. With the double bottom formation in place, Ethereum is likely to experience upward momentum, aiming to retest the $3000 resistance level. Traders and investors are closely monitoring this development, anticipating a continuation of the bullish trend as Ethereum
#BTC/USDT Rebound Sparks Optimism#BTC/USDT has recently shown promising signs of a potential relief rally, supported by the formation of a double bottom pattern and bullish divergence. A double bottom typically indicates a reversal pattern, suggesting that selling pressure may have exhausted and buyers are stepping in. Concurrently, bullish divergence, where price forms lower lows while the indicator (like RSI) forms higher lows, signals weakening bearish momentum and a possible trend reversal.
This combination of technical in
#SOL/USDT Surges After Retesting 0.5 Fibonacci LevelThat sounds like a bullish scenario for #SOL/USDT! Here's a description you could use:
"#SOL/USDT has recently formed a double bottom pattern on the 1-hour time frame, coinciding with a bullish divergence, indicating a potential trend reversal. The price has also formed a double bottom pattern on a larger time frame, further confirming the bullish bias.
The next significant resistance level for SOL/USDT is around $160. If the price manages to break above this level, we could see a continuation
#ETH/USDT Rebounds Strongly: Golden Ratio at Play#ETH/USDT has formed a double bottom pattern and is currently bouncing from the golden ratio (0.618 Fibonacci retracement level), indicating a strong support level. The next significant resistance level is around $3350. If Ethereum manages to break above this resistance, we could see a further upward movement towards the $4000 mark.
The double bottom pattern is a bullish reversal pattern, suggesting that the price could continue to rise after a period of consolidation or decline. The bounce fro