Best Buy & Profit Area for Ethereum next major moves Best Buy & Profit Area for Ethereum next major moves Longby cryptoinsiderTA15
Federal Bank Analysis This is more like looking at charts and trying to find out patterns whom can this help Investors - what should be there SL in Federal Bank - exit at 66 and re-enter at 41 Technical Analyst - one more analysis - always good to see perspectives :) isn't it Traders - Not exactly - but they may want to set an Alert for Monthly closing below 66 or above 87 for major moves Hypothesis Looking at charts, it seems there is a strong magnetic support/resistance at 40.5 price. It by msk_analysisUpdated 11
As Per ADX how Bitcoin will reactAs per ADX chart their is a possibilities of reversal from current level is very much due...Longby cryptoinsiderTA16
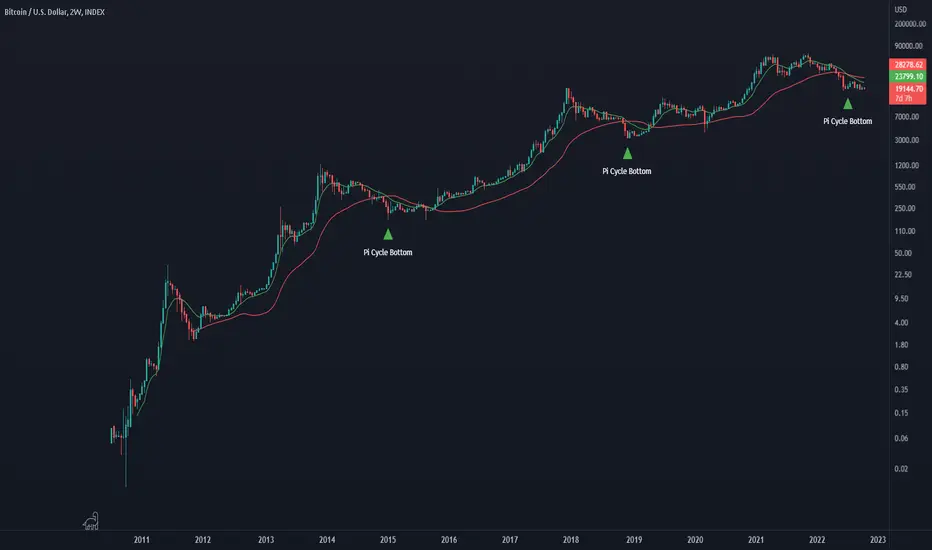
Another Reason to get BullishAnother reason to get bullish at current level... which is so far 100% correct as per Pi Cycle Bottom Indicator.Longby cryptoinsiderTA8
What Bitcoin Logarithmic chart suggest about Bitcoin LevelWhat Bitcoin Logarithmic chart suggest about Bitcoin Level.Longby cryptoinsiderTA9
Why current level is Best Buying ZoneWhy current level is Best Buying Zone as per SMMA indicator which is accurate so far 100% time.Longby cryptoinsiderTA0
Bitcoin Cycle- Feb RetracementBitcoin Cycle- Feb Retracement : Why Current Level of Bitcoin is best Accumulation zone, if you compare it with previous cycle and if previous move repeat what could be max pain & best investment point as per support & resistance level.Longby cryptoinsiderTA0
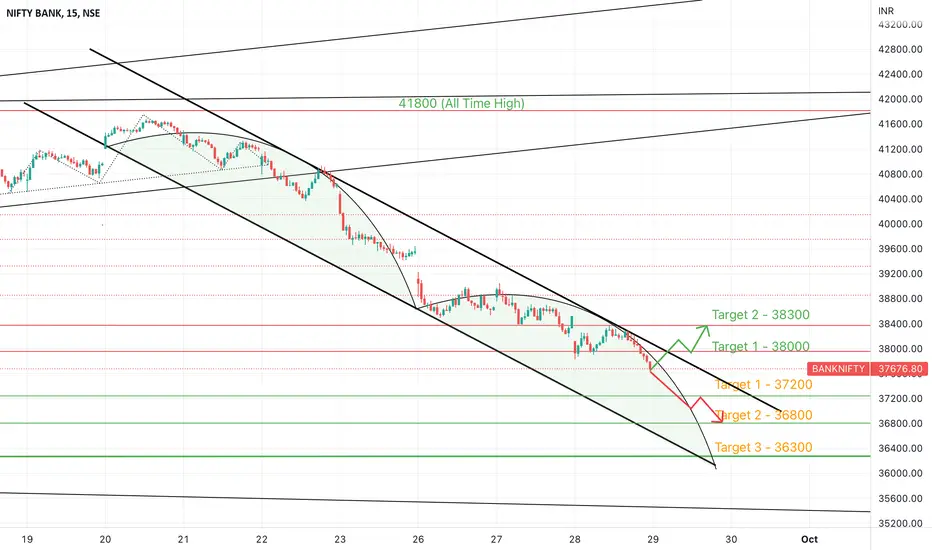
BNF will continue to fall ?Hello All, Please refer my previous related idea where it touched the 37700. We are seeing continuous selling but at some point it has to breath and decides next movement. Market has been ending negative even if start with good momentum. Falling channel with 2 Arcs or cycles where I have just plotted the second arc by cloning first one. If downside momentum continues we can see the exact replica which will end at 36300. FII has sold 2700 cr and DII has bought for 2500 cr. Please find the leShortby tmvinoth30
💎 PAYTM : 315% Profit Potential in Next 8 Months💣💣💣💣Finally After lots Criticism and Uncertainty Paytm has started it Bull run. I believe tht the major drop on paytm stock was done intentionally. First time Paytm Discovered Strong Demand Zone at 530rs Area. Right now no one is talking abt this Gem, This is Perfect time to fill the bags silently and HOLD strong. I am Expecting more than 300% returns in this Historic Upcoming rally. Longby Rohit_ShindeUpdated 24
BANK NIFTY Analysis / Observation 40000NSE:BANKNIFTY I strongly believe this is not a breakout , and might be a fake one as NIFTY HASN’T BROKEOUT YET If NIFTY BANK breaks and closes above the parallel channel, then i may re-think about my analysis Here’s a link to my previous Analysis I’m still thinking it may play out, keeping in mind of foreign markets. Watch for breakout and close above the parallel channel and invalidation of H&S. Share if you like it PS: THOSE IS FOR EDUCATIONAL PURPOSE ONLYby indanorth27
VARROC BULLISHVARROC ENGINEERING STOCK is consolidating since past 4 months and currently it is near its resistance if candle sustains above it with good volume you can go long after doing your own analysis. Targets, SL, Entry points has been given in the charts. If took trade please do money management. ONLY FOR EDUCATIOINAL PURPOSE..!Longby tusharshahane2
THE 19 DATE19 date this year has been soo important as we can see the highs lows or the reversal have occurred on these dates... its a complete W.D.gann's analysis the dates on chart i mentioned will play an iconic role in nifty NSE:NIFTYShortby last_leg_of_bullrun137
monday gap downmy time machine says 'a big crash is going to come in September' as i was been warning in my previous ideas NSE:NIFTYShortby last_leg_of_bullrun6
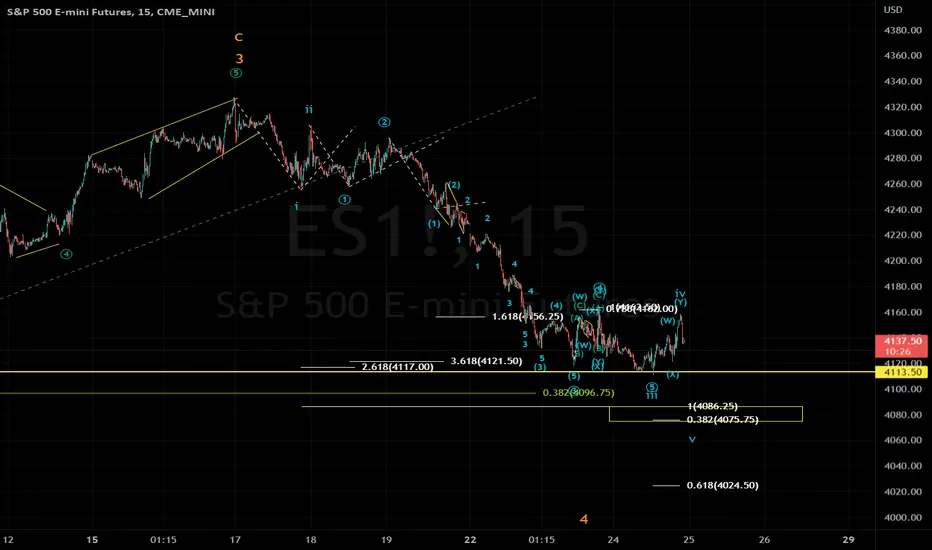
ES is in its final leg to bottom out around 4085-4075The S&P is in its 5th wave from the high of 4327, nearing the confluence target area of 4085-4075. Ideally wait till the entire 5th wave is complete (all the subwaves) and wait for a reversal to take a low risk entry. Targets can be the mid 4200s. New idea will be updated thereLongby no_aha211
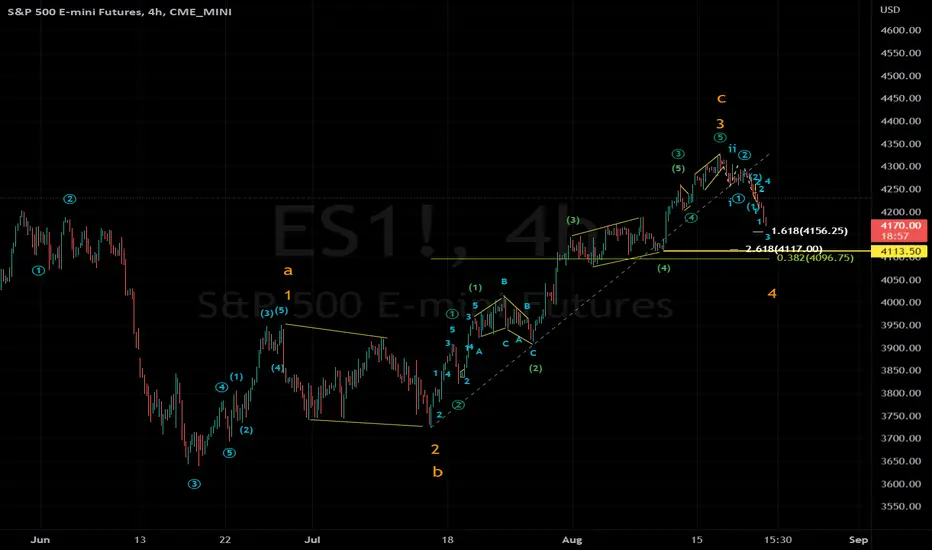
ES emini wave analysis from 3693 lowThis whole rise has from 3693 low (yes, not the actual low at 3639. Refer: wave 5 truncation) has been a 3 wave move so far. Wave 1/A has been a clear 5 wave followed by an extended 3/C wave with the iii of 3 extension. The 3/C wave ended with wave 5 as an ending diagonal. Now, the fall from the absolute high of 4327 has been impulsive so far with a series of 1-2-i-ii. The first target post a completion of 5 waves up is the range of the 4th wave of lower degree. This comes at 4113-4080. This Shortby no_aha5
Closer look at wave counts from 17180 to 18000Continuation of previous idea where the entire upmove is an ABC. Zoomed in picture of wave counts of the final leg, leading to initial target area of prior 4th wave i.e. 17450-17180.Shortby no_aha0
Nifty wave counts from 15183This is one of the rare case where a 3 wave move up has a C wave extension greater than the regular 1.382/1.618. In super-extended moves, we have seen C Waves extend to 2.0 and even 2.618 of wave A. What determines the future move is the speed of reversal post completion of Wave C/3. Another supporting evidence for it being a wave C and not wave 3 is that the initial moves prior to wave C was a clean Wave A i.e. a 3 wave move contained withing parallel lines, whose subwaves tended to equalitShortby no_aha0
CNXPHARMA Breakout in Nifty Pharma. SunPharma , DivsLab , Dr Reddy Looking Very Good Longby mahajankushal28041
Nifty Where does this heading July Contract Still Nifty showing corrective structure and we would be forced to change the view above 16200 levels. Nifty retracing before its next fall. Nifty will be completing 61.8 retracement at 16116. If this area holds then we can expect a deeper fall towards 15200 and Below.Shortby Eatsleeprepeat0
is BANKNIFTY ready for more.?BANKNIFTY did exactly as we analysed and has also successfully filled the gap taking the neckline as support now we can see BANKNIFTY resisting at 34400 as the gap has been filled and is an important closing hence if BANKNIFTY opens flat to negative we might see a good downside movement on the other hand if opens strong we might see 34400 acting as a good support and continuing its bull run by Kaushalfin2
BTC Blood Path !!! But where is the BOTTOM ???Good day to everyone! BTC enters the BOTTOM zone which is between 16-22k. Best buy zone is 16-18k . We may rally to the resistance zone 48-50k after few months of bottom consolidation (July - October), and then continues the Bull Run breaking ATH. Get ready for the next Bull Cycle.. ~RPS Longby stralines0
nifty Nifty 50 support seems from 14890 for up move upto 18500. NSE:NIFTYby BuySellTamizhaUpdated 711
Oil price historical high prediction Currently downtrend trend line break and waiting for the reversal If the price reach above 109 first target will be 125 and 2 target 148 by rajkumar_3330
Important SUPPORT is still securedAs we analysed yesterday that the opening is very important and any flat to positive openeing could show strong upmove and we did saw that today but that upmove couldn’t sustain any longer and fell in the second half but still closed above our given support! this shows the same scenario as yesterday and same setup can be implied but continuous hitting on support is making rhe level weaker and hence as soon as the level is broken we can go short as this level will later act as resistance and one by Kaushalfin1
 LongLong
 LongLongLongLongLong
 Short
Short Long
Long Long
Long ShortShort
 LongShort
 ShortShort
 LongShortLong