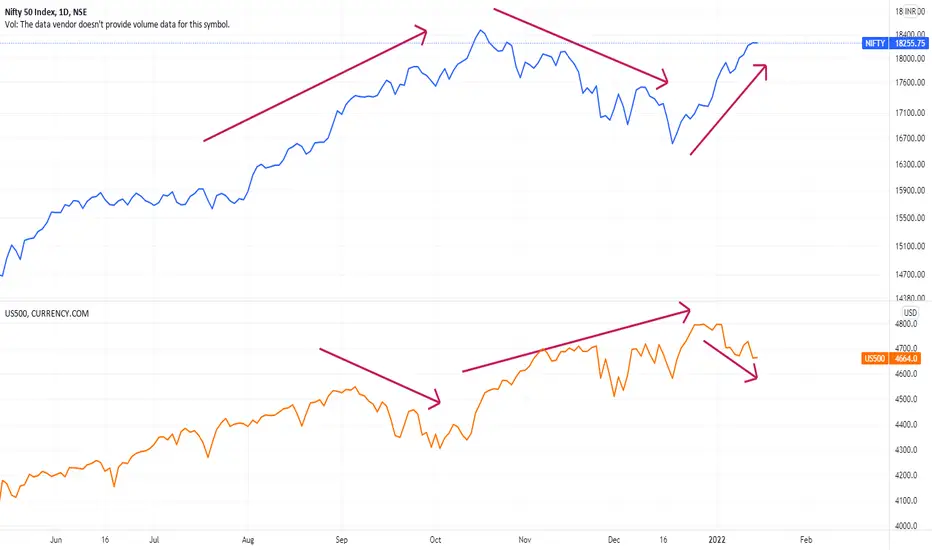
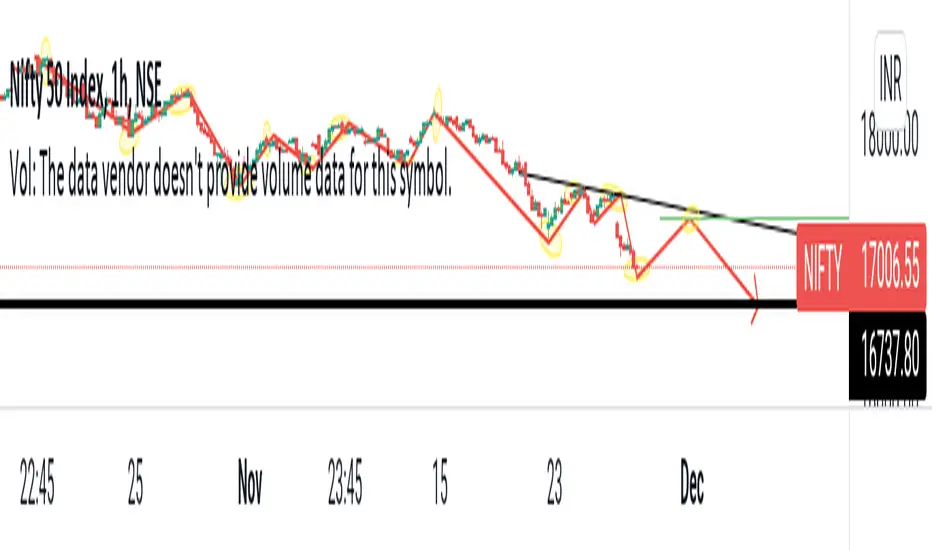
Signals Change view do NotThe hourly Rohits momentum indicator gave abuy signal that failed and flipped back to sell, which allows for risk management by traders but that does not change the Elliott Wave view that we are in wave II. That requires deeper thinking and observations. The only alternate is wave 5 was truncated and the recent top ended an 18-month bull phase. Time will tell which is right.
Economic Cycles
Market Cycles – Market Phases and Different TypesTypes of Market Phases
There are 4 clear market phases, and all markets go through these phases in a repeated way:
All markets go through 4 clear phases in a repeated way:
1.Accumulation Phase
This phase occurs after the market has bottomed and early adopters begin to buy, figuring the worst is over. At this phase, valuations are very attractive, and general market sentiment is still bearish. Overall market sentiment begins to switch from negative to neutral.
The end of an accumulation phase
Short Infy 1874 Absolute TOP - RISK REWARD RATIO 1:5Nifty IT is overhyped and euphoric , as it was there in Nifty . Short Infy as it is one of the leader of IT sector after TCS .This will play role in falling of Nifty IT.
Note : This suggestion is Data Backed from Stock Data Science . You can take positions after consulting your Financial Advisor . Please manage your risk accordingly.
Combining Time cycle+Channel+Candle-stickI tried putting Elliot wave label on Asian paint daily,weekly and monthly chart and couldn't come to any logical conclusion,as the uptrend didnt followed any fib rule's neither did any major swing have an internal structure similar to elliot pattern cumulatively which could make an elliot pattern.
Never the less i have shown channel on the monthly chart which seems to be acting as good support and rasistance and as an investor who likes safety and decent return and who does research on it's own
GNA AXELS : Wave counts + Time cycleIn this post i have tried analyzing chart by combining both price/volumes and time factor simultaneously. For deciding trend and predicting price i have used Elliot wave theory and for timing and entry/exit i have used cycle theory.
Elliot wave theory Impulse wave rule:
1)Wave 2 can't retrace wave 1 entirely
2)Wave 3 can't be shortest of wave 1,3 and 5
3)Wave 4 can't enter wave 1 price action zone.
Time rules of Neo wave (Extention of Elliot wave)
1)Wave 2 takes equal or more time then wave 1
Hindalco-Neo wave count Current pattern: WXY double correction
Both correction have taken Bow-Tie diametric form(7 leg pattern,Expansion in first 3 leg and compression in last 3 leg).
Right now it seems like second correction is done and current fall can be wave X or wave 1(star of new impulse on the downside)
Shown horizontal dashed lines are retracement(23,38,50,62) levels of second correction.
Notice through out this up move price has taken support of lower channel which it seems like will be broken in current
APL APOLLO ON Rising Cyclical UpsideAPL APOLLO ON Rising Cyclical Upside . Change of Polarity , Taken Support and Started Heading Upside With Increase in Volume .MACD is About To Give Bullish Cross Over and RSI Rising . What Else You Ask For .. Strong Bet With Targets 1000 in Short Time . Enjoy The Ride >>>
M&M hints at a wave extentionM&M stock formed a 5 wave advance but as prices go past the high of 895. Then we get an extension. A situation where 5 waves can convert into 9 waves and that means adding 4 more waves to the rally. This means recalibrating the wave count and coming up with Fibonacci extensions to project the size of the extended wave on the upside. That is where M&M is this morning as Auto stocks continue to rise.