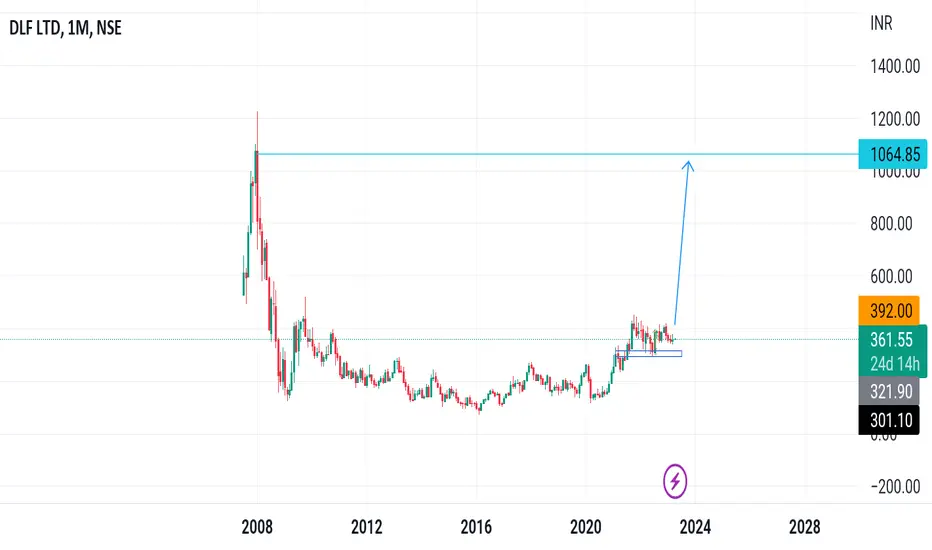
Economic Cycles
DONEAR - Retest + Reversal with a breakout - Swing Trade
The analysis is done on Daily + Weekly TF hence price may take few weeks to few months in order to reach the targets.
Checkout the weekly chart as well here -
Trade setup is explained in image itself.
The above analysis is purely for educational purpose. Traders must do their own study & follow risk management before entering into any trade
Checkout my other ideas to understand how one can earn from stock markets with simple trade setups. Feel Free to comment below this or connect with
BALRAMCHINBALRAMCHIN:- Double bottom pattern is formed, wait for breakout of neckline, till then keep an eye on the stock
Hello traders,
As always, simple and neat charts so everyone can understand and not make it too complicated.
rest details mentioned in the chart.
will be posting more such ideas like this. Until that, like share and follow :)
check my other ideas to get to know about all the successful trades based on price action.
Thanks,
Ajay.
keep learning and keep earning.
#Nifty #fallingwedge on hourly chartsNifty on hourly timeframe is showing a falling wedge formation with double bottom placed at the bottom of the falling wedge channel and also a very important support placed around 16800-16850 support zone band.
20 DEMA is placed around 17400 currently and as that acts a magnet, it can't be ruled out that price is going to a move around that.
This zone is also currently coinciding with the around 50 to 61.8% pullback zone of fall from 17800 to 16830 levels.
Price is also showing a consolidatio
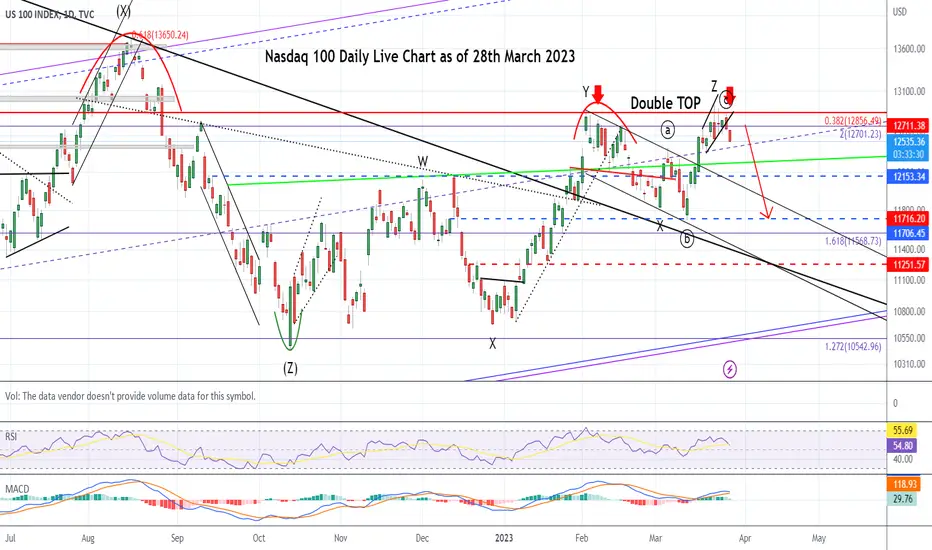
Nasdaq 100- Double TOP!Attached: Nasdaq 100 Daily Live Price Chart as of 28th March 2023
Pretty Straightforward Chart:
- Price rejects for the 2nd time at 0.382 Fib, this is a Double TOP Sell Signal
- Elliot Wave Count shows Corrective Bounce complete in form of WXYXZ with C wave of Z being an Ending Expanding Diagonal
- Price puts in a Higher High but RSI puts in a Lower High, aka Divergence
Holding below the round figure level of 13000,
the Nasdaq (NDQ) is a SHORT
for a Downside Target= 11700 & below...
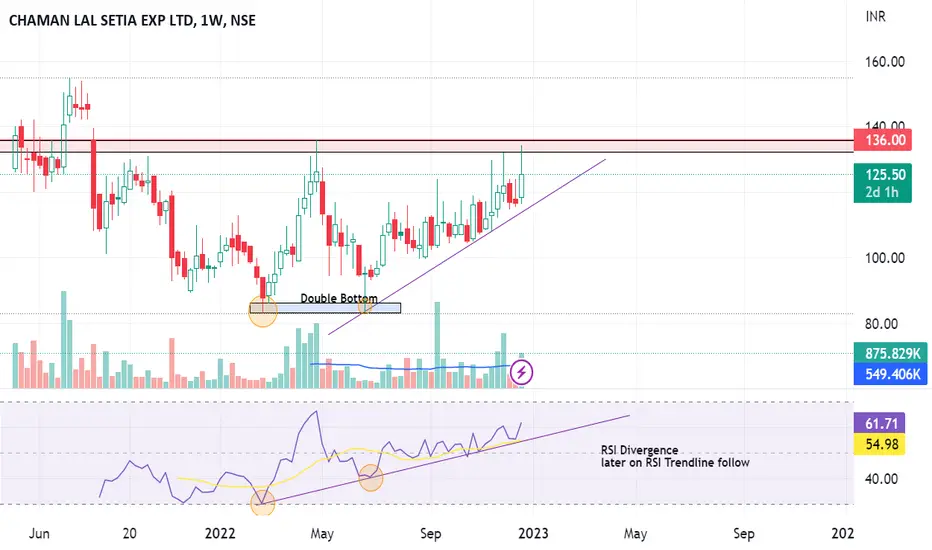
A potential multi-bagger stock (3)After PSU BANKS and sugar stocks rally
Its potentially turn for rice stocks and Railway stocks now
One can consider
NSE:CLSEL
CMP-122
Buy above-137 on closing basis
TARGET- 155 then ATH+
Stop loss- Breakdown of trendline with below 107
RSI Divergence observed
with RSI Trendline formation too
NOTE: Stock represents chart pattern similar as shown by GRM Overseas
So one can keep accumulation the stock on dips if possible
" JUST AN IDEA SO KEEP YOUR RISKS AND REWARDS IN MINDS BEFORE IN
Trade Idea on SRF with Bird Eye View and Notes Following is the bird-eye view of SRF point-wise:
1 and 2) I see two patterns here on a Weekly time frame; 1 is a parallel channel, and 2 is a symmetrical triangle
( Note: Both can be bullish or bearish patterns depending on their previous more significant wave, here it was bullish )
( Note 2: Currently sitting at the support of bottom parallel channel making a W pattern and sitting at bottom support of symmetrical pattern too )
3) It's a Fibonacci extension, made for the consolidation zone
SBI Life Double Bottom RSI Divergence SBI Life has formed double bottom pattern on daily chart. while the RSI is making higher lows which is sign of RSI Bullish Divergence.
Entry:
We can go long after close of strong bullish candle near support zone.
Stoploss:
We can keep stoploss below the support zone.
Target:
We can keep target near the next resistance zone which will be also the neckline of W pattern in future, as marked on chart.
Please Like and Follow me.
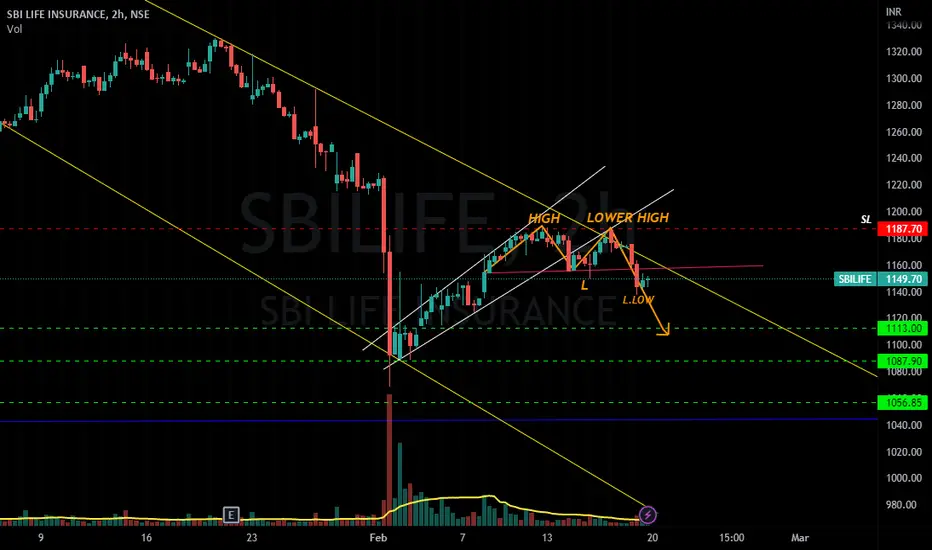
SBILIFE Double top Breakdown ??!!!Chart pattern look interesting for a short trade
Reasons
1. SBILIFE travelling in a Descending channel pattern ( hourly time frame)
2. Now, it has formed a DOUBLETOP pattern (with a perfect High & Lower High as the two tops )
3. Lower low too formed on Friday, increasing our probability and thus Breakdown!!!
4. SL & Target levels mentioned @ chart as horizontal dashed lines(red & green)
5. 2 hr candle escaping out of the channel(yellow) can be less risky SL.
6. On 15th Feb(wed), Sbil
intradaywe can buy on support zone or we can sell in breakout depend on the candle
both side potential
avoid first 15min breakout
wait for 15 min candle closing
targets are marked
if the breakout comes after 10:00 am then the probability of winning will be more.
follow risk management
do your own analysis
do workout
do meditation
start reading books
P
ASIANPAINT IN BEARS BRUSH ???!!!Chart does insist me the above titled opinion
Reasons
In Monthly timeframe, Asian paints looks like, is in formation of a DOUBLE TOP!!! ( Making HIGH(Jan 2022)and LOWER HIGH(Sep 2022) respectively)
(shown as image attached in the chart)
1. Asian paints has been travelling in Ascending channel pattern(red and green) taking support at respective levels from 2019.
2. Now currently its is in the down swing in a descending channel(white trendlines).
3. January 2023 Monthly candle - going t
Bajaj Finance Swing TradeDouble Bottom Pattern is formed on daily chart while the RSI is making higher lows which is sign of RSI Bullish Divergence . We can take a swing trade here.
Entry:
We can go long after close of strong bullish candle near the support zone .
Target:
We can keep the target near the resistance zone which will be also the neckline of W pattern as marked on chart.
Stoploss:
We can keep stoploss below the double bottom support zone .
Please like & follow me.
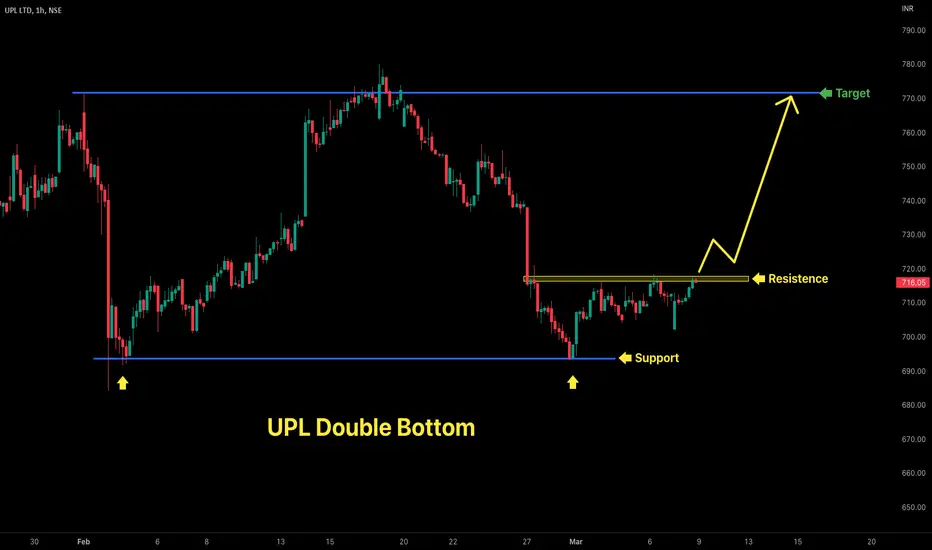
UPL Swing TradeUPL has formed Double Bottom Pattern. Which is a bullish pattern and it may form W pattern. So we can take swing trade here.
Entry:
We can go long when price gives breakout above the resistance zone with strong bullish candle.
Target:
We can keep target near the next resistance which will be also the neckline of W pattern as marked on chart.
Stoploss:
We can keep stoploss below the resistance zone.
Please Like and Follow me.
HDFC Life Double Bottom RSI DivergencePrice has formed a double pattern on daily chart. while the RSI is making higher lows which is clear sign of RSI Bullish Divergence. We can take long trade.
Entry
We can go long on open of next candle.
Target
Target 1 will be the nearest resistance zone which will be also the neckline of W pattern as marked on chart.
Target 2 will be next next resistance zone after the neckline of W pattern is broken as marked on chart.
Stoploss
We can keep stoploss below the double bottom support zone.
Plea
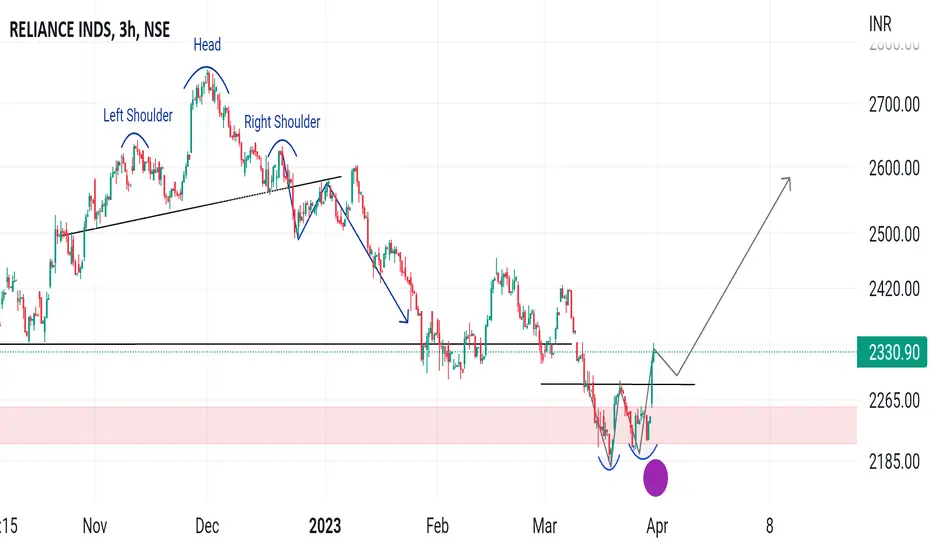
Reliance Double Bottom & RSI DivergenceReliance has formed double bottom pattern on daily chart. While the RSI is making higher low which is clear sign of RSI Bullish Divergence.
Entry
We can go long on open of next candle.
Target
Target 1: We can keep our 1st target at the nearest resistance which will also the neckline of the W pattern as marked on chart.
Target 2: Once the 1st target is achieved & price gives breakout above the neckline of the W pattern 2nd target will be the next resistance as marked on chart.
Stoploss
We can