Economic Cycles
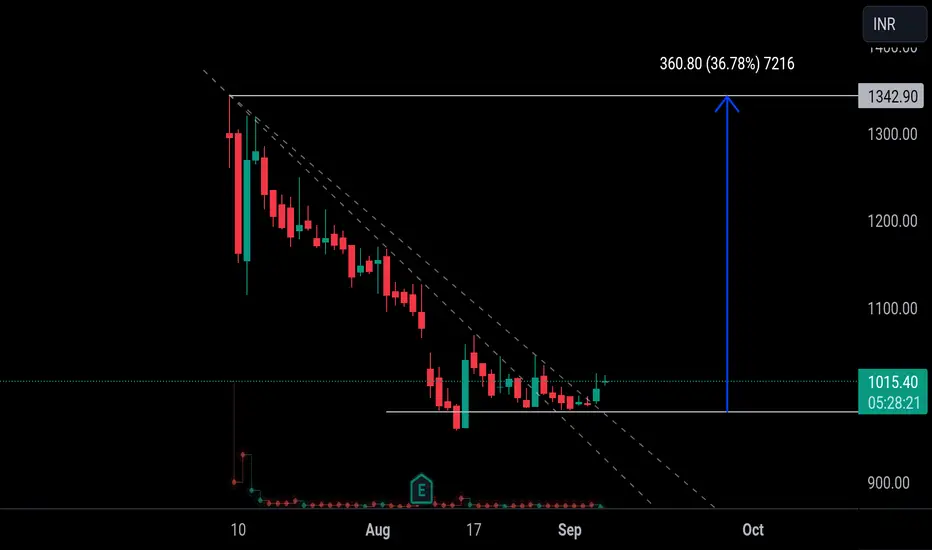
NIACL - Weekly chart Reversing Set up NIACL - Weekly chart Reversing Set up. Stock is coming out of Good base of 6 years and satisfying the Stein Weinstein Stage analysis.
This is not a buy sell reccomdation. This is for my learning and recording purpose.
For Tradingview Premium plan, Can go with the below link
in.tradingview.com
Is TCS looks Weak? My answerQ: Do you think TCS looks weak on chart?
My answer is "NO" as far as chart is concerned. Remember, it must have nothing to do with the fundamentals.
As you can see in the Monthly charts of TCS, their isn't a "single low broken" since March 2020. Let's analyze each Month's lows.
Mar 2020: Rs 1506.05
April 2020: Rs 1650
May 2020: 1865.20
June 2020: 1981.10
July 2020: 2079.50
Aug 2020: 2216.45
Sept 2020: 2241.30
Oct 2020: 2492.30
Nov 2020: 2600.05
Dec 2020: 2624.45
Jan 2021: 2879
Feb 2021: 2880
M
Q&A_ What is meant to never sell at a loss?Namaste!
You must have heard the words of great investor of all time.
Mr. Warren Buffett once said, “The first rule of an investment is don't lose . And the second rule of an investment is don't forget the first rule."
Losing money means, in simple terms means, selling at a loss . People get fearful and sell when the stock starts falling. There can be unlimited reasons for this happening, we will never going to find it out. What we can do, is just two things:
Buy and Sell .
As long as our se
Q&A_ When to sell Ultratech?Namaste!
I often wonder why do retail people and even institutions sell when the stock has been already fell. Why didn't they sell when the stock was rising?
I follow a simple principal. Either sell it at a profit or don't sell.
Anyways, In the weekly chart of the ultratech, you must have noticed the circles I've drawn.
These circles represent the price as well as volume candles.
Rising prices should mostly be supported by the rising volumes. But in this case, the volume is falling. This can
Triple bottom done don't missI'm very positive on this company, actually it's infrastructure gas companies. It's my long term investment at least 5 years time frame
Yesterday it's results came & also provide conference to share my idea
As per t. A. Folling wedge petern form in daily charts
Today we can see break out
GLong
Truly multiple wealth creator but now I m fully exitTwl is one of my favorite stocks from very long time, I m entered@ 150/90 levels multiple times
As per my analysis now it's over
My last target was 840 & 880 almost achieved
I m completely exit @ 680/850 step by step
I will only reentering above 1000wclb