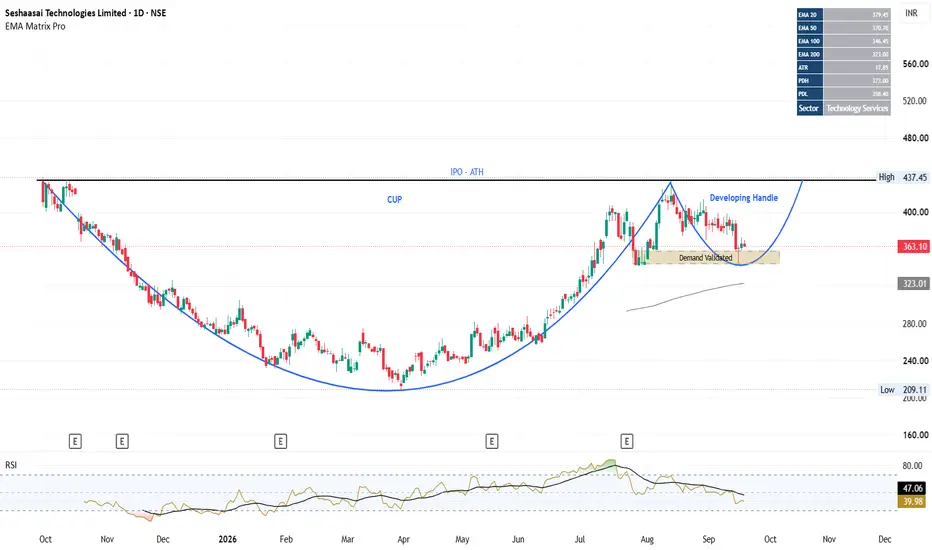
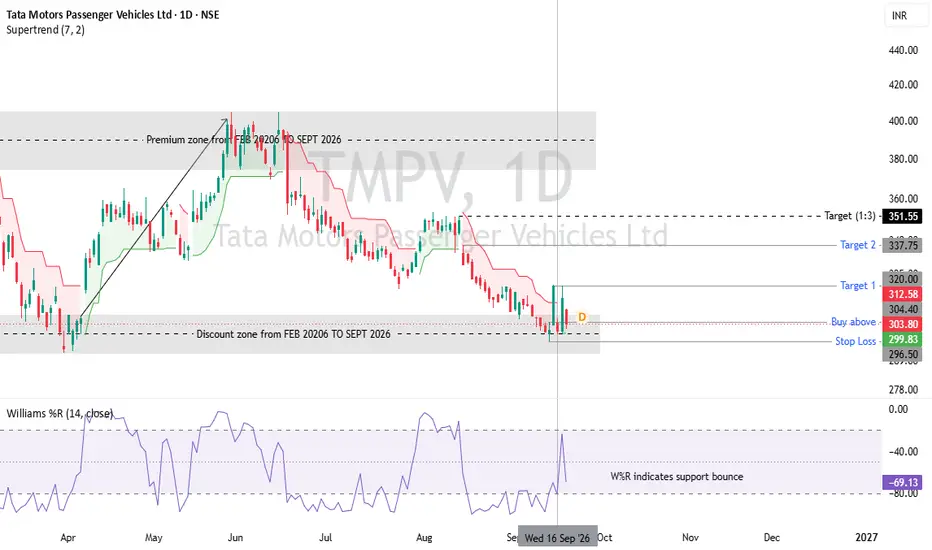
STYL : Cup & Handle Taking Shape — Demand Zone HoldsSeshaasai Technologies Ltd. NSE:STYL is developing an interesting Cup & Handle structure on the daily chart, with the handle currently testing an important demand/confluence area.
Key Observations :
1. Cup formation: After the post-listing decline, price formed a broad base and recovered toward the IPO/major high zone around ₹433–437, completing the larger cup structure.
2. Supply reaction: The first attempt near the previous high was rejected, followed by another pullback. This indicates that the ₹433–437 area remains the major supply/resistance zone.
3. Handle development: The subsequent decline has so far held the ₹343–358 demand zone, which is close to the lower portion of the developing handle.
4. EMA confluence: The demand area is supported by the 100 EMA around ₹346.5, while the 50 EMA around ₹370.8 is currently acting as an intermediate dynamic level.
5. Momentum: RSI has cooled from the previous overbought region and is now around the neutral zone. This gives the handle room to develop without the stock remaining excessively extended.
Trade Plan:
Trigger:
A sustained move above ₹394 and RSI above 50 can be treated as a confirmation of the developing handle breakout / short-term structure reversal.
Upside levels:
₹437–438: Major resistance / previous high
Above ₹437–438: price discovery becomes possible, subject to breakout strength and volume.
Invalidation:
A decisive breakdown below the ₹343–358 demand zone, particularly a daily close below the lower boundary, would weaken the current Cup & Handle thesis.
Risk management:
Rather than entering solely because price is inside the demand zone, the cleaner setup is to wait for price confirmation above ₹394, preferably accompanied by expanding volume. Position size should be calculated according to the predefined risk per trade.
Important technical distinction:
₹394 does not validate the demand zone itself. It validates the handle/recovery structure. The demand-zone thesis is already supported by the reaction from ₹343–358; ₹394 is the potential confirmation trigger.
------------------------------------------------------------------------------------------------------------
Disclaimer: This is a personal technical-market observation for educational/informational purposes and is not investment advice. I am not a SEBI-registered investment adviser/research analyst. Please conduct your own research and manage risk according to your individual circumstances.  Long
Long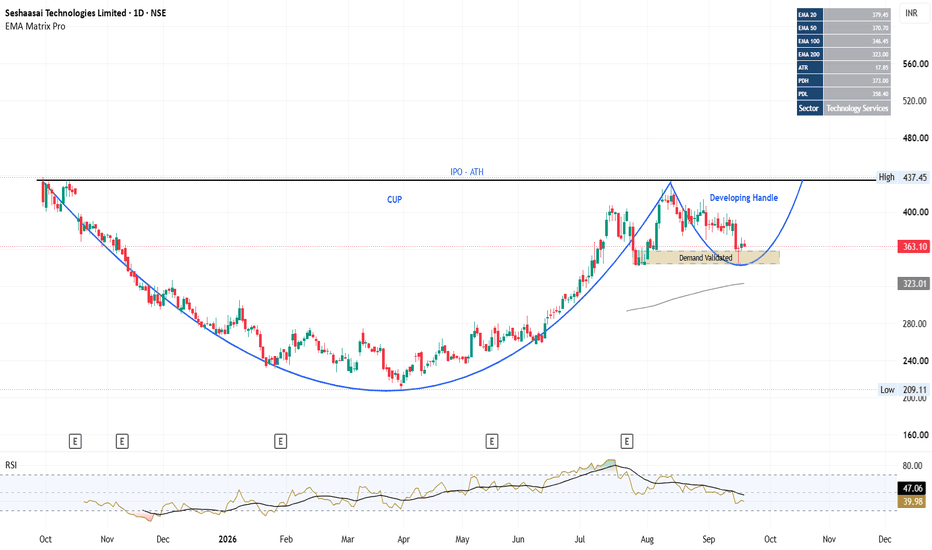
NIFTY — POTENTIAL BULLISH REVERSAL SETUPNIFTY is showing an interesting technical structure that could indicate a shift from bearish momentum toward a potential bullish reversal.
The setup is based on two key technical observations across different timeframes:
🔹 15-Minute: 30 EMA & 50 EMA crossover + price reaction from the EMA zone
🔹 1-Hour: Prominent Doji formation following a sustained bearish move
The combination of these signals makes the current price action worth monitoring for confirmation of a possible upside move.
🔥 1. 15-MINUTE — EMA CROSSOVER SIGNAL :
On the 15-minute timeframe, the 30 EMA and 50 EMA have crossed, suggesting that short-term momentum may be undergoing a transition.
More importantly, NIFTY is showing a reaction around this EMA zone rather than continuing to accelerate lower.
The 30 EMA and 50 EMA can act as dynamic support/resistance during trending conditions. Therefore, if price continues to hold above this zone, it could indicate that buyers are gradually gaining control.
📌 What to watch:
Price sustaining above the 30/50 EMA zone
Bullish candles forming after the EMA reaction
Increasing buying momentum
Breakout above the recent intraday swing high
A sustained move above the EMA structure would provide stronger confirmation of the bullish thesis.
🕯️ 2. 1-HOUR — PROMINENT DOJI AFTER BEARISH MOMENTUM :
The second and potentially important component of this setup is visible on the 1-hour timeframe.
After a period of bearish momentum, a prominent Doji candle has formed.
A Doji represents a period where the opening and closing prices are relatively close, reflecting indecision between buyers and sellers.
When such a candle appears after an extended directional move, it can indicate that the prevailing momentum is losing strength.
🎯3. TARGET: 23,450
If the bullish reversal gets confirmed and NIFTY sustains the upward momentum, 23,450 can be considered a potential upside target.
Key Setup: 15M EMA crossover + EMA reaction + 1H Doji → potential bullish reversal toward 23,450 .
 Long
Long
 Long
Long
RELIANCE: Falling Wedge Bullish Reversal at Strong Support ₹1469Technical Analysis
Pattern Formation : The 1-Day chart of Reliance Industries Limited (RELIANCE) displays a multi-month Falling Wedge pattern. Lower highs and lower lows are gradually narrowing toward a technical apex, indicating seller exhaustion.
Support Zone: Price action is testing a major Strong Support Area around ₹1,200 – ₹1,210. This zone aligns with past macro swing lows and includes a recorded False Breakout / Liquidity Sweep (under ₹1,200), signaling strong institutional buying defense.
Accumulation / Spring: The chart highlights a rounded accumulation curve (green shade) emerging from the lower trendline of the wedge, forming a potential "spring" structure near the ₹1,200 zone.
Resistance & Targets:
Immediate Resistance: ₹1,372 (Intermediate Horizontal Resistance Band).
Primary Target: ₹1,469 (Upper Resistance Zone / Measured Move Target).
Fundamental Drivers
Energy & Petrochemicals: Stable refining margins and expansion into green energy initiatives (solar, hydrogen, and gigafactories) provide long-term balance sheet stability.
Consumer Businesses (Retail & Telecom): Steady ARPU growth in Jio Platforms alongside consistent revenue expansion in Reliance Retail continue to drive core earnings growth.
Balance Sheet Flexibility: Strong institutional capital access and investment grade ratings maintain defensive strength despite broader market volatility.
Trading Idea Summary
Current Price: ₹1,244.00
Accumulation Zone: ₹1,210 – ₹1,240
Stop Loss: Below ₹1,195 (daily candle close)
Target 1: ₹1,372.40
Target 2: ₹1,469.50
Risk-to-Reward: 1:3.5+
Disclaimer
This post is for educational and informational purposes only and does not constitute financial or investment advice. Technical chart patterns and fundamental data are subject to market risks. Please perform your own research or consult a certified financial advisor before making any trading decisions.
 Long
Long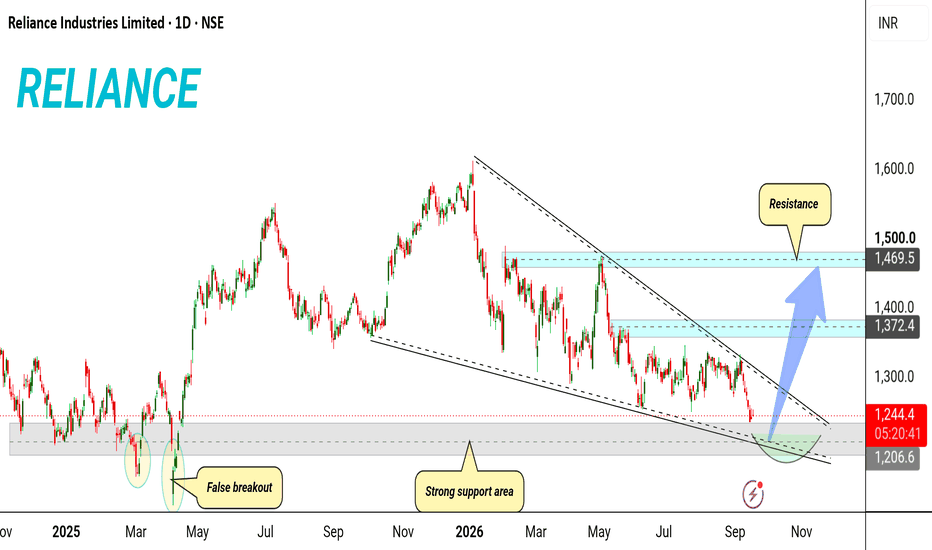
TCS: The Flag That Volume Almost RuinedTCS has been moving sideways for weeks now. Slow charts like this often get ignored. But a slow chart can still be telling a story — you just have to read it patiently. Here is what I am seeing.
The Big Move First
Back in July, TCS made a sharp low near 1,977 and then rallied fast, almost in a straight line, up to about 2,495. That rally was clean and steady — no big overlaps, just strong steps up. I am marking this move as wave A (or wave 1, if you prefer the impulsive count).
The Pause After That
Since early August, the stock has been drifting down in a slow, tilted channel. Notice how the candles overlap each other here — that is very different from the sharp, clean climb before it. Overlapping price action like this usually means the market is resting, not reversing the bigger trend. This looks like a flag — a pause after a strong pole, not a breakdown.
What Volume Is Saying
Volume has been shrinking through this pause. That is a good sign — it tells us sellers are not pushing hard, they are just taking profit. But the latest session broke that pattern. It printed the biggest volume of the whole pause, and yet the candle opened high and closed near its low. That is not the kind of volume you want to see just yet. It looks more like a test that got rejected than a breakout. So for now, this is a caution flag, not a green light.
Invalidation Level:
Every idea needs a level where it breaks. For this setup, that level is around 2,088. This is the 0.786 retracement of the July-August rally. As long as TCS holds above this zone, the flag idea stays alive. A close below 2,088 would mean this is no longer a simple pause — it would call for a fresh look at the chart, not a hope-and-hold approach.
What I Am Watching Next
I want to see two things before trusting this setup: price holding above the 2,088 zone, and a strong up move that comes with rising volume, not shrinking volume. Only then does the flag idea get real support. Until that shows up, this remains a wait-and-watch chart, not a chase-it chart.
Disclaimer:
I am not a SEBI registered research analyst. This post is shared only for education and learning purposes, based on my personal reading of the chart. It is not a buy or sell recommendation. Please do your own research or speak to a registered advisor before taking any trading decision.  Long
Long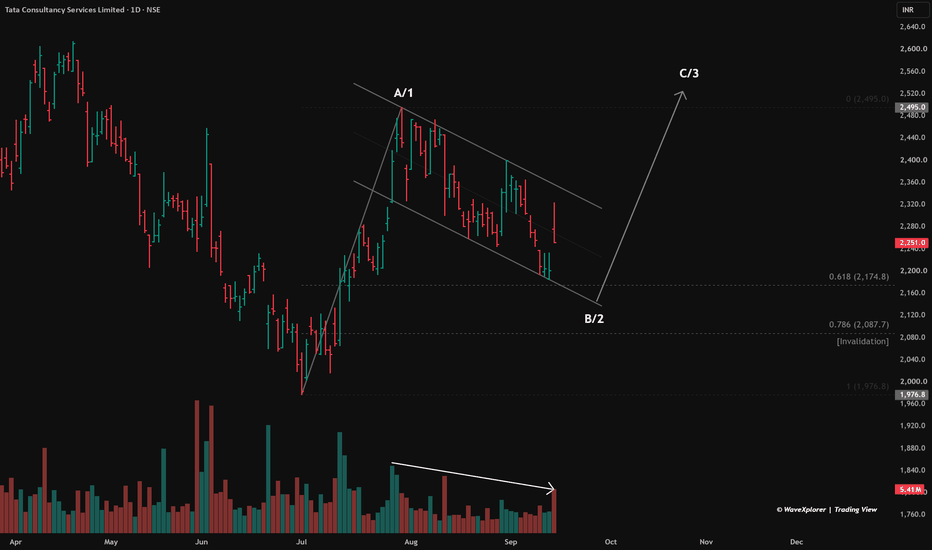
 Long
Long
NIFTY IT — A Massive Inverse H&S Is Taking Shape???NIFTY IT — A Major Inverse Head & Shoulders Is Taking Shape 👀
NIFTY IT is showing a potential Inverse Head & Shoulders (IH&S) pattern on the weekly timeframe.
The structure is quite clear — a left shoulder around ₹27,500–₹28,000, a deeper head near ₹25,700, and a right shoulder developing around the ₹27,500–₹28,000 zone.
The key level is the ₹32,000 neckline.
A decisive breakout and sustained move above ₹32,000 could confirm the pattern and potentially open the way toward the ₹38,000+ zone, based on the approximate measured move.
But I’m not anticipating the breakout.
Breakout → Sustain → Confirmation → Follow-through.
Until then, this remains a developing structure.
What makes this chart interesting is that NIFTY IT could be quietly building a major reversal structure after a prolonged period of weakness.
Now the market has to prove it.
₹32,000 is the level to watch. 📈  Long
Long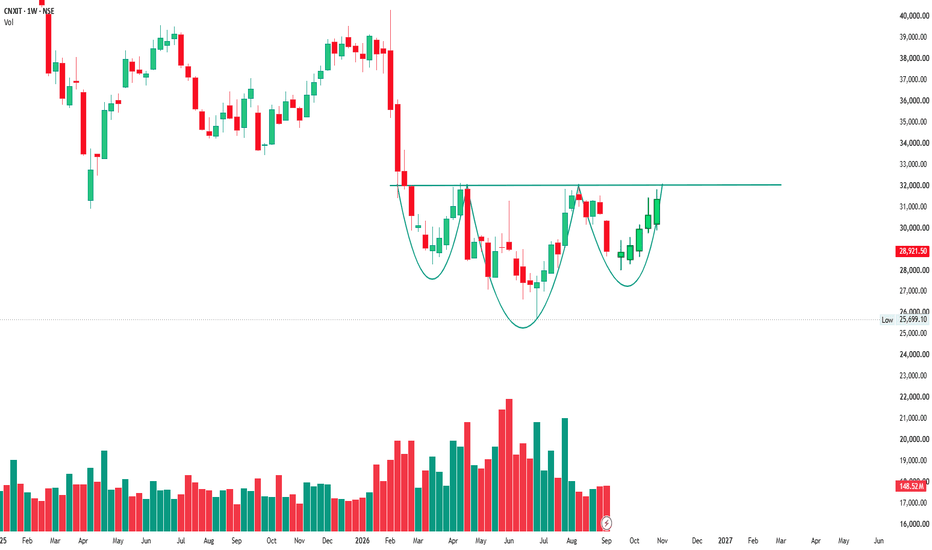
Long 
 Long
Long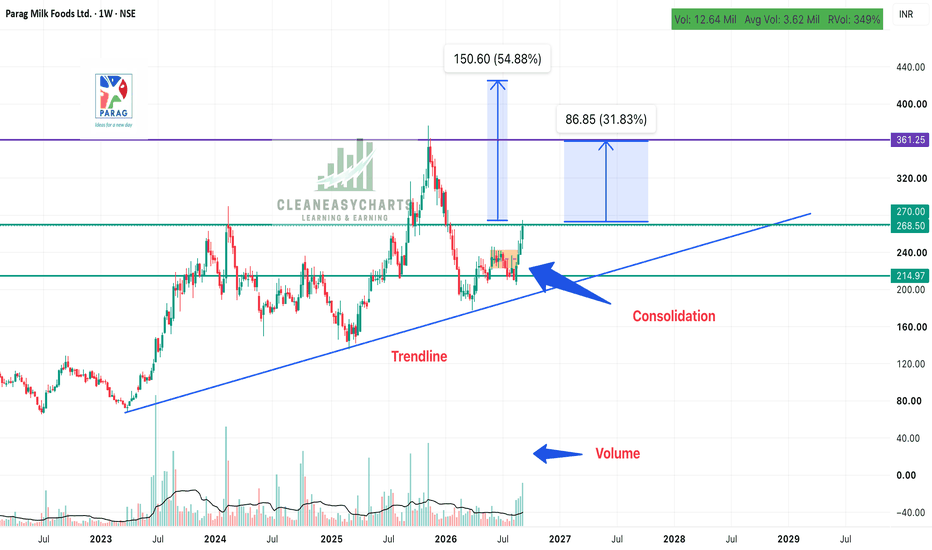
200 EMA Support + 9/21 Crossover… V-MARC Ready For The Next Leg?Hello everyone, i hope you all will be doing good in your life and your trading as well. Let's discuss about a stock which has shown some good strength from lower levels.
Stock name is V-Marc India is a company I have been watching recently, mainly because the business growth and the technical setup are starting to come together.
For those who don't know, V-Marc India operates in the wires and cables segment, manufacturing different types of insulated wires and cables for electrical applications.
What caught my attention is that the business has been growing strongly. The latest quarter showed around 556 Cr sales and 29 Cr net profit , while FY26 sales reached around 1,797 Cr with net profit near 99 Cr.
Now coming to the chart 👇
Technically, I'm watching a few important things:
200 EMA support has been tested and price has managed to hold above it.
The 9/21 EMA bullish crossover is giving a short term positive signal.
There is also a bullish RSI divergence visible around the recent correction.
Volume picked up when price was defending the support area, which is another thing I liked in this setup.
The 340–345 zone is the area I'm watching for accumulation/add-on opportunities.
The interesting part for me is that this is not only about a technical bounce.
Improving earnings + strong return ratios + a constructive chart makes V-Marc worth keeping on the radar. The company is currently showing ROCE and ROE above 40%, although investors should also keep an eye on borrowing and valuation before taking any long term decision.
If the current structure holds, the chart opens up towards the marked 395–405 zone first, followed by 450-460 and the larger positional zone around 520–535 .
I'm not expecting the stock to move in a straight line. Pullbacks are normal. For me, the important thing is whether buyers continue to defend the support and maintain the bullish structure.
For all important levels, accumulation zone, targets and invalidation, watch the chart above.
Is V-Marc setting up for its next leg higher, or is this just another short term bounce?
Let me know your view in the comments.
If you liked the analysis, Boost it and Follow for more Indian market setups.
Disclaimer: This is my personal market view for educational purposes only. Please do your own research before taking any investment or trading decision. Technical levels can fail and markets involve risk.
By— @TraderRahulPal
 Long
Long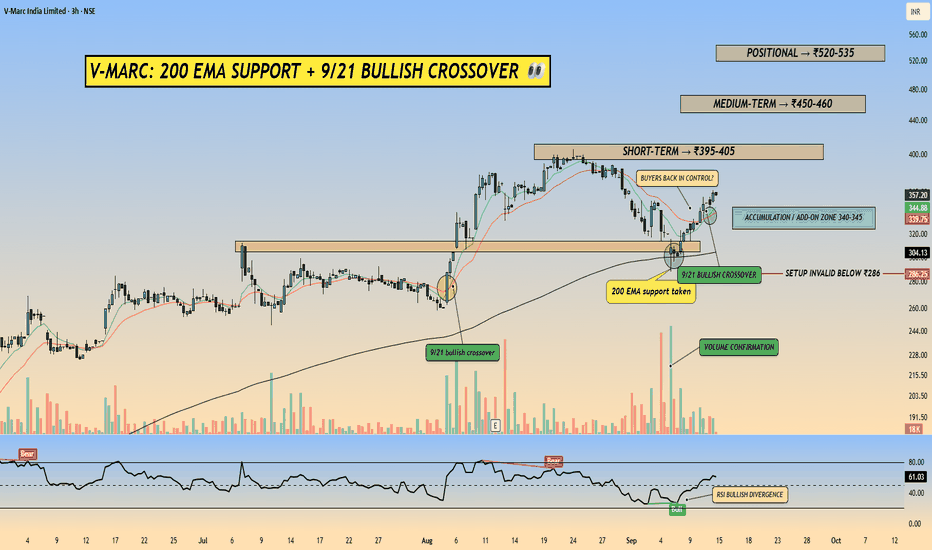
 Long
Long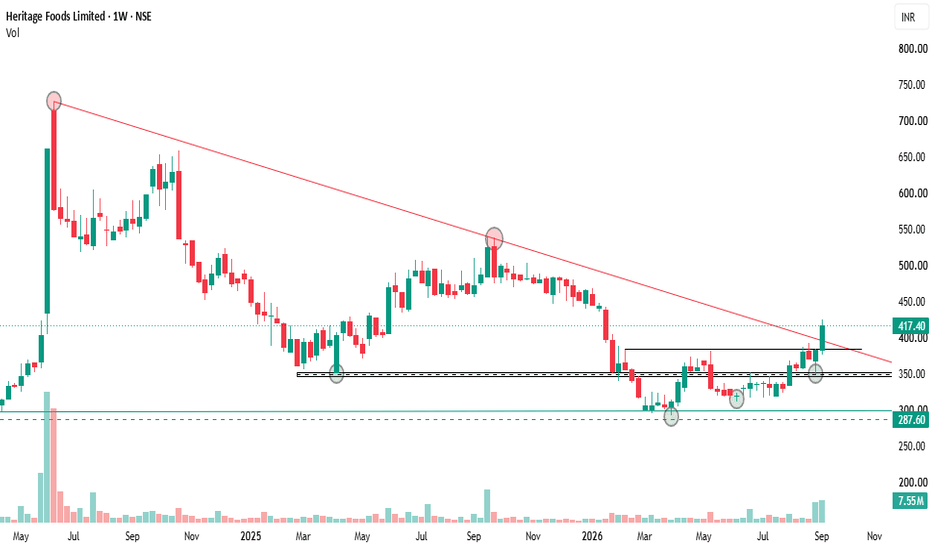
Market Breadth NIFTYMIDSMALL400The Path to Trading Mastery: Research and Pattern Recognition By Qullamaggie
1. Step-by-Step Market Research
The easiest way to start is to research the markets thoroughly. First, get a platform like TC2000 and set your charts to the monthly timeframe. Create a watchlist of all US stocks and filter them by dollar volume instead of just share volume. Aim for liquid names—those with at least $1 billion to $10 billion in monthly dollar volume—to avoid "super thin" or illiquid stocks.
2. Identifying the Big Movers
Go through the entire database (roughly 5,000 stocks) and identify the outliers. Look for stocks that:
At least doubled in price within six months.
Increased 200–300% within a single year.
Gained 400–500% over three to four years.
Create a separate watchlist for every single stock that has made these massive moves. You will likely end up with a few hundred highly liquid, historical winners.
3. Studying Chart Patterns
Go back as far as the 80s or 90s and study their chart patterns. Stocks move in very specific ways. These same patterns occur over and over again—there is nothing truly new in the markets. While there are variations, the patterns that worked in the 90s are the same ones you see today.
Focus primarily on price action. You can add a few indicators if you wish—I recommend moving averages—but don't use too many. "Too many indicators is for suckers." Study how these big winners acted during pullbacks:
Which moving averages did the best stocks respect or "obey"?
How did they behave before the breakout?
How did they act once the move was underway?
4. Building Your Mental Database (The 2,000-Hour Rule)
Your goal is to build a database in your head. Spend 1,000 hours doing exactly this: printing out charts, studying them, and saving them. (I personally use Evernote to store tens of thousands of these charts).
Once you understand the price action, spend another 1,000 hours researching the fundamentals and the news behind those moves. What was driving them? What made a stock go up 500% in a year?
If you put in those 2,000 hours of deep research, I promise you: before you know it, you’re going to have ten million dollars in your account. WaveTalks -COMEX GOLD: The Sharp Fall 4479 to 4355's- What Next?Comex Gold
1:42 am / 11th Sep 2026 (Indian Standard Time)
Last @ $4364
"Is Gold teasing before a deep dive? Well, only the next few candles will tell. Did you get the red candles? Like there was no floor... This is exactly what unfolded and is called a Thrust (Deep Dive)."The quote above highlights the real-time breakdown flagged earlier on the WaveTalks social media channels at 11:29 am on 10th September 2026.
Already completed 1st Bigger Impulse
$3963 to $4755 & Fall from $4755 to $4329 - Discussed via Social Media Handle.. This analysis continuation from $4329 lows.
⚠️ DISCLAIMER:
This analysis is for educational purposes only. No solicitation to buy or sell.
Primary Wave Scenario - ABC
( Wave-A Blue Color Done at $4329.2...Wave-B Blue Color unfolding as Smaller Wave - abc in black...Once Wave-B completes on top close to $4590-4600... Expect Fall in Wave-C Blue Color )
Alternate Wave Scenario- ???
Gold futures are currently completing a sharp thrust lower in a complex Wave-B correction down to the $4,350-4355 area before embarking on a bullish reversal toward the $4,600 region as a possible scenario.
🟢 1. CURRENT ELLIOTT WAVE STRUCTURE 🟢
• The initial impulsive rally from the $4,329 bottom completed Wave- (A) Black at the $4,558 peak.
• Since that top, price action has been carving out a choppy and messy complex Wave-B structure - which is ongoing ...current low is 4355's ( 12:54 pm /11th Sep 2026 / Indian Standard Time )
• This corrective wave featured a connecting contracting triangle pattern labeled sub-waves a through e.
• The sudden drop from the $4,479 sub-wave e peak represents a classic post-triangle thrust.
• This floorless decline is rapidly flushing out weak longs to finalize the corrective phase.
🟢 2. PROJECTED UPSIDE TRAJECTORY 🟢
• Once the current downward thrust concludes near the $4,350-4365 support zone, a bullish reversal is expected next.
• This upcoming advance will develop as a major impulsive Wave-C leg to the upside.
• The multi-session bullish recovery will officially trigger once price decisively breaks back above the $4,410-$4,420 trigger zone.
• The primary upside targets reside at the previous structural high of $4,479 - 4,489 zone and the major resistance cluster between $4,550 and $4,560.
• Extending the wave relationships suggests the rally could ultimately reach a peak within the $4,590-$4,600 terminal window.
🟢 3. RISK MANAGEMENT AND KEY LEVELS 🟢
Trading this layout requires strict adherence to defined risk parameters at every major pivot zone.
• Immediate Downside Support: $4,350-4365 zone
• Bullish Breakout Confirmation: $4,410-$4,420
• Intermediate Resistance Targets: $4,479 - 4489
• Major Supply Cluster: $4,550-$4,560
• Terminal Target Zone: $4,590-$4,600
🟢 4. NEXT WEEK HORIZON 🟢
• As the broader blue Wave-B peak nears completion close to the $4,600 level next week, buyers must aggressively secure profits.
• A major structural top is anticipated to form inside that high-altitude supply zone.
• Reaching this terminal zone will complete the larger-degree corrective bounce and set the stage for a bearish reversal.
• Traders must exercise extreme caution at those highs of $4590-4600 zone (If unfolds) because the subsequent leg will unfold as a deep, aggressive liquidation phase in blue Wave-C.
WaveTalks
Market Whispers! Can you hear them?
 Long
Long
 Long
Long
MCX Crude Oil: Will it BREAKOUT ?Crude Oil is currently sitting at a very important technical hurdle, with price approaching the upper boundary of a consolidation pattern that has been developing since the sharp rally seen during March–April 2026.
The interesting part is that this consolidation resembles a Bullish Pennant formation.
📊 What does the chart show?
Crude Oil witnessed a sharp impulsive move higher earlier in 2026, followed by a period of consolidation.
Since the April–June period, price has broadly formed:
🔹 Lower highs — indicating that sellers have been capping rallies.
🔹 Higher lows — indicating that buyers are stepping in at progressively higher levels.
This has resulted in a contracting triangular structure, which is characteristic of a pennant/triangle-type consolidation.
The important question now is:
Will this consolidation resolve on the upside?
🚨 THE BIG HURDLE
The upper trendline has been tested multiple times, particularly around the April–June 2026 highs.
Every previous attempt to move through this zone has encountered selling pressure.
However, the latest price action is different.
Crude has gradually moved higher from the July lows and is now approaching the upper resistance trendline around ₹9,100–₹9,200 on the chart.
The September 9 candle closed around ₹9,129, putting price directly at this crucial zone.
A decisive breakout and daily close above the trendline would therefore be technically significant.
📈 WHAT IF THE BREAKOUT HAPPENS?
If Crude Oil convincingly breaks above the upper trendline with strong price action and volume, it could signal that the multi-month consolidation has ended.
The first indication would be:
₹9,200+ → Breakout confirmation
After that, traders could watch for the previous swing-high zones and potential measured-move targets.
The height of the broader pennant can also be used to estimate a potential breakout objective, although such targets should be treated as projections rather than guaranteed levels.  Long
Long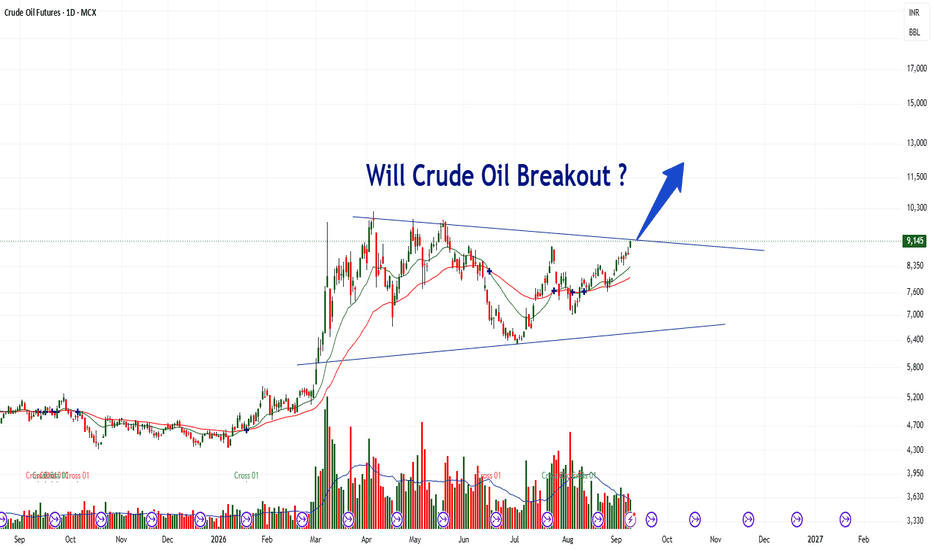
BSE Ltd: Retest of Demand Zone with 3,660 Upside PotentialThe setup is based on a support-zone retest, with the broader structure offering a favourable risk-to-reward opportunity. A sustained hold above the entry region near ₹3,200 could open the path toward the next major resistance and projected target around ₹3,660.
Trade plan
Entry: ₹3,200
Stop-loss: ₹3,128.50
Target: ₹3,660
Risk: ₹71.50 per share
Potential reward: ₹460 per share
Approximate risk-to-reward ratio: 1:6.4
The trade becomes more attractive if price forms a bullish reversal candle, reclaims the short-term moving average, and sustains above the nearby resistance zone. However, a decisive close below ₹3,128.50 would invalidate the setup and indicate weakness in the demand area.  Long
Long
Don’t Rush to Sell BTCUSD – Buyers Are Defending the ChannelBTCUSD is currently leaning toward a short-term BULLISH recovery, as buyers continue to defend the broader rising structure despite a challenging macro backdrop. Oil prices near $100 and uncertainty around the Fed are keeping risk sentiment cautious, but the weaker U.S. dollar is offering some relief to Bitcoin. For now, the macro picture remains mixed rather than strongly bearish, giving BTC room to recover if technical support continues to hold.
On the H2 chart, after the recent rejection from the $81,000–$82,000 area, Bitcoin has entered a corrective phase and moved back toward the lower boundary of its rising price channel. This may look like the beginning of a deeper decline, but so far the bullish channel has not been broken. Previous tests of this lower trendline have attracted buyers, making the current pullback an important area to watch for another reaction.
The $77,900–$78,000 area stands out as the key support zone, where horizontal support and the lower channel boundary come together. If buyers defend this area again, I expect BTCUSD to recover toward $79,000–$80,000 first. A stronger breakout above this region could then open the way toward the upper part of the channel around $82,000.
As long as $77,900 holds, I see the current weakness as a correction within the broader rising structure rather than a confirmed bearish reversal.  Long
Long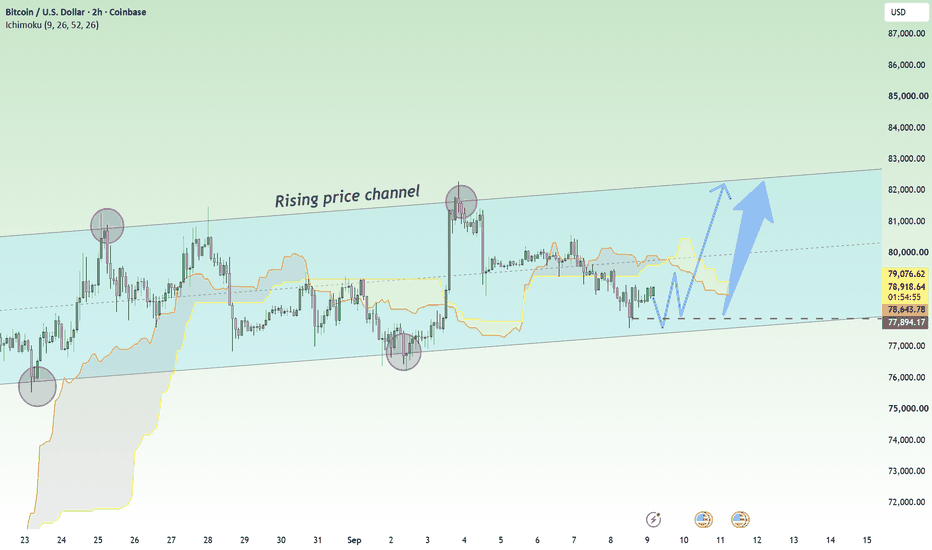
MSTCLTD:Stage 2 Continuation / High-Level Consolidation BreakoutMSTC is showing a strong Stage 2 uptrend following a powerful advance from the ₹430–450 region. After the initial expansion, the stock consolidated for several weeks around ₹710–760 without giving back a significant portion of the prior move. Price has now broken above the upper boundary of this consolidation and closed near ₹786, suggesting a potential continuation of the primary uptrend.
The setup is further supported by a strong relative strength reading and bullish moving average structure. A successful retest of the breakout zone could provide a lower-risk opportunity to participate in the next momentum leg.
Technical Observations
Established Stage 2 Uptrend: Price is trading above rising 20 EMA, 50 EMA and 200 DMA, with the moving averages positively aligned and supporting the primary trend.
Strong Prior Expansion: The stock advanced sharply from the ₹430–450 region to above ₹700, demonstrating strong momentum and sustained buying interest.
High-Level Consolidation: After the impulsive advance, price formed a relatively tight consolidation around ₹710–760 rather than undergoing a deep correction, indicating healthy digestion of gains.
Breakout from Consolidation: Price has now broken above the ₹760 resistance area and closed around ₹786, providing a potential continuation signal.
Higher Highs and Higher Lows: The overall price structure remains bullish, with buyers consistently defending higher levels throughout the advance.
Relative Strength Leadership: Relative strength has moved to fresh highs, confirming continued outperformance versus the broader market.
Volume Support: Breakout participation is supportive, although stronger follow-through volume on subsequent sessions would further strengthen the breakout.
VCP-like Characteristics: The recent consolidation shows relatively tight price action near highs, with volatility contracting before the breakout.
Key Levels
Immediate Support: ₹760–770
Major Support: ₹710–720
Breakout Level: ₹760
Current Momentum Entry: Above ₹785–790 with sustained strength
Target 1: ₹830–850
Target 2: ₹880–900
Target 3: ₹950+
Trade Plan
Aggressive momentum traders may consider entries around the current levels if price sustains above ₹785–790 and continues to show strong price action. Since the stock has already broken out of the ₹710–760 consolidation, the primary objective is to participate in continuation rather than anticipate another breakout.
A more favourable risk-to-reward opportunity could emerge if the stock retests the ₹760–770 breakout zone and successfully holds it as support. Ideally, the pullback would occur on declining volume followed by renewed buying.
For a positional trade, a stop loss below the recent swing low around ₹710–715 can be considered, depending on individual risk tolerance and position sizing. A tighter stop below ₹760 could be used for a shorter-term momentum trade, although this increases the risk of being stopped out by normal volatility.
Summary
MSTC is exhibiting several characteristics of a strong Stage 2 momentum continuation setup: an established uptrend, rising moving averages, a powerful prior advance, high-level consolidation, fresh breakout, and strong relative strength.
The breakout above ₹760 is constructive and could mark the beginning of the next expansion phase. The preferred setup is either sustained strength above the current breakout or a controlled retest of ₹760–770 followed by renewed buying.
Caution: The stock has already appreciated substantially from its earlier base, so chasing an extended move carries higher risk. The recent breakout should ideally receive follow-through rather than immediately falling back into the consolidation range. A decisive close below ₹710–715 would weaken the current bullish structure and increase the probability of a deeper correction.
Disclaimer: Educational purpose only. Not a recommendation to buy or sell securities. Please manage risk appropriately.  Long
Long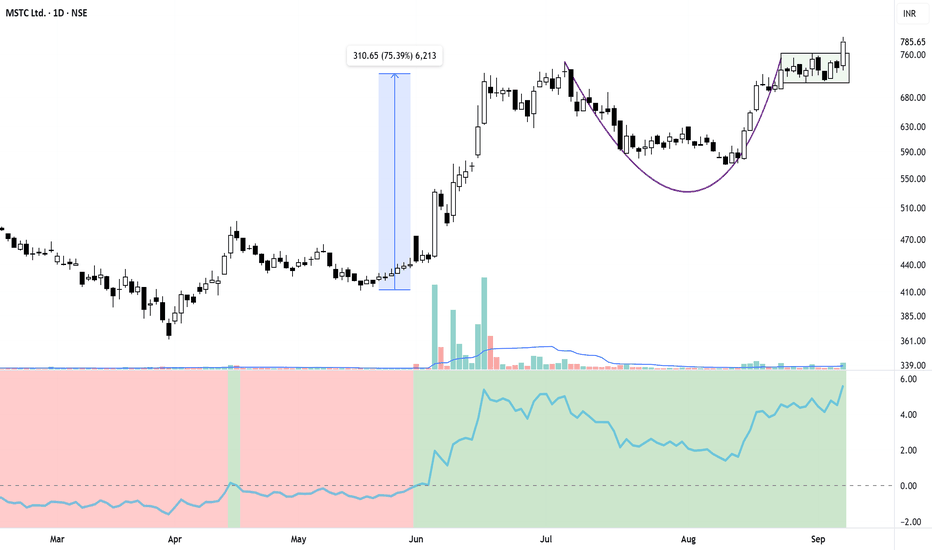
 Long
Long
Nifty - Weekly Review Sep 7 to Sep 11Buy above 24020 with a stop-loss of 23960 for the targets 24060, 24100, 24160, 24220, 24280, 24360 and 24420.
Sell below 23860 with the stop loss of 23920 for the targets 23820, 23780, 23720, 23660, 23620 and 23560.
Important levels to watch are 24120, 24000 and 23780.
Always do your analysis before taking any trade.