DOW jones Trend Analysis DJIA Weekly Chart Analysis
The global market has gone through major geopolitical tension because of the conflict involving the US, Iran, and Israel. Commodity prices have already seen a strong rally, and now investors are again shifting focus toward equity markets, especially the US market. This movement is also creating positive sentiment across global markets, including India.
On the weekly chart, the Dow Jones is trading near an important resistance zone around **49,800 – 50,200. Price has recovered strongly after the recent correction and buyers are again trying to push the market toward a breakout.
However, this breakout still looks **moderate and controlled**, not a very aggressive breakout like the strong momentum rally seen after the 2021 phase. The market is moving with caution because global uncertainty and geopolitical risks are still active.
Important Levels From Chart
Resistance Zone
* 49,800 – 50,200 → Immediate breakout zone.
* Weekly closing above this level can open the path toward 54,000+ levels in the coming months.
Support Levels
47,700 – 47,970 → First strong support zone.
45,000 – 45,300→ Major support and trend continuation zone.
43,700 – 43,970→ Extension support area.
41,400 – 41,820 → Strong long-term support.
37,300 – 37,700 → Major historical support zone.
Market Structure
The overall trend remains bullish on the higher time frame because:
* Higher highs and higher lows are still intact.
* Buyers are defending every major support zone.
* Recovery after correction shows institutional participation.
At the same time :
* Momentum is slowing near resistance.
* Market needs strong volume and positive global cues for a sustained breakout.
* Commodity inflation and geopolitical news can still create volatility.
Impact on Global & Indian Markets
If the Dow Jones gives a confirmed weekly breakout above 50,200, it can support:
* Global equity inflows,
* Positive sentiment in emerging markets,
* Strong momentum in Indian indices like NIFTY and SENSEX.
But if resistance holds, markets may move in a consolidation phase before the next big move.
Conclusion
The long-term trend is still positive, but this is not yet a massive breakout phase like previous historic rallies. Investors should watch the **50,200 breakout level** carefully. A successful breakout can trigger the next leg of rally toward **54,000**, while failure near resistance may lead to short-term consolidation or profit booking.
“Trend remains bullish above key supports, but confirmation is still required for the next big expansion move.”
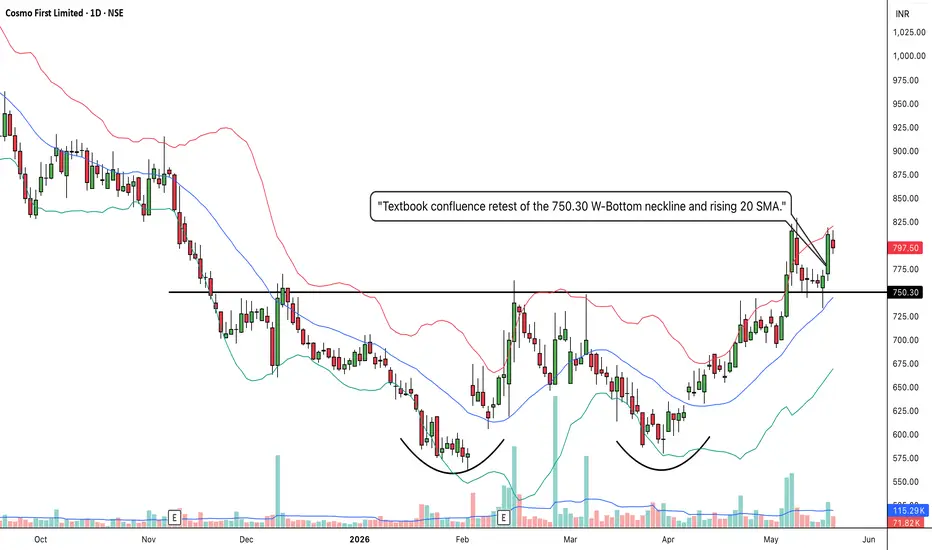
COSMOFIRST: Massive W-Bottom Base and Textbook Confluence Retest1. The Macro Perspective: The Washout and the W-Bottom
I am taking a LONG bias on Cosmo First Limited (COSMOFIRST) on the daily (1D) timeframe.
When analyzing pure market structure, the most reliable reversals are born from deep, agonizing accumulation phases. Look at the structural development on the lower half of this chart. After suffering a brutal markdown phase that dragged the price into the 500s and completely washed out weak hands, heavy institutional capital stepped in. I have explicitly drawn the two massive accumulation bowls at the bottom of the chart. This forms a textbook "W-Bottom" or Double Bottom structure. Instead of bleeding lower, strong-handed buyers aggressively defended these lows, systematically absorbing overhead supply to build a concrete macro foundation.
2. The Educational Setup: Conquering the Neckline
To understand the sheer strength of this current setup, look at how the price transitioned from accumulation back into a markup phase:
The Resistance Lid: For months, the ultimate ceiling of this base was defined by the solid black resistance line at 750.30. This was the "Neckline" of the W-Bottom.
The Breakout: Recently, buyers aggressively shattered this 750.30 ceiling with a massive momentum thrust, pushing the price all the way up to test the dashed 824.65 macro resistance. This definitive breakout officially signaled the end of the markdown phase and the birth of a new trend.
3. Current Price Action: The Ultimate Confirmation
In technical analysis, breaking a major resistance line is only half the battle. The most lucrative entries occur when a stock proves it can defend its newly claimed territory. Look at the most recent candles on the far right. After hitting 824.65, the stock took a healthy, necessary breather. It pulled back to perfectly test the 750.30 line from above. Furthermore, notice how the rising 20 SMA (the middle blue line of your Bollinger Bands) perfectly intersected with that horizontal line. This is a "Confluence Retest." By printing a strong green candle right off this intersection, that old, heavy resistance ceiling has officially been flipped into an indestructible structural launchpad.
4. The Trade Plan: Entries, Targets, and Risk Management
Entry Strategy: We are currently sitting right in the "golden entry" zone near 797.50. The highest-probability, lowest-risk entry involves stepping in right here as the stock launches off the structural retest of the 750.00 to 760.00 confluence zone. Letting that newly broken macro neckline and the rising 20 SMA prove themselves as a concrete floor offers a phenomenal risk-to-reward ratio before the next momentum expansion.
Take Profit (Targets): The immediate structural hurdle is the recent swing high at the dashed 824.65 line. Once that stepping stone is cleared, we use measured targets based on the depth of the macro base. By taking the depth of the W-Bottom (roughly 200 points from the ~550 floor up to the 750.30 neckline) and projecting it upward, our primary structural macro target sits beautifully in the 940.00 to 950.00 zone.
Invalidation (Stop Loss): A break-and-retest thesis is only valid if the new floor holds. A hard stop loss should be placed safely below the 750.30 neckline and the 20 SMA, around the 715.00 to 725.00 level. A definitive daily close completely back inside the old accumulation bowl would invalidate the immediate reversal thesis and signal a severe bull trap.
5. Time Horizon:
Because this technical setup is built on a 1-Day chart capturing a massive structural W-Bottom completion and a textbook confluence retest, this is a medium-term swing trade designed to capture the explosive new markup phase. Let the new trend run!  Long
Long
 Long
Long
 Long
Long
 Long
Long
 Long
Long
RSI Continuation Secrets: The Power of Positive ReversalsIf you are like most traders, you probably have the RSI indicator on your chart right now. And if you use the RSI, you have likely spent countless hours hunting for "divergences" to catch the exact top or bottom of a market.
We all love the thrill of catching a trend reversal. But let’s be honest: markets trend much longer than we expect, and trying to pick tops can be exhausting (and expensive).
What if, instead of using RSI to figure out when a trend is ending, you used it to spot when a strong trend is primed to continue ?
Enter a massively overlooked concept: The Positive Reversal .
What is a Positive Reversal?
Originally discovered by Andrew Cardwell (and sometimes called a "Hidden Bullish Divergence"), a Positive Reversal happens during an uptrend. It tells you that the current pullback might just be a trap for bears, and the price is gearing up to shoot higher.
Here is the simple formula:
Price makes a Higher Low .
RSI makes a Lower Low .
Let's Look at the Nifty Weekly Chart
Take a look at the Nifty 50 Weekly chart attached to this post. It provides a textbook example of this pattern playing out.
The Price Action: Notice how Nifty formed a swing low (around 21,743), rallied, and then pulled back to form a higher low (around 22,182). The price structure is clearly still bullish.
The RSI Trap: Now look at the RSI at the bottom of the chart. During that second price pullback, the RSI dropped significantly lower than it did during the first pullback (from around 34 down to 27).
Why Does This Work?
Think of this pattern like pushing down on a coiled spring.
The RSI dropping to a "Lower Low" shows that the sellers were pushing downward with incredible momentum. But look at the price! Despite all that heavy selling pressure, the buyers were so strong that the price refused to make a lower low.
When sellers throw everything they have at a market and the price still holds up, it points to immense underlying strength. The spring is compressed, and the trend is likely getting ready to explode upward again.
Setting a Target
One of the best parts about Positive Reversals is that they give you a clear mathematical target. To find it, you simply take the difference between your two price lows and add it to the high in the middle.
On our Nifty chart:
Step 1: Subtract the first low from the second low (22,182.55 - 21,743.65 = 438.90).
Step 2: Add that difference to the swing high in the middle (26,373.20 + 438.90).
Target: 26,812.10
The Reality Check: Nothing is Bulletproof
As powerful as this setup is, we have to talk about the golden rule of trading: Nothing is guaranteed. Just like any other technical pattern, Positive Reversals can and will fail. Sometimes market conditions change, news breaks, or the selling pressure simply becomes too much for the buyers to handle. You should never blindly trust a pattern without protecting your capital.
Always use a stop loss. For a Positive Reversal, a common and logical place to put your stop loss is just below the second "Higher Low" (in our Nifty example, slightly below 22,182). If the price breaks below that level, the bullish structure is broken, the pattern has failed, and it is time to exit the trade safely.
The Takeaway
The next time you are in a strong uptrend and the RSI starts looking weak, do not panic sell or rush to short the market. Instead, check if the price is holding a higher low. Manage your risk, place your stop loss, and you might just be staring at your next great trade entry!  Education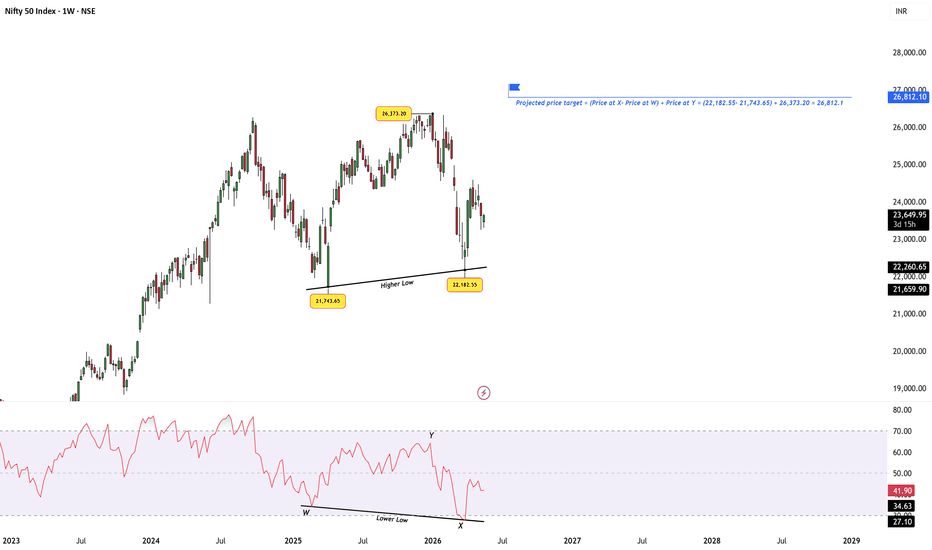
US market about to witness small correctionDow Jones Elliott Wave Analysis | 4H Chart
The Dow Jones Industrial Average (DJIA) appears to have completed a strong five-wave impulsive rally from the recent lows, with price now approaching a critical decision zone near channel resistance.
The current structure suggests:
Waves (1) through (5) have largely completed within a rising wedge / ending diagonal formation.
Price faced rejection near the upper trendline after Wave (5), indicating weakening bullish momentum.
The recent sharp decline from the top could be the early indication of a larger Wave (4) correction on a higher degree timeframe.
Key Technical Observations:
The rising wedge pattern is typically considered a bearish exhaustion structure.
Momentum divergence and failure to sustain above 50,000 suggest buyers are losing strength near highs.
The lower support trendline is currently acting as immediate support.
Important Levels:
Immediate Resistance: 50,000 – 50,400
Critical Support: 49,200
Major Support Zone: 48,415
Breakdown below 48,415 may confirm a larger corrective phase.
Elliott Wave Perspective:
The market may now enter:
A higher degree corrective Wave (4)
Or a broader ABC correction after completion of the impulsive structure
The green horizontal level near 48,415 becomes extremely important. Holding above this zone may lead to another upside attempt, while breakdown could accelerate selling pressure.
Trading View:
Short-term trend remains cautious below the wedge resistance.
Traders should watch for confirmation near support zones before taking aggressive positions.
Sustained weakness below support could trigger deeper correction toward lower Fibonacci retracement levels.
Overall Market Structure:
Long-term trend still remains bullish.
However, short-term exhaustion signals suggest increased volatility and possible corrective consolidation ahead.
Disclaimer:
This analysis is for educational purposes only and not financial advice. Please use proper risk management before taking any trades.
#DowJones #DJIA #ElliottWave #TechnicalAnalysis #TradingView #WaveCountPro #USMarkets #StockMarket #PriceAction #NeoWave  Short
Short
Short 
AUDUSD_DThe AUD/USD pair appears to have completed a five-wave Elliott structure on the Daily timeframe, while a clear bearish divergence is visible on both the Daily and Weekly timeframes.
In addition, a bearish Butterfly harmonic pattern is forming on the Weekly chart, increasing the probability of a medium-term downside correction.
As long as price remains below the invalidation level, the market outlook stays bearish, and we expect a decline toward the following targets:
0.69229
0.68254
0.67055
A confirmed breakdown below 0.70951 could provide a potential trigger for short positions.
However, if price breaks and sustains above 0.72770, this bearish scenario will be invalidated.
Fundamental Analysis (Related to Your Setup)
From a fundamental perspective, several factors could support bearish pressure on AUD/USD in the coming weeks:
* A stronger US Dollar driven by expectations of higher-for-longer interest rates from the Federal Reserve may continue to weigh on the Australian Dollar.
* Weakness in global growth sentiment and slower demand from China — Australia’s largest trading partner — could negatively impact commodity-linked currencies such as AUD.
* Declining risk appetite in global markets typically strengthens the USD while pressuring higher-beta currencies like AUD.
* If commodity prices, especially iron ore and industrial metals, continue to soften, the Australian Dollar may face additional downside momentum.
* Meanwhile, a cautious stance from the Reserve Bank of Australia compared with the Fed could further widen policy divergence in favor of the US Dollar.  Long
Long
 Short
Short
Ajanta Pharma (D): Bullish (Apex Squeeze & Pre-Breakout Setup)Timeframe: Daily | Scale: Linear
Ajanta Pharma is coiled in a massive compression zone, tightly squeezing against key historical resistance levels. Backed by excellent quarterly earnings and strong institutional accumulation, the probability of an upside breakout is highly elevated.
🚀 1. The Fundamental Catalyst (The "Fuel")
The rising volume and persistent upward pressure are directly linked to the recent Q4 performance:
> Earnings Beat: Strong top-line and bottom-line growth confirms the company's operational strength.
> Forward Guidance: Management's confident projection of 16–18% revenue growth for FY27 gives institutional buyers the conviction to accumulate shares right at these resistance levels.
📈 2. The Chart Structure (The Triangle Squeeze)
> The Convergence: The stock is forming a classic Triangle Pattern. The horizontal ceiling from Nov 2024 acts as a rigid supply zone, while the angular line from Sept 2024 is acting as dynamic support, pushing the price higher.
> Today's Action: The 0.9% surge on 237.94K volume indicates that bulls are persistently knocking on the door of the Nov 2024 horizontal resistance. The lack of a violent rejection implies that the sellers at this level are gradually getting exhausted.
📊 3. Volume & Indicators
Indicator analysis paints a picture of absolute trend harmony.
> Trend Alignment: The Positive Crossover (PCO) in the short-term EMAs across the Monthly, Weekly, and Daily timeframes confirms that the broader macro trend remains firmly up.
> Momentum: The rising RSI across all three timeframes indicates that underlying momentum is quietly building up before the actual price breakout occurs.
> Volume Accumulation: The rising volume profile confirms that smart money is actively absorbing the overhead supply.
🎯 4. Future Scenarios & Key Levels
The stock is at a pivotal juncture. The price action in the coming days will dictate the next major swing.
🐂 Bullish Targets (The Breakout):
- Trigger: A decisive Daily Close strictly above the Nov 2024 horizontal resistance zone (clearing the ₹3,110–₹3,150 supply area) backed by sustained heavy volume.
- Target 1: ₹3,450 – ₹3,485.
🛡️ Support (The "Must Hold"):
- Immediate Support: ₹2,950 – ₹3,000. If the breakout fails and momentum cools off, the stock should find immediate support near its short-term moving averages.
- Invalidation: A close below the angular trendline would invalidate the bullish structure and signal a return to a broader consolidation phase.  Long
Long
Nifty at a Crucial Retest Zone: Bounce Back or Bigger Breakdown?Nifty is currently trading at one of the most important technical zones on the weekly timeframe. After facing rejection from the major resistance area near 26,000, the index witnessed a sharp correction and has now returned to its long-term rising support trendline. Interestingly, the previous support area is now behaving like resistance, which makes this region a critical decision point for the market.
The highlighted zone around 23,000–24,000 will likely decide the next major move. If buyers manage to defend this support and Nifty sustains above the trendline, the market could attempt another bullish recovery toward the higher resistance zones. A successful bounce from here may restart the broader uptrend and open the door for a strong bullish continuation in the coming months.
However, if the market fails to hold this support structure, the bearish pressure can increase significantly. In that case, Nifty may decline toward the next major support near 19,000. A deeper breakdown below that level could even trigger a stronger bearish phase toward 15,200 levels, indicating a complete shift in long-term market sentiment.
Right now, this is a pure “reaction zone” for the market. Traders should closely observe how price behaves around support before taking aggressive positions. The next few weekly candles could define whether this is just a temporary correction or the beginning of a larger trend reversal.  Short
Short
BTCUSD Pennant Structure | Waiting For FMFR SetupThe market is currently trapped inside a pennant structure, creating a compressed price range where both sides are active.
My main expectation here is an FMFR setup — First Move Fake Than Reversal. In this type of structure, the first breakout move is often a fake move before the market reverses strongly in the opposite direction.
Because of that, I am not measuring the full move yet. First, I want to see which side the market chooses for the initial fake breakout. Once that fake move appears, I can then calculate the expected reversal move based on the first expansion of the pennant structure.
For now, price is still moving inside the structure without a confirmed breakout.
Inside the pennant, I identified an important reversal area where supply has reacted twice already, creating a 2x supply reaction zone. Along with that, I also marked a reversal zone where I want to see any strong positive candle or bullish confirmation.
If buyers react positively from this area, the market could deliver a short-term upside move while still remaining inside the overall structure.
At the moment, the focus remains on how price reacts around the reversal zone before the market reveals its true direction.  Long
Long
Nifty - Weekly Review May 11 to May 15The price is moving within the range of 23900 to 24480. Wide range movement is hard to break as the price can consolidate in this range for many days, unless there is some news to move the market.
Buy above 24140 with the stop loss of 24080 for the targets 24180, 24240, 24300, 24360, 24440, 24500, 24580 and 24620.
Sell below 23880 with the stop loss of 23940 for the targets of 23840, 23780, 23720, 23660, 23600 and 23520.
As per the daily chart, the price is neutral.
Always do your analysis before taking any trade.