PRAJIND Weekly Setup: Risk Factors and Risk Management• Price above weekly 20 MA & 50 MA
• Pullback support holding: Made a tested the long term trendline and attracted good volumes and bounced back. Make a good move of 160 points (₹260-420). Has now reversed to test 20 WMA.
• Reversal was slow and took 6 weeks.
• Volumes: Has been high during the move from ₹260-420. Now again attracting volumes.
• The ₹400–405 zone is an important weekly breakout area. A weekly close above this region could open the path toward ₹430–450.
• First target is ₹447(b
Community ideas
NIFTY (M) — Beware & Be Aware: Bears Still Control the NarrativeNifty monthly structure continues to favor bears despite multiple attempts by bulls to regain control.
• Ichimoku alignment remains incomplete for bulls
• Price remains below key Ichimoku equilibrium levels
• Flat Tenkan overhead continues to attract price and act as resistance
• Price action stretched from current cloud top
• Until bulls manage a decisive monthly close above the flat Kijun and Tenkan, rallies tend to be corrective than impulsive
Conclusion
The market is currently caught in
Oil India Ltd (1W) – Ascending Triangle Pattern 5June26Weekly Chart – Ascending Triangle Formation
On the weekly timeframe, Oil India is forming a clear Ascending Triangle pattern.
• Rising trendline support connecting higher lows
• Flat horizontal resistance near ₹520–₹546 zone
• Price compression toward the apex
This structure typically signals accumulation and a potential bullish breakout if resistance is taken out with strong weekly closing.
The chart projects a potential upside move of ₹134.25 (~24.88%) , indicating nearly 25%
DXY — US Dollar Index Monthly Analysis, Danger Bells??Guys today something significant happened in global markets and I want you to understand exactly what it means and why it matters for you.
NDX fell 4%. US bond yields spiked. Dollar strengthened. All on the same day.
Most people see these as three separate events. They are not. They are one single story playing out simultaneously. Let me break it down.
🚨First. The Dollar Chart — 18 Years of Truth.
Look at the DXY monthly chart. The US Dollar Index has been inside a clean ascending channel sin
NIFTY Technical Analysis View — Cautious Bias Below 23,650Key Points
1. NIFTY is trading with a cautious tone
NIFTY is currently under pressure after facing selling near higher levels. The index needs to reclaim the 23,650–23,700 zone to improve short-term sentiment.
2. Immediate resistance is near 23,650–23,850
The first resistance zone is placed around 23,650–23,700. If NIFTY sustains above this range, the next upside levels to watch are around 23,850–24,050. A close above 24,050 would strengthen the bullish setup.
3. Key support is near 23,
Greenply : FLAG & POLE📈Greenply Industries – Technical Structure
🔍 Key Technical Observations:
✅ Price 20 EMA & 50 EMA ke upar sustain kar raha hai
✅ Fibonacci 0.618 level (~275) reclaim hua
✅ Higher low formation developing
✅ Volume + momentum improving
————————————————————
🎯 Trade Setup
Buy Zone: ₹270–276
Stoploss: ₹244 (daily closing basis)
Targets: 🎯 TGT 1: ₹325 / 🎯 TGT 2: ₹351
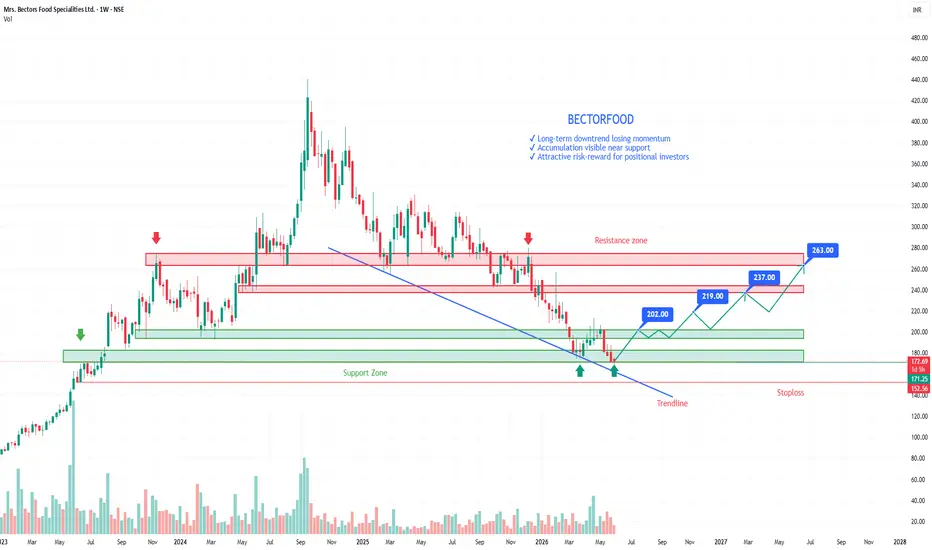
BECTORFOOD: Demand Zone Reversal | Positional Upside Towards 263BECTORFOOD is showing signs of a strong reversal after a prolonged correction, with price currently trading near a key multi-year demand zone.
Entry Zone: 170–173
Why I'm Bullish:
✔ Strong demand zone at ₹175–₹200 with multiple successful retests
✔ Price finding support near long-term trendline confluence
✔ Higher-low structure indicating weakening selling pressure
✔ Signs of accumulation near the lows
✔ Favorable risk-reward for positional investors
Targets:
🎯 ₹202 → ₹219 → ₹237 → ₹26
Multi Year Breakout [20 Years]- FCX
1⃣ Pattern Structure & Breakout Development 📈
📐 Pattern Identification:
FCX has given a powerful Multi-Year Horizontal Resistance Breakout on the monthly chart. This is a long-term continuation breakout, where the stock has finally crossed a resistance zone that had been active for almost two decades. The key breakout area is around $58–60, which acted as a major supply zone multiple times in the past.
This type of breakout is important because the market has spent many years absorbing sellers
Nifty at a Critical Crossroad: Bounce or Breakdown?Nifty is currently trading near a major support zone after facing multiple rejections from a falling resistance trendline. The chart clearly shows a series of lower highs, indicating that sellers continue to defend higher levels aggressively. At the same time, buyers have repeatedly stepped in around the 23,200–23,300 support region, making this one of the most important short-term levels on the chart.
The recent decline pushed Nifty back into this demand zone, where a strong intraday recovery
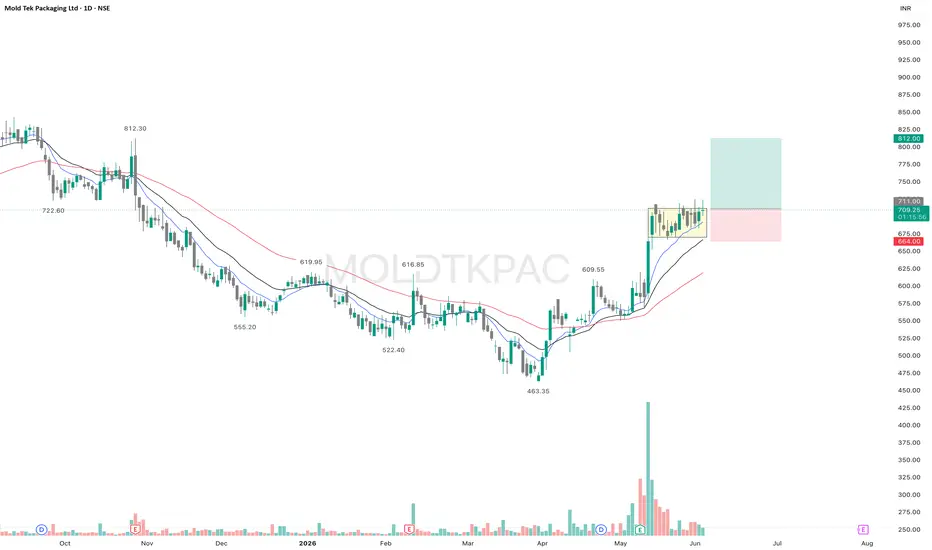
MOLDTKPAC - Consolidation after DisplacementMOLDTKPAC is showing a bullish structure on the daily chart with a clear higher high–higher low formation.
After the strong displacement move in early May, backed by a significant surge in volume, the stock has entered a healthy consolidation phase near its recent highs. Rather than witnessing aggressive profit booking, price has been contracting in a tight range while continuing to hold above the key EMAs.
An encouraging sign is the decline in volume during the consolidation. Strong volume o
INFY | Breakout Confirmed, Momentum Building📊 INFY | Breakout Confirmed, Momentum Building 👀
INFY appears to have confirmed an inverse Head & Shoulders breakout while reclaiming descending resistance — a development that may signal a broader trend transition after an extended corrective phase.
Trend
Bullish, with momentum and structure improving.
Structure & Price Action
The stock has formed a visible inverse Head & Shoulders pattern and moved above neckline resistance near 1206. Price has also reclaimed the descending trendline, suppo
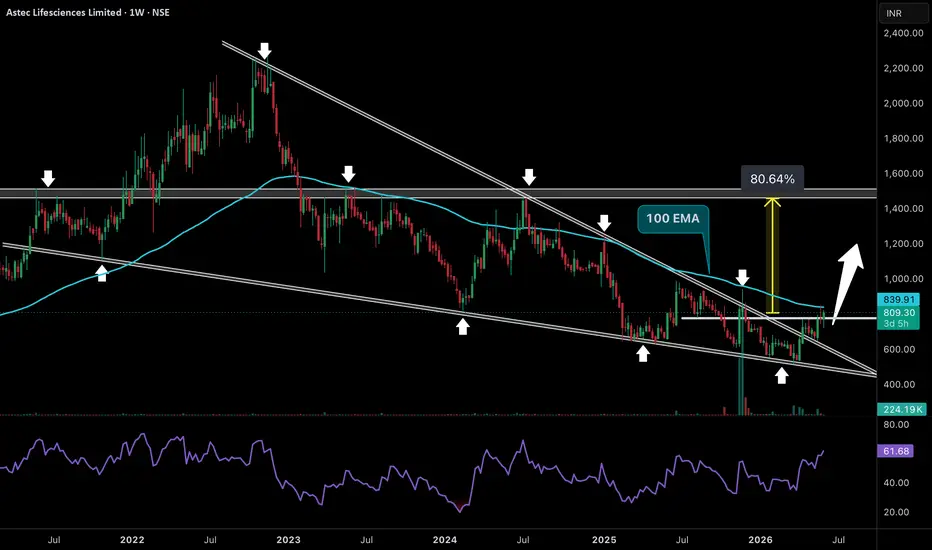
A Four-Year Base Is Starting To ReleaseFor nearly four years, Astec Lifesciences remained trapped beneath a declining supply line while market participants gradually lost interest in the stock. What most traders ignored was the steady absorption taking place near the lower boundary of the structure. Every major decline attracted buyers, selling pressure weakened over time, and the stock quietly built a foundation beneath a massive resistance ceiling. Now price has reclaimed a critical supply zone, pushed through a multi-year downtren
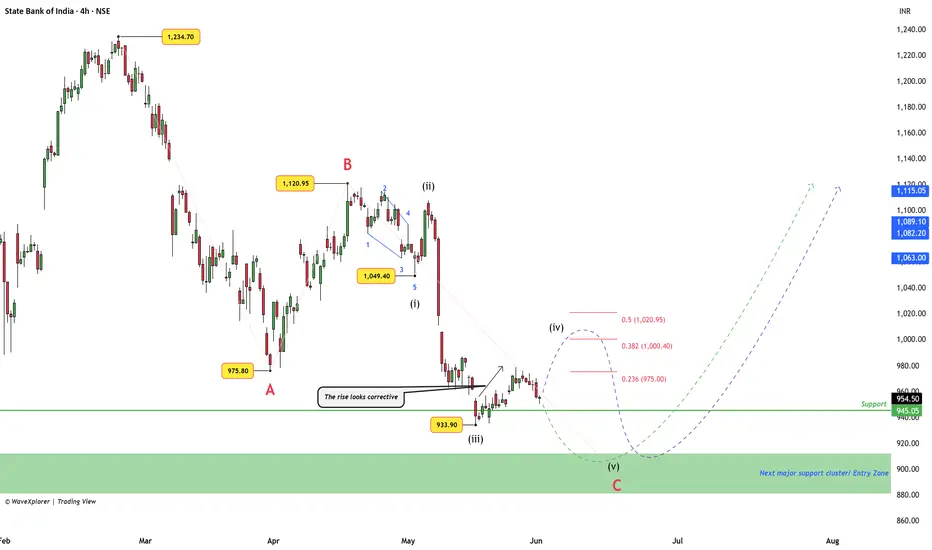
SBIN (4H): Mapping Wave C : 5-Wave Impulse v/s Complex BounceState Bank of India (SBIN) has been in a corrective phase since reaching its peak at 1,234.70 . Looking closely at the 4-hour chart, the price action seems to be carving out a larger three-part correction (an ABC structure).
Right now, we are tracking the final leg of this move, which appears to be unfolding in a five-step downward sequence. Here is a neutral, step-by-step look at the two most likely paths ahead and the exact levels where this current outlook changes.
The Near-Term Paths: Gr
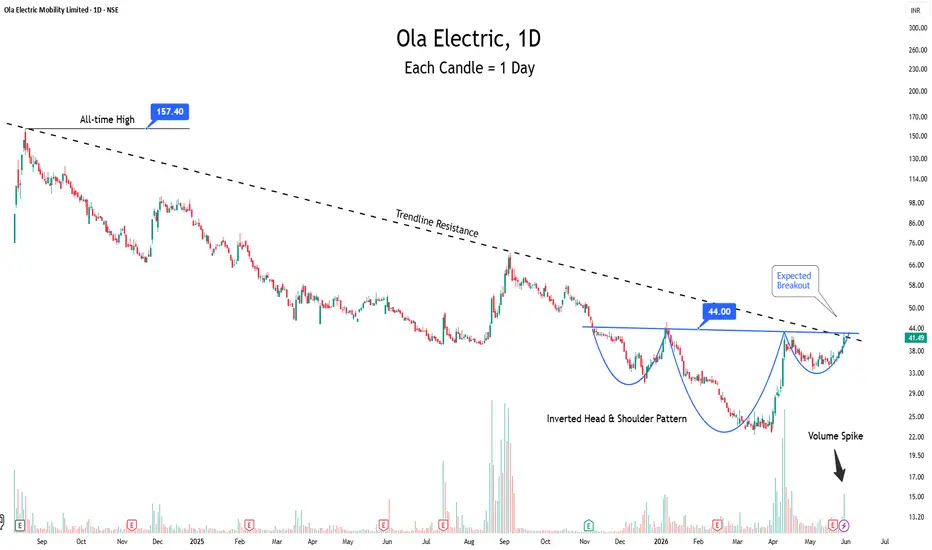
Ola Electric at a Make-or-Break Level. Is the Recovery Real?The Setup
Ola Electric has formed an Inverted Head and Shoulders over the past several months. Neckline at ₹44 coincides with the long-term descending trendline from the ₹157 ATH.
Volume spike confirms accumulation interest. Double confluence at ₹44 = key decision zone.
Fundamental Trigger
Q4 FY26 quietly showed a reset working:
Gross margin: 38.5% (vs 13.7% YoY)
Opex: cut 50% YoY
First-ever positive operating cash flow: ₹91 crore
Service TAT: 9 days to 1 day
Q1 FY27 orders expected to d
KERNEX (Weekly Chart)1. Primary Trend Analysis
The stock is in a strong long-term uptrend.
Evidence:
Price is making higher highs and higher lows.
Weekly candles are trading above both major moving averages.
Rising trendline from 2024 continues to act as dynamic support.
Conclusion: Long-term trend remains bullish.
2. Moving Average Analysis
50-Week Moving Average (Blue Line)
Price is trading well above the 50-week SMA.
SMA is sloping upward.
Indicates medium-term momentum remains positive.
200-Week Moving Aver
Gujarat Gas LimitedHello Traders
In my point of view Guj Gas Ltd formed a cup and handle pattern showing bullish trend with RSI of > 60 which is indicating positive momentum and strengthening buying interest. From a price action perspective, the stock has established key support levels around ₹309, followed by a stronger support zone near ₹282.Exponential Moving Averages (EMAs) suggests a bullish bias. A breakout above the ₹429–₹436 Gann zone may trigger further bullish momentum and hit the target price of 510 wh
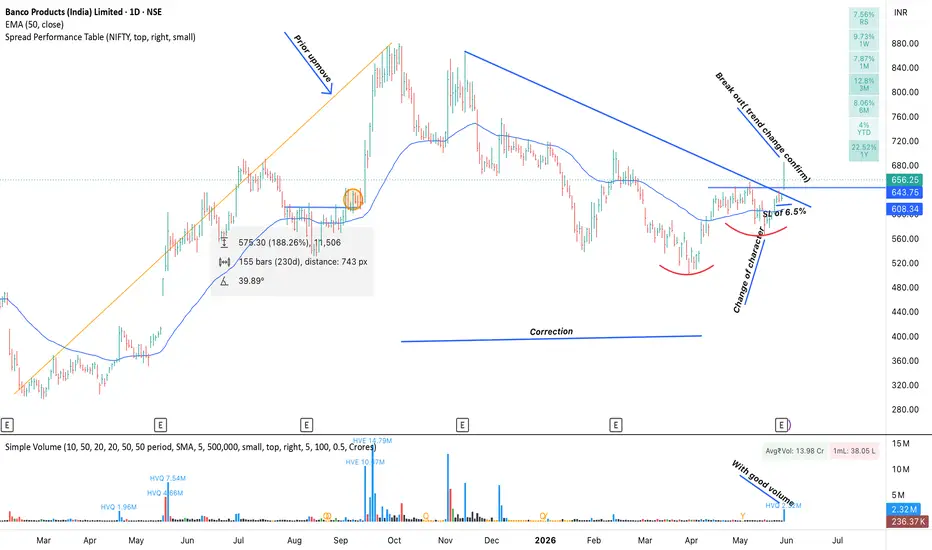
BANCO PRODUCT INDIA LIMITED ANALYSISI am going to buy this stock because of following reasons.
1. good prior up move.
2. then good correction.
3. followed by CHoCh.
4.good breakout with good volume.
5. YoY revenue and profit is up.
6. bit of an lagard in the inductry so expected to perform well.
7. ratio chart wrt nifty looks awesome.
QPOWER - Swing trade - May 2026Swing trade setup - QPOWER
IPO base breakout followed by consolidation and rounding bottom formation.
Stock gave strong breakout candle after volume contraction and accumulation.
Will look for entry on retest zone.
SL below SL zone on closing basis.
Target will be the marked target zone with minimum 1:2.5 R:R .
Recent results were strong.
Sales: 159% up YoY
Profit: 73% up YoY
Debt to equity: 0.07
ROCE: 31.5%
PEG ratio: 0.86 as per screener.in
Major concerns:
1. Huge dip in margins from
Support & ResistanceThe Mistake 90% of Traders Make
Support and Resistance are among the first things every trader learns.
Almost every strategy in trading uses them.
But here’s the problem:
Most traders draw Support & Resistance the wrong way.
That’s why many beginners experience:
* fake breakouts,
* stop loss hits,
* bad entries,
* and confusion on charts.
The truth is, Support & Resistance is not about drawing perfect lines.
It’s about understanding where buyers and sellers are active.
In this article, we’ll le
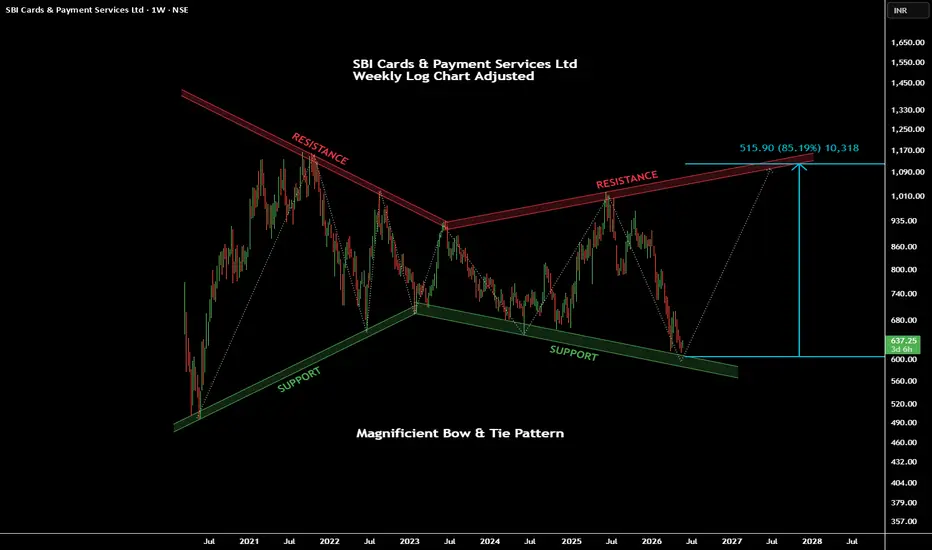
Big Pattern Observed in SBI Cards & Payments Ltd The stock is currently moving within a classic 6-year Bow & Tie pattern and is trading near a strong support zone. It appears to be in the final stage of its 8th wave formation.
A bounce back from the current support area could initiate the 9th wave, which may offer upside potential of around 80% to 100% over the next 1 to 1.5 years.
However, always use a logical stop-loss and proper risk management to protect capital.
Note: This analysis is for educational purposes only and is not intended as
ONGC mildly bullish 1 DAY chartTrend: Overall uptrend since Jan 2026 is still intact, but momentum stalled. The white trendline is the make-or-break level right now
Momentum: RSI below 50 = mild bearish momentum. But that divergence is worth watching if trendline holds
Key zones: Hold above ₹285-287 keeps the uptrend alive for a bounce toward ₹295-300. Break below trendline opens ₹270-275
Motherson. Simple chart, Holding good.Motherson. Very simple and very attractive chart pattern visible.
Do i have to say something about it.. Haha..
Lets discuss.
Multiple confirmations, Multiple Breakout.
Cup & handle, Sustaining above the multiple time checked resistance,& Consolidating.
Breakout above all these factors can be really a rally.
Target as per cup and handle ,,,... Around 190.. Hope So..
Breakout above the resistance ( Thick Black Line ) around 150.
Should consolidate above 145-150 for next leg of run..
Temp