NIFTY 50 – Multiple Bottom Reactions Near Support | Breakout Set🟢 Simple Chart Explanation:
* NIFTY is showing a strong support reaction around the 23,250–23,300 zone
* Price has taken support from this area multiple times, showing buyers are defending the level
* Market is now moving inside a tight consolidation range
* The 23,820–23,850 zone is acting as immediate resistance
📌 What Makes This Interesting?
* Multiple higher lows suggest bullish strength building
* Buyers are slowly pushing price upward after every dip
* A clean breakout above resistance
Community ideas
SEAMEC — 7 Years. One Channel. Upper Band Reached (2019–2026)Some charts demand your full attention. This is one of them.
SEAMEC has been moving inside a clean ascending channel since 2019 — seven full years. Every time price touched the lower band buyers showed up without fail. No exceptions. The structure has been respected through bull markets, bear markets and everything in between.
Now here is where it gets interesting.
From the 2025 low of ₹800 the stock has rallied 113% in under 12 months — straight into the upper boundary of that 7 year channel.
BIOCON- MULTIYEAR BREAKOUT SETUP 📊 BIOCON – Next Week Trade Setup
BIOCON has entered a decisive technical zone and stands out on the weekly chart as price attempts to challenge a long-standing resistance area after a prolonged phase of consolidation.
🔹 **Chart Structure**
Price has gradually recovered from lower levels and is now testing a major resistance zone that has capped previous advances. The broader structure suggests improving momentum with the possibility of a larger breakout move if confirmation sustains.
🔹 **Tech
GAIL — Weekly Chart Analysis 24May26NSE:GAIL GAIL (India) Limited is currently attempting to recover after taking support from a major weekly demand zone near ₹135–140. The stock had been under pressure for several months, but recent price action suggests buyers are slowly regaining control from lower levels.
The highlighted support/breakdown zone has historically acted as a strong accumulation area, and the current rebound from this region may indicate the beginning of a medium-term recovery phase.
Current Market Structure
Pr
Firstsource looks to be cranked up for ATH levels!Uncertainty in global economy is causing a slowdown in overall IT industry.
However, FSL is looking all good for a strong reversal.
The volume at 50% Fib retracement support is an indicator of the same.
Q4 Revenue & EBITDA posted by company is at record high.
Stock can be one of the earliest stock to reach ATH if IT sector starts to recover. Don't miss to keep this in your watchlist.
The risk is around 15% and reward is more than 50%.
This is not a recommendation and is strictly for educationa
ENDURANCE - weeklyTrend (EMA + Structure): The weekly trend is turning strongly positive. Price has reclaimed the short-term moving averages and is now trading above them. The recent candles show a breakout from a falling trendline, which indicates a possible end of the correction phase and the beginning of a fresh upward move.
Price Structure: The stock had a corrective phase after the previous rally and formed a descending structure. Recently, price broke above the downward trendline and also moved above the 0
$WLD Down 98% From ATH: Is This The Setup For A Generational Ent#WLD Is Trading Deep Inside A Macro Descending Channel, Sitting In A High-Risk Accumulation Zone After A Brutal ~98% Drawdown From Its ATH. Price Is Now Pressing Against A Critical Accumulation vs Invalidation Level.
Technical Structure
✅ Cycle ATH: $11.97 (Macro Top)
✅ Macro Drawdown: -98% Into Current Range
✅ Multi-Year Descending Channel With Clean Lower Highs And Lower Lows
✅ HTF Accumulation Zone: $0.26 To $0.18
✅ Price Compressing Near Channel Support (Possible Base Forming)
✅ Repeated Re
DOW jones Trend Analysis DJIA Weekly Chart Analysis
The global market has gone through major geopolitical tension because of the conflict involving the US, Iran, and Israel. Commodity prices have already seen a strong rally, and now investors are again shifting focus toward equity markets, especially the US market. This movement is also creating positive sentiment across global markets, including India.
On the weekly chart, the Dow Jones is trading near an important resi
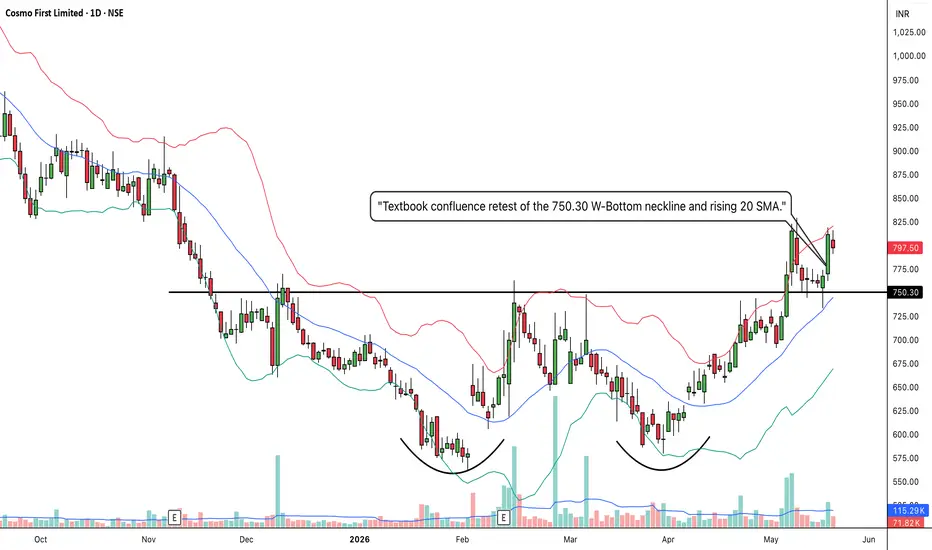
COSMOFIRST: Massive W-Bottom Base and Textbook Confluence Retest1. The Macro Perspective: The Washout and the W-Bottom
I am taking a LONG bias on Cosmo First Limited (COSMOFIRST) on the daily (1D) timeframe.
When analyzing pure market structure, the most reliable reversals are born from deep, agonizing accumulation phases. Look at the structural development on the lower half of this chart. After suffering a brutal markdown phase that dragged the price into the 500s and completely washed out weak hands, heavy institutional capital stepped in. I have explicitl
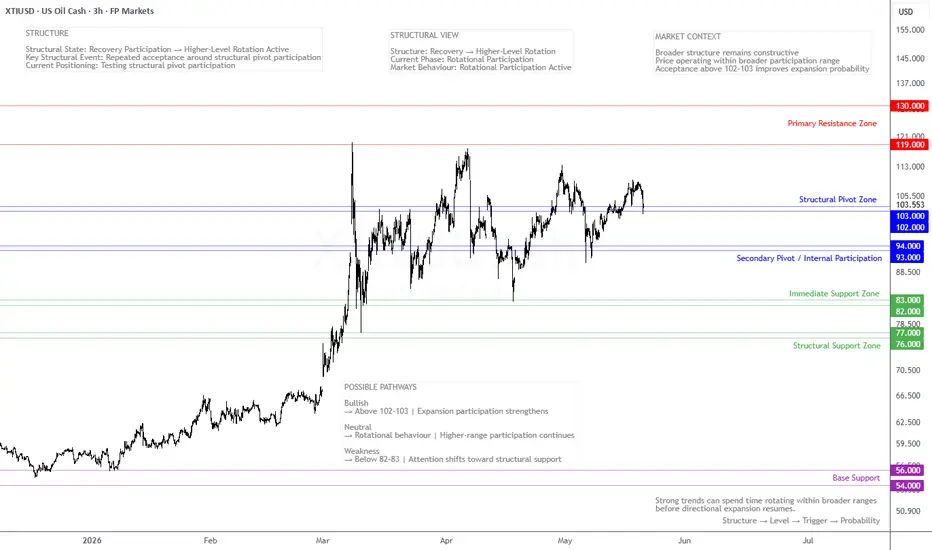
XTIUSD /US Oil: Structural Pivot Participation Under ObservationUS Oil continues operating within a broader recovery structure while current participation remains rotational around a key structural pivot region.
Price is currently testing the 102–103 participation zone after repeated rotational behaviour within a higher-range structure.
Structure:
Structural State: Recovery Participation → Higher-Level Rotation Active
Key Structural Event: Repeated acceptance around structural pivot participation
Current Positioning: Testing structural pivot participatio
Manappuram Preparing Fresh ExpansionManappuram Finance Ltd. | Daily Timeframe
Price has finally reclaimed a major multi-month resistance zone after spending a long period in rounded accumulation. The structure reflects gradual strength development, where every corrective phase continued to print higher lows, a sign of sustained buying interest on the higher timeframe.
The recent pullback near resistance also appears constructive rather than weak, forming a smaller continuation structure just beneath the breakout area. This type
NSE GAIL May Be Preparing for Its Next Major Bullish MoveGAIL (India) Limited is currently showing a long-term bullish Elliott Wave structure on the daily chart. The stock appears to have completed a major corrective Wave (4) after a strong impulsive Wave (3) rally. The reaction from 0.618 region strengthens the possibility that Wave (4) may already be complete.
Targets: 259 - 293 - 337
Failure to hold above the recent Wave (4) region could delay or weaken the bullish Wave (5) scenario.
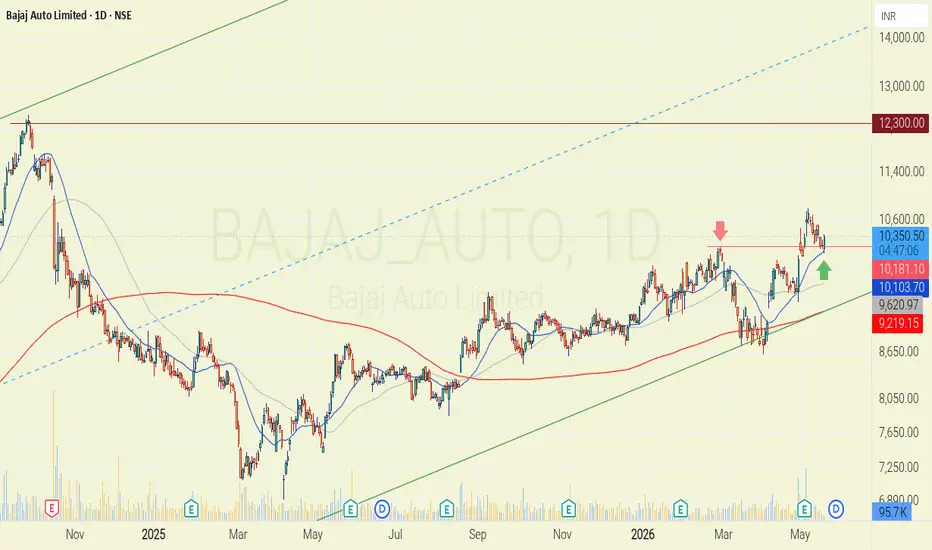
Bajaj Auto resistance to supportThere is confluence of 2 very good setups.
1. Earlier resistance of 10180 is now acting as support.
2. 10180 is also a 20D SMA.
A good low risk high reward swing trace is possible which can play out in few weeks.
Likely target of ATH can be considered.
SL below 10100 would be good.
Volatility Contraction Pattern - Hexaware Technologies Volatility Contraction Pattern (VCP) is a setup popularized by Mark Minervini, where price volatility gradually contracts before a potential strong breakout. It reflects reduced selling pressure and accumulation by strong hands before expansion in price.
Hexaware Technologies is currently showing a strong VCP structure with multiple bullish confirmations on the hourly chart.
The stock has formed three successive rounding bottoms, where each correction is nearly 50% smaller than the previous on
RSI Continuation Secrets: The Power of Positive ReversalsIf you are like most traders, you probably have the RSI indicator on your chart right now. And if you use the RSI, you have likely spent countless hours hunting for "divergences" to catch the exact top or bottom of a market.
We all love the thrill of catching a trend reversal. But let’s be honest: markets trend much longer than we expect, and trying to pick tops can be exhausting (and expensive).
What if, instead of using RSI to figure out when a trend is ending, you used it to spot when a str
US market about to witness small correctionDow Jones Elliott Wave Analysis | 4H Chart
The Dow Jones Industrial Average (DJIA) appears to have completed a strong five-wave impulsive rally from the recent lows, with price now approaching a critical decision zone near channel resistance.
The current structure suggests:
Waves (1) through (5) have largely completed within a rising wedge / ending diagonal formation.
Price faced rejection near the upper trendline after Wave (5), indicating weakening bullish momentum.
The recent sharp decline
BOSCH LIMITED HAVING DOUBLE PATTERNBOSCHLTD (1D): Textbook Inverse Head & Shoulders at Major Channel Support
Bosch Limited (BOSCHLTD) is displaying a highly precise, high-probability bullish reversal setup on the daily time frame.
Technical Overview:
Ascending Channel Baseline: The stock has been respecting a well-defined, multi-month Ascending Channel. The recent correction found perfect buying interest right at the lower support boundary of this channel.
Inverse Head & Shoulders Pattern: Right at this major confluence zon
NIFTY -Short for 10 % 1. Lower High Formation
Price failed to create a new higher high near previous resistance, showing weakening bullish strength.
This shift in structure suggests increasing probability of a bearish reversal.
2. EMA Resistance & Bearish Crossover
NIFTY faced rejection near the 18-week EMA while 6 EMA crossed below 18 EMA.
This confirms weakening momentum and growing bearish trend control.
3. Failed Breakout Structure
Price could not sustain above the breakout zone and closed weakly on weekly b
AUDUSD_DThe AUD/USD pair appears to have completed a five-wave Elliott structure on the Daily timeframe, while a clear bearish divergence is visible on both the Daily and Weekly timeframes.
In addition, a bearish Butterfly harmonic pattern is forming on the Weekly chart, increasing the probability of a medium-term downside correction.
As long as price remains below the invalidation level, the market outlook stays bearish, and we expect a decline toward the following targets:
0.69229
0.68254
0.67055
BUY TODAY SELL TOMORROW for 5%DON’T HAVE TIME TO MANAGE YOUR TRADES?
- Take BTST trades at 3:25 pm every day
- Try to exit by taking 4-7% profit of each trade
- SL can also be maintained as closing below the low of the breakout candle
Now, why do I prefer BTST over swing trades? The primary reason is that I have observed that 90% of the stocks give most of the movement in just 1-2 days and the rest of the time they either consolidate or fall
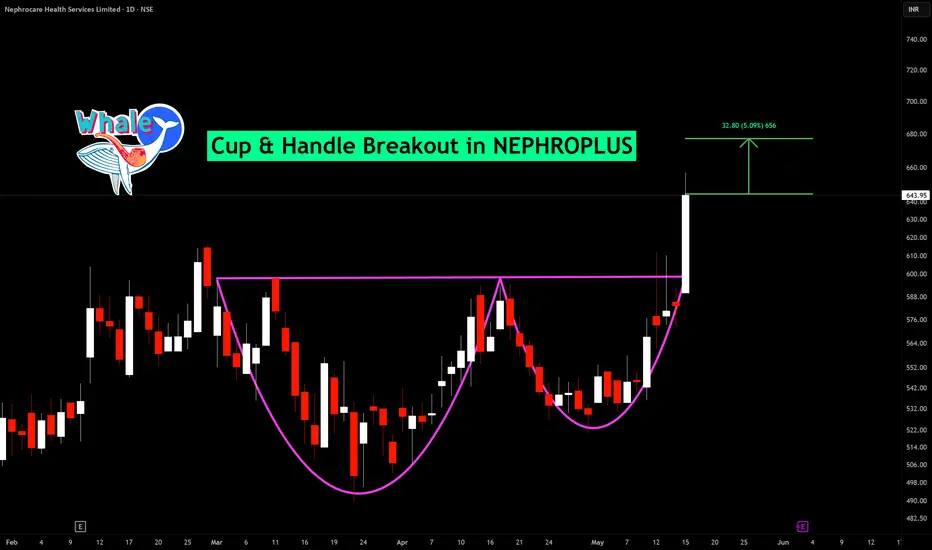
Cup & Handle Breakout in NEPHROPLUS
BUY TODAY SELL TOMORROW for 5%
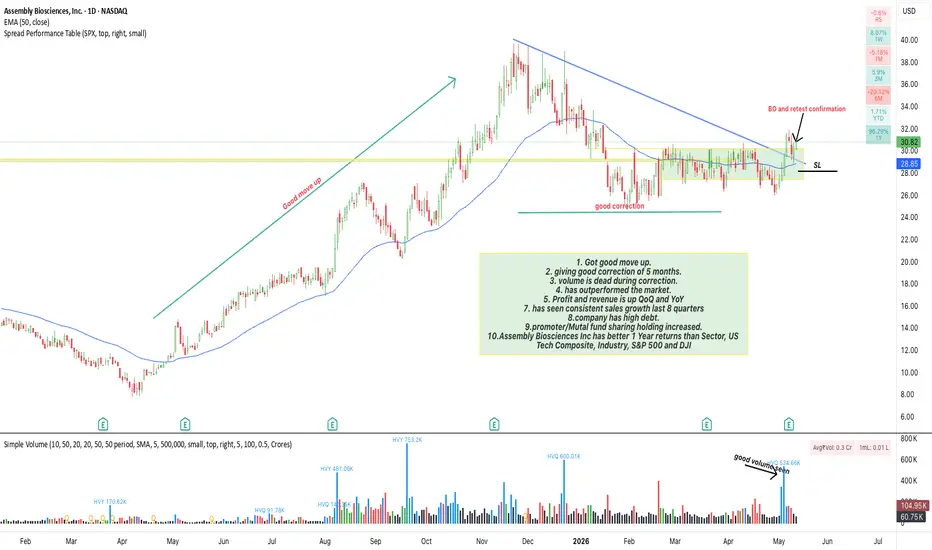
Assembly Biosciences Inc(ASMB) Analysis1. Got good move up.
2. giving good correction of 5 months.
3. volume is dead during correction.
4. has outperformed the market.
5. Profit and revenue is up QoQ and YoY
7. has seen consistent sales growth last 8 quarters
8.company has high debt.
9.promoter/Mutual fund sharing holding increased.
10.Assembly Biosciences Inc has better 1 Year returns than Sector, US Tech Composite, Industry, S&P 500 and DJI.
I am managing my risk with SL of 7.3%,
PS: This is not tip or recommendation but only for
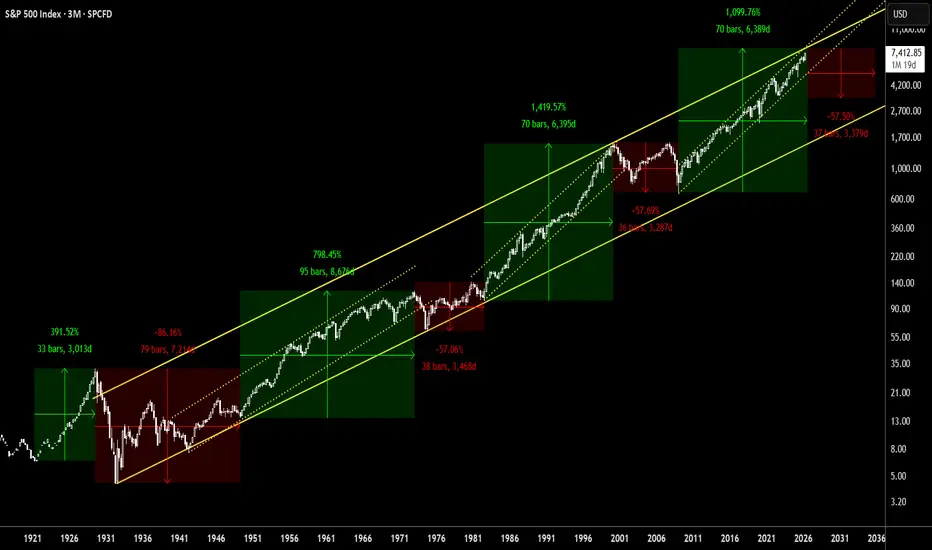
Lost Decade for the S&P 500 coming?The fierce rally in the SP:SPX is rapidly approaching upper part of the century-old trend line, as well as a decade-and-half old trend line.
This is an extremely rare moment where the froth in the markets are at the dangerously high levels. If history patterns are to be believed, we may enter a 9-10 years of lull markets with non-positive returns.
At between 7500-8000 level, the index may start going sideways before undergoing its overdue correction. Thus, 3500-8000 may become a large si
Ajanta Pharma (D): Bullish (Apex Squeeze & Pre-Breakout Setup)Timeframe: Daily | Scale: Linear
Ajanta Pharma is coiled in a massive compression zone, tightly squeezing against key historical resistance levels. Backed by excellent quarterly earnings and strong institutional accumulation, the probability of an upside breakout is highly elevated.
🚀 1. The Fundamental Catalyst (The "Fuel")
The rising volume and persistent upward pressure are directly linked to the recent Q4 performance:
> Earnings Beat: Strong top-line and bottom-line growth confirms t
Nifty at a Crucial Retest Zone: Bounce Back or Bigger Breakdown?Nifty is currently trading at one of the most important technical zones on the weekly timeframe. After facing rejection from the major resistance area near 26,000, the index witnessed a sharp correction and has now returned to its long-term rising support trendline. Interestingly, the previous support area is now behaving like resistance, which makes this region a critical decision point for the market.
The highlighted zone around 23,000–24,000 will likely decide the next major move. If buyers