Sona BLW Precision cmp 593.85 by Weekly Chart view since listedSona BLW Precision cmp 593.85 by Weekly Chart view since listed
- Support Zone 500 to 550 Price Band
- Resistance Zone 605 to ATH 655 Price Band
- Bullish Rounding Bottom with VCP around Support Zone
- Rising Support Price Trendline shouldering the price up move
- Breakout from Falling Resistance Trendline has sustained good
- Volumes are spiking regularly above the average traded quantity
Community ideas
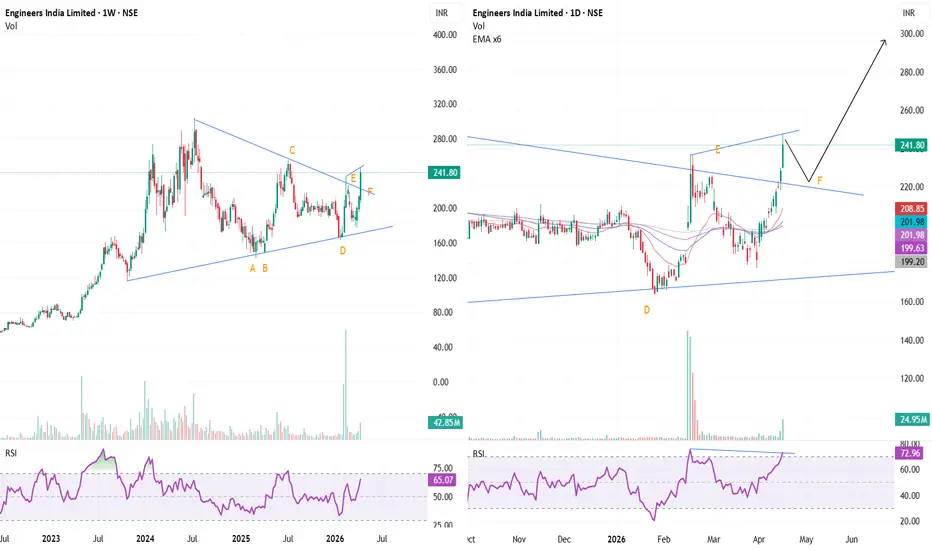
ENGINERSIN - strong chart for investmentNSE:ENGINERSIN
Price above all Major EMA/s on daily and weekly
Price was sustain even in panic global scenario
RSI on weekly showing strength
RSI on daily showing overbought with divergence
Based on RSI, we can conclude the price have good strength as per weekly but as per daily it may take a little pullback despite of altering or impacting on wRSI.
This pullback may be good idea to get in to the trade.
Warning:
Trading without knowledge depth, experience and proper risk manage
NMDCNMDC is coming out of consolidation after long 4 months. So now as long as it is above 82 then it seems it may continue to rise higher and higher. The high since 2010 is nr 102. SO if it rises above 102 then there is v high probability that it will enter in to long term bullish zone and have potential to give multi fold return from there on. Keep it in watch-list and grab the opportunity whenever risk-reward is in your favor.
Dual Scenario: Fundamental vs TechnicalYen on High Alert
Japanese Finance Minister Katayama issued a fresh warning on April 15, 2026, stating she is prepared to take "bold action" to support the YEN.
- The USD/JPY pair is currently hovering around 158–159, a level that has historically triggered direct market intervention by Japanese authorities.
---------------------------------------------------------------------------------------
The 4H chart shows 2 scenarios about the USD/JPY possible price movement
1. BLUE DOWNWARD PROJEC
Gold at Decision Zone – Rejection Could Trigger Drop to 4700.Hello traders, sharing how I see Gold (XAUUSD) developing currently.
Market Analysis:
Gold is trading within a descending channel on the M30 timeframe, reflecting a short-term bearish structure with consistent lower highs and lower lows. This indicates controlled downside pressure while price respects the channel boundaries.
Price is now approaching the upper boundary near 4790, a zone where selling interest may emerge again. This level is acting as dynamic resistance within the channel and co
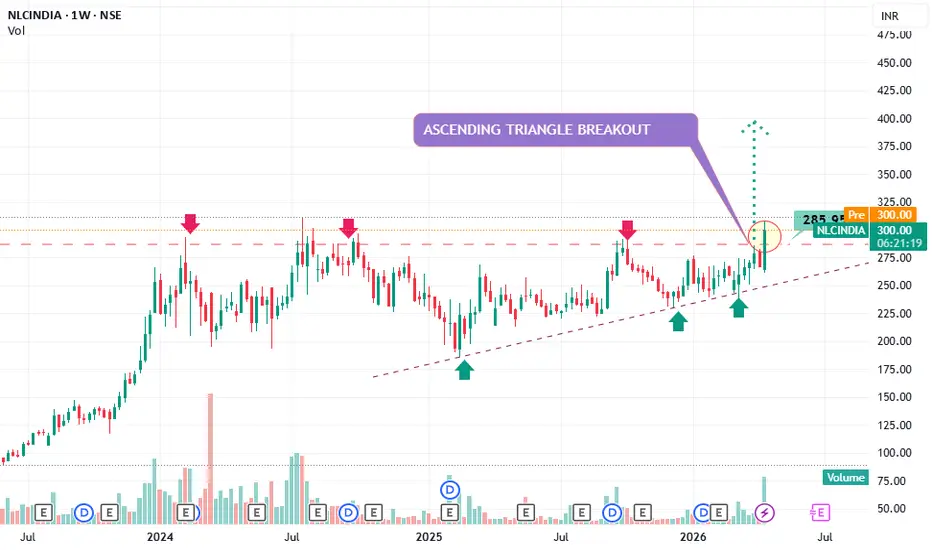
Breakout structure on NLC India Ltd -Ascending Triangle BreakoutFlat resistance zone: ~₹285–₹290 (multiple rejections marked by red arrows)
Rising trendline: Higher lows (green arrows) showing accumulation
This pattern signals buyers getting stronger over time
👉 Classic bullish continuation setup.
Breakout Confirmation
Price has closed above resistance (~₹285)
Strong bullish candle with volume support (46M+)
This is not a fake breakout — structure + volume both aligned
Targets (Based on Pattern Projection)
Immediate target: ₹320–₹330
Measured move target: ₹
Apollo Pipes – Ready for next leg?Relative strength started improving after the trendline breakout.
If strength sustains above 600, ATH looks possible.
Quick fundamentals:
• Operating in PVC pipes (infra + housing + agri play)
• Revenue ~ ₹1000+ Cr, profitable business
• Among top players in piping solutions in India
• Beneficiary of infra, water management & real estate demand
Watching for continuation of strength.
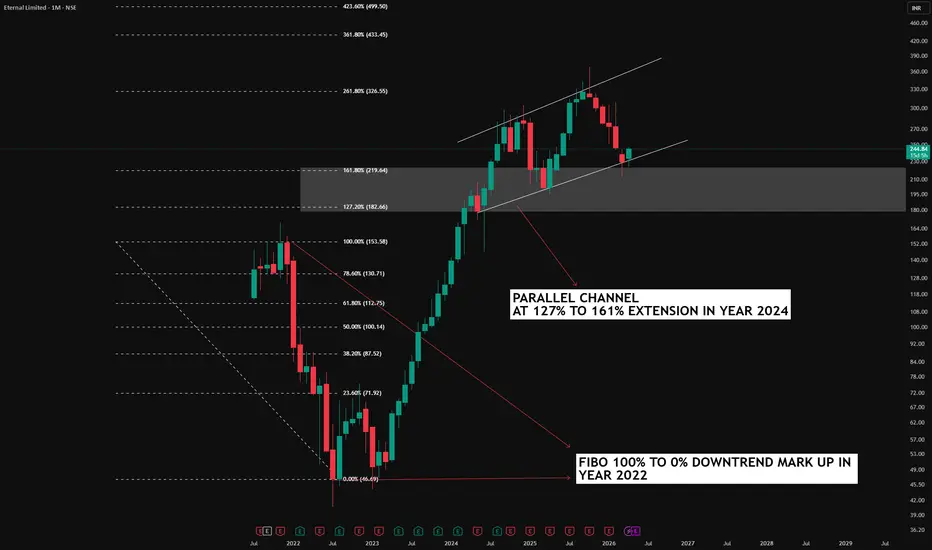
When Fibonacci Extension Meets a Parallel ChannelFibonacci retracement and extension are tools used to map possible support, resistance, and price projection levels based on a prior move. In this chart, the Fibonacci extension was drawn from the top to the bottom of the 2022 move, and the key extension zones like 127% and 161% were used as reference areas where price could react later. These levels do not predict the market with certainty, but they help highlight areas where price may pause, reverse, or continue.
A parallel channel is a tr
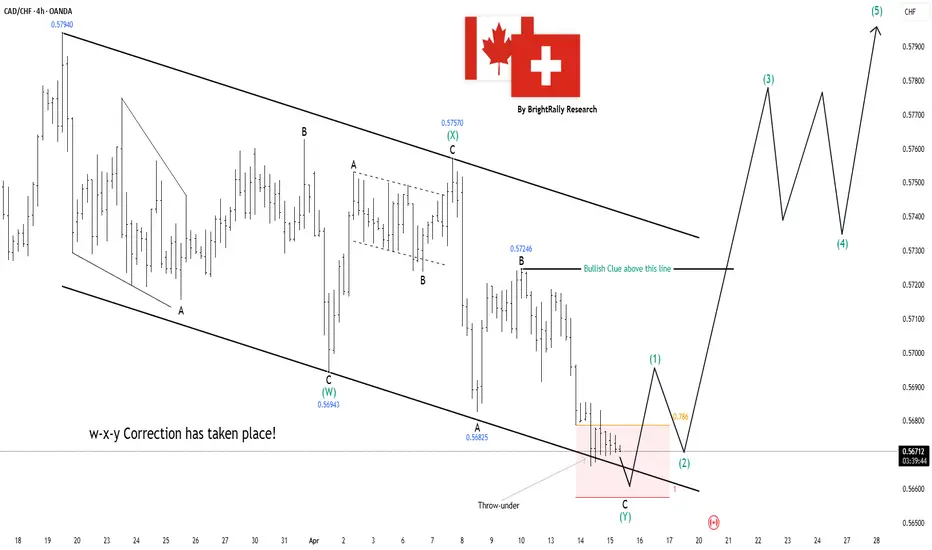
CADCHF: Bullish Setup After WXY CompletionCADCHF has likely finished its correction phase (called a W-X-Y in Elliott Wave), which basically means the market has already gone through a messy sideways/down move and may now be ready to trend. Price recently dipped below support (a fake breakdown) and quickly reacted, suggesting sellers are losing control.
Right now, the market is trying to form the first move up (Wave 1), but it’s not confirmed yet. For real strength, currency needs to break and hold above the marked resistance level. Bre
Adani Enterprises at Breakout Point: Big Move Incoming?Adani Enterprises is currently trading near a critical resistance trendline, where price has faced multiple rejections in the past. After a prolonged downtrend, the stock is now attempting to reverse and approach this key breakout zone around 2100–2150 levels. This area is acting as a decision point for the next major move.
If the stock manages to give a strong breakout with confirmation above the resistance, it can trigger a fresh bullish rally. In that case, upside targets are placed around 2
swing trade as per VMAP today & yesterday looking at current price action on 1hr it's look like strong upward move can be possible to see with good risk to reward so using anchored VMAP try to catch upward swing move rest all marking done in the chart , this is my view and sharing to improve mistake don't jump to trade as per my view open to know your point's to connect trade with logical approach
GOLD BOUNCES FROM GAP DOWN Back at 4760 Resistance AGAIN. Gold gapped down on the failed Islamabad talks and Trump Hormuz blockade dipped to 4642 yesterday and breakdown from support trendline. But buyers bought the dip and pushed price all the way back to 4766. Right back at the same 4760-4800 resistance that has rejected every attempt for over a week now.
Bulls keep knocking. Door keeps shutting.
The blockade initially sent oil and dollar higher that's bearish for gold. But gold recovered almost the entire drop. The market is getting desensitized to
TRIPLE DEMAND CONFLUENCE! Is SWAN CORP Setting Up for REVERSAL📊 Big Picture – Where Smart Money is Positioned 📊
This setup stands out because it’s not based on a single timeframe view — it’s a multi-timeframe institutional alignment where demand zones are stacked across Monthly, Weekly, and Daily charts.
Price has reacted from this region with strength, suggesting that this is not just a passive support — this is an active demand zone where buyers are stepping in.
This is the kind of location where markets often transition from bearish to accumula
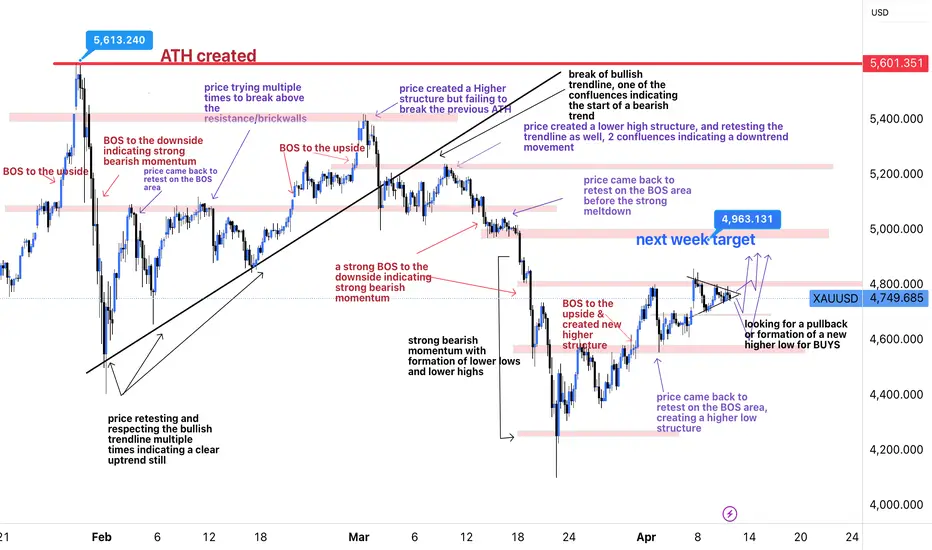
XAUUSD TRADE IDEA FOR 13-17TH APRIL 2026After the strong sell-off, price formed a base and started creating higher lows, showing early signs of bullish strength. We also saw a break of structure to the upside, indicating a shift in momentum.
Right now, price is consolidating in a tight range, which usually means accumulation before the next move. As long as this higher low holds, the bullish momentum is still valid.
Bias: BUY
I’m expecting price to continue pushing up from this area towards the 4963 resistance/target zone.
If pric
Accumulation at Demand — Reversal BuildingThe stock continues to hold its key demand zone around 400–420, with multiple rejections at lower levels indicating strong buying interest. Recent price action shows tightening near support, suggesting that selling pressure is gradually exhausting while stronger hands quietly accumulate positions.
However, the broader structure remains range-bound, with resistance zones still intact above. Any move toward 550–600 will be a key test, and only sustained strength beyond that can shift the structur
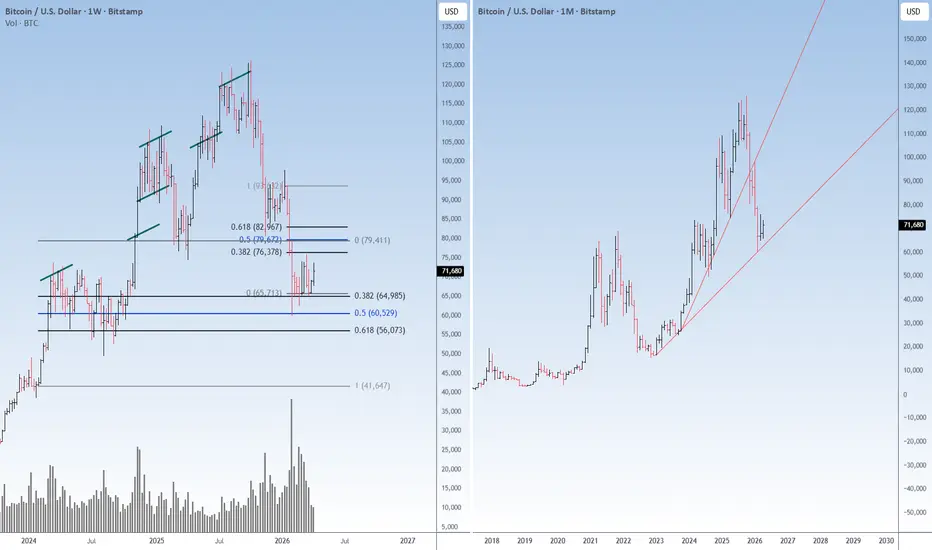
More correction in the cryptoBTCUSD CMP 71560
The rally from support has been very feeble. Its definitely corrective. What this means is the correction is still not over.
Fib- the rally to 76400 is just 38.2% of the current swing. This means the trend is still very weak.
Volume- I missed the volume last time around. The high rise in the volume is an indication that the bottom is still not in place.
Conclusion- the correction is likely to resume. The minimum correction from here is 56K. Hence will advice to exit t
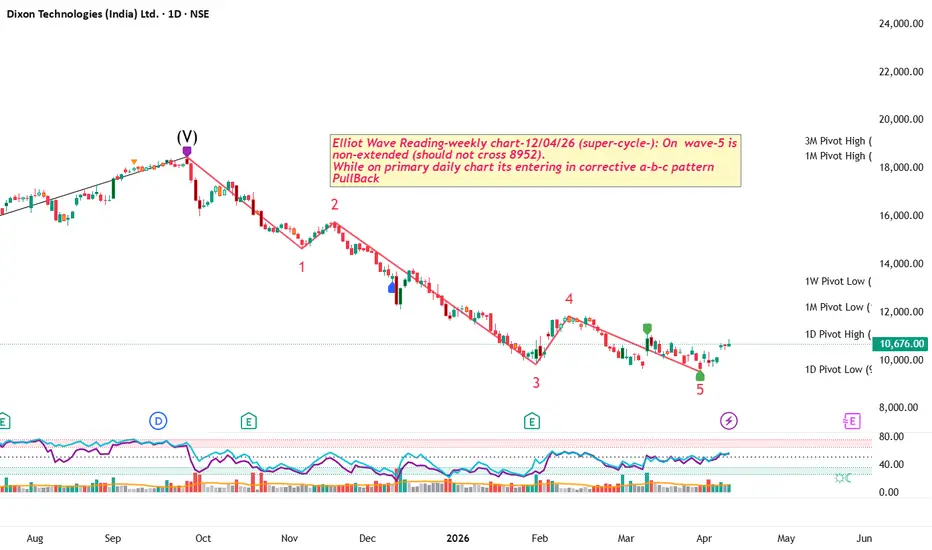
DIXON-Elliott Wave + Fib Confluence | Sell on Rise SetupDixon Technologies (India) Ltd; CMP: 10676.00; Tmeframe: Daily (with Weekly context)
🔍 Structure Insight
Weekly chart suggests Wave (V) TOP already in place
Price now in higher timeframe corrective phase (A-B-C)
Daily chart shows complete 5-wave impulsive decline
👉 Current bounce likely a corrective pullback, not trend reversal
📊 Key Levels to Watch
🔹 Support Zone: 9,600 – 10,000
🔹 Resistance Zones (Fib):
11,100 (0.236)
12,200 (0.382)
14,000 (0.5 – strong supply)
📈 Indicator View
RSI:
Bullish move expected on TCSThe NIFTY IT sector which has been the worst performing sector has eventually slammed into valuations which are as low as the prices from August 2023.
If we look at the Heavyweights, TCS seems to be the one which is lagging behind.
Last week, we had INFY make a sharp up move from the Lows.
Hence, I'm anticipating TCS to not hold back now. We can see a sharp up move on TCS this Monday.
Notice how the stock has reached a strong support zone and is now failing to make new Lows. Eventually, all s
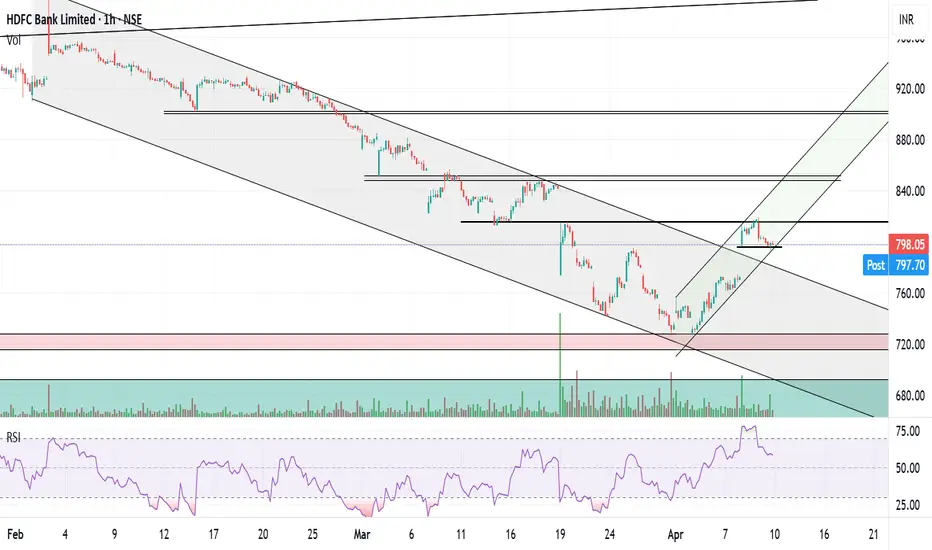
HDFCBANK - BULLISHHDFCBANK was moving in a descending zone, but it has now moved out and is now in an ascending zone. in the last 1 hour candle a hammer has been clearly formed - confirming the zone. the volume in the last 1 hour candle -which was green - was also much higher than average hourly volume.
the formation is also similar to Cup & handle where the handle formation is expected
Target 1 - 2 trading days - 815
target 2- 4-5 trading days - 850
target 3 - if it holds above 850, then 900
Stoploss - 790
*th
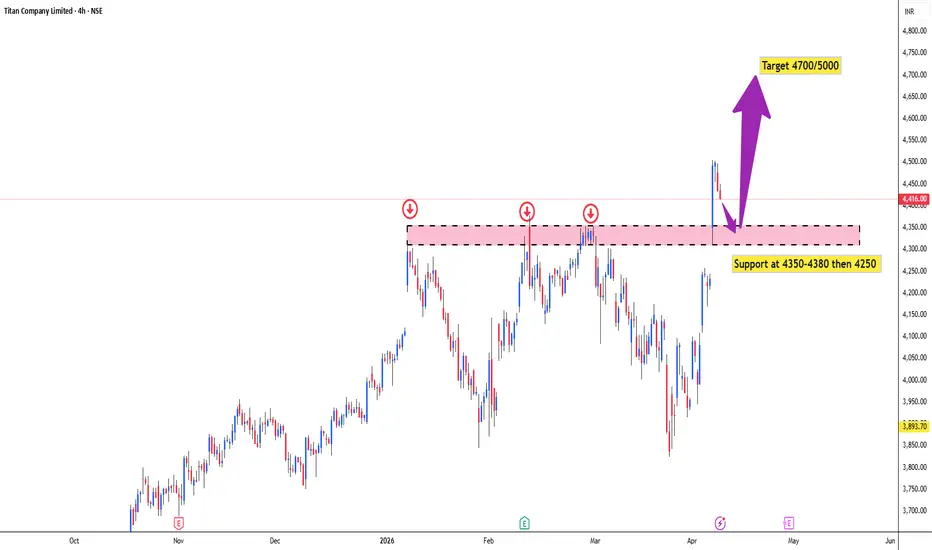
#Titan cash - Fundamental and technical view given belowTitan Company – Simple Fundamental & Technical Analysis
Fundamental View
Titan Company is one of India’s strongest consumer brands under the Tata Group umbrella. It operates mainly in jewellery through Tanishq, along with watches, eyewear, and emerging segments like wearables. The biggest strength of Titan is its brand trust and pricing power, especially in the jewellery business where organized players are gaining market share from unorganized ones.
Revenue growth has been consistently stron