BHARTIARTL — Descending Triangle Testing Breakout on Daily ChartOverview
Bharti Airtel has spent the last five months carving out a textbook descending triangle on the daily chart, and today's session is where it starts getting interesting. Price rallied 1.89% off a strong base, pushing right into the resistance line that's been capping every rally since February. If this holds, we could be looking at the start of a fresh leg higher after months of range-bound grinding.
Pattern Explanation
The structure here is clean: a descending resistance line connecting the February high (2057) down through a series of lower highs, meeting a rising support line built off higher lows since the May bottom (1740.50). That's a classic descending triangle — lower highs compressing into a flat-ish floor, which usually resolves in the direction of the prevailing higher-low structure once broken.
Today's candle closed right at the confluence of that resistance line and the 1910-1913 zone, which has acted as a pivot multiple times since June. This is the first real test of the trendline with strong volume and price momentum behind it, not just a wick poking through.
Key Levels
Breakout Trigger Zone: 1910–1913
Invalidation: 1856.85 (below recent swing structure)
Target Zone: 1999.65
Structure Low / Pattern Origin: 1740.50
Distribution Top: 2057
Risk-to-reward from current levels works out to roughly 1:1.7, which is a reasonable setup for anyone tracking this on the daily timeframe.
Scenarios
Bullish scenario: A daily close above 1913 with follow-through volume opens the door toward 1980, and eventually the 1999–2000 target zone. Watch how price behaves around the 1940-1960 area — that's where the 200 EMA region previously acted as resistance during the March-April decline, so some hesitation there wouldn't be surprising.
Bearish scenario: If price fails to hold above 1910 and slips back under the rising support line (currently tracking near 1885-1890), the triangle thesis weakens and a retest of 1856-1860 becomes likely. A break below 1856.85 would invalidate the setup entirely and put the May-June range lows back in play.
Beginner's Lesson
A descending triangle is one of the more reliable continuation/reversal patterns to learn because it tells you two things at once: sellers are getting weaker (lower highs, but shallower each time) while buyers are getting stronger (higher lows). When those two lines converge, it's usually a sign that a decisive move is close. The key skill isn't spotting the pattern — it's waiting for the actual break with volume, rather than jumping in on the first touch of the resistance line. Airtel gave several false pokes at this trendline back in May and June that faded; today's move has more conviction behind it, which is what separates a real breakout attempt from noise.
Conclusion
Bharti Airtel is at a genuine decision point after months of consolidation. The structure is clean, the levels are well-defined, and today's price action gives the bulls their strongest case yet. As always, this is for educational and analytical purposes — confirm with your own risk management and position sizing before acting, and keep an eye on the 1910-1913 zone over the next couple of sessions to see if this breakout has legs.
Not investment advice. For educational purposes only. Please consult your financial advisor before making any trading decisions.
Community ideas
ITC Ltd : ( 1 M )📉 Chart Analysis
👉 Major bearish breakdown: ITC has broken below a long-term ascending support trendline and triangle pattern. This is a significant negative technical signal.
👉 Strong selling pressure: The large bearish monthly candle indicates aggressive institutional selling and a shift in long-term sentiment.
👉 Current price: Around ₹290, trading near recent lows after the breakdown.
👉 Trend: Long-term trend remains bearish until the stock starts making higher highs and higher lows.
🔑 Important Levels
📉 Support: ₹280–285 (immediate), then ₹260 if this zone fails.
📈 Resistance: ₹320–330 (first), followed by ₹390–400 (major resistance and previous breakdown zone).
📊 Outlook
🐂 Bullish case: A monthly close above ₹320–330 with strong volume could indicate the start of a recovery.
🧸 Bearish case: If ₹280 breaks on a closing basis, the stock may extend its decline toward ₹260.
💡 Conclusion
At the moment, ITC is not showing a confirmed bullish reversal. It is better to wait for a clear base formation and breakout rather than trying to catch the bottom.
Disclaimer: This is for educational purposes only and not a buy/sell recommendation. Please do your own research before investing.
#ITC #StockMarket #Nifty50
Bank of Maharashtra: Preparing for the Final Leg 🚀 Bank of Maharashtra: Preparing for the Final Leg of Wave (V)?
The monthly chart continues to exhibit a strong long-term bullish structure. The stock has completed a healthy Wave (IV) correction and appears to be advancing in Wave (V), with prices trading comfortably above the 20-, 50-, and 200-month moving averages.
Key Technical Highlights:
✅ Elliott Wave structure indicates Wave (V) is in progress.
✅ Price is trading above all major moving averages, confirming the primary uptrend.
✅ RSI is around 70, reflecting strong momentum without any major bearish divergence yet.
✅ The stock has broken out of the Wave (IV) trendline and is holding above key support.
⚠️ Immediate resistance lies near the ₹92–93 pivot zone. A decisive monthly close above this level could trigger the next leg higher.
Trading Strategy
Entry: ₹89–93 (or on a monthly close above ₹93)
Stop Loss: ₹76.50 (monthly closing basis)
Target 1: ₹100
Target 2: ₹110
Target 3: ₹125 (extended Wave V target)
Time Frame: 6 Months
Risk–Reward: Approximately 1:2 to 1:3 for positional investors.
Conclusion: As long as the stock sustains above ₹76.5, the long-term trend remains firmly bullish. A breakout above ₹93 could mark the beginning of the strongest phase of Wave (V), making Bank of Maharashtra an attractive medium- to long-term positional opportunity.
Tata Steel Showing Strong Bullish Reversal SignalsTata Steel is showing encouraging signs of a bullish reversal after finding strong support at the rising trendline while reclaiming its 200 EMA, a key indicator of long-term strength. This confluence of support suggests that buyers are stepping back into the market after the recent correction.
The formation of a Bullish Harami candlestick pattern near the support zone further strengthens the possibility of an upward move. Historically, when Tata Steel has respected this rising trendline and traded above the 200 EMA, it has witnessed strong buying momentum.
If the stock continues to hold above the 185–190 support zone, it could initiate the next bullish leg toward 205–210 in the short term. A sustained rally may then extend toward the 235–238 resistance zone, which is the projected target based on the current trend structure.
Bullish Outlook
✅ Price has reclaimed the 200 EMA, indicating improving long-term momentum.
✅ Strong support from the rising trendline remains intact.
✅ Bullish Harami suggests weakening selling pressure and a potential reversal.
✅ Holding above the current support zone could trigger fresh buying interest.
🎯 Short-Term Target: ₹205–210
🎯 Major Target: ₹235–238
As long as Tata Steel continues to sustain above its support zone and 200 EMA, the overall technical structure favors a bullish continuation with the potential for a strong recovery toward higher resistance levels.
Smart Money Rotates. Most Retail Investors Never KnowSmart Money Rotates. Most Retail Investors Hold — And Wonder Why They Are Not Profitable.
The economy moves in cycles. Each phase of the cycle has its winners and its losers. This is the map that professionals use and retail traders never see.
Here is a true story that happens in every market cycle.
A retail investor buys IT stocks at the top of the bull market in January 2022. The companies are fantastic — great earnings, great management, great future. Over the next 24 months, those stocks fall 40–60%. Meanwhile, energy companies he had never considered went up 80%. Public sector banks he dismissed as "old economy" doubled. He did nothing wrong in selecting good companies. He did everything wrong in not understanding sector rotation.
The Economic Cycle and Its Four Phases
The economy does not grow in a straight line. It moves in a predictable cycle of four phases. Each phase lasts months to years. And each phase has sectors that outperform and underperform.
Phase 1 — Recovery (Economy coming out of recession)
Characteristics: GDP starts growing again from a low base. Interest rates are low. Credit is cheap. Consumer confidence is improving slowly.
Winners:
Consumer Discretionary — people start buying cars, travel, luxury goods again
Financials — credit growth resumes, banks' loan books start growing
Small and mid cap stocks — disproportionate benefit from early-cycle growth
Phase 2 — Expansion (Strong growth)
Characteristics: GDP growth is high. Employment is rising. Corporate profits are growing. Everyone is optimistic.
Winners:
Technology — high valuation companies get repriced upward in cheap money environments
Capital goods and industrials — heavy investment in capacity expansion
Real estate — developers and home buyers both active
Phase 3 — Slowdown (Growth peaking, inflation rising)
Characteristics: GDP growth starts decelerating. Inflation is elevated. Central banks are tightening. Business confidence starts fading.
Winners:
FMCG and Consumer Staples — people keep buying toothpaste and biscuits regardless of the economy
Healthcare and Pharma — defensive demand, relatively immune to economic cycles
Utilities — stable regulated earnings, dividend-paying stocks
Phase 4 — Recession (Contraction)
Characteristics: GDP negative for 2 quarters. Unemployment rises. Companies cut costs. Credit tightens.
Winners:
Gold — fear trade, preserves value
Bonds — rates fall during recession, bond prices rise
Defensive stocks with strong dividends
Cash — the most underrated position
How to Identify Which Phase India Is Currently In
Watch GDP quarterly data — accelerating or decelerating?
Watch manufacturing PMI — above 50 = expansion, below 50 = contraction
Watch RBI policy stance — dovish (cutting rates) = early cycle. Hawkish (raising rates) = late cycle.
Watch yield curve — normal slope (long rates > short rates) = healthy. Inverted (short > long) = recession warning.
Watch credit growth data — rising credit = expansion. Falling credit = contraction.
The rotation trade is not about finding the best company. It is about being in the right sector at the right phase of the cycle.
In your opinion, at what stage is the Indian economy currently?
BAJAJFINSV Falling Wedge Breakout Attempt📊 Bajaj Finserv: Daily Technical Snapshot – Falling Wedge Breakout Attempt
📊 STWP Technical Analysis
________________________________________
MARKET STRUCTURE SNAPSHOT | NSE: BAJAJFINSV | DAILY
Closing Price: ₹1,855.70 (+₹58.10 | +3.23%)
Core Trend: Recovery within Intermediate Uptrend
Market State: Bullish Recovery with Breakout Attempt
Price Structure: Price is attempting to break above a Falling Wedge pattern after forming a Higher Low, supported by improving momentum.
________________________________________
OPERATIONAL PRICE GRID & KEY REFERENCE LEVELS
Model Reference Level: ₹1,862.00
Hard Invalidation Level: ₹1,638.40
Structural Risk: ₹223.60 (12.00%)
Resistance Levels: R1 ₹1,877.97 | R2 ₹1,900.23 | R3 ₹1,938.47
Support Levels: S1 ₹1,817.47 | S2 ₹1,779.23 | S3 ₹1,756.97
Range Structure: Immediate Trading Range ₹1,638.40 – ₹1,938.47
Higher Timeframe Observation: Sustained acceptance above ₹1,900 could strengthen the bullish structure towards the ₹1,940 region.
________________________________________
MOMENTUM, PARTICIPATION & CPR DATA
Volume Profile: 1.79 Million Shares
Volume Character: Normal Relative Participation
RSI: 65.64 (Strong Momentum Zone)
ADX: 21.33 (Trend Development Phase)
ROC: +5.16%
MACD: Positive Momentum Structure
CCI: -46.11 (Recovering Towards Positive Territory)
Stochastic: 97.04 (Extended Momentum Zone)
Current Bias: BUY ON PULLBACKS AFTER BREAKOUT CONFIRMATION
CPR State: Bullish Zone | Wide Projected CPR
Today's CPR: Pivot ₹1,782.85 | Top ₹1,790.20 | Base ₹1,775.45
Tomorrow's Projected CPR: Pivot ₹1,839.75 | Top ₹1,847.70 | Base ₹1,831.75
________________________________________
📚 EDUCATIONAL OBSERVATION
Bajaj Finserv has staged a strong recovery from its recent swing low and is now attempting to break above a Falling Wedge, a chart pattern that is commonly associated with bullish reversals when confirmed by price and volume. The recent formation of a Higher Low indicates that buyers have started defending higher price levels, suggesting an improvement in market structure.
The latest session produced a strong bullish candle that challenged the upper boundary of the wedge, signalling renewed buying interest. Although trading volume remained within the normal range, the price action reflects improving market sentiment and increasing participation from buyers.
Several technical factors are aligning in favour of the current recovery:
Falling Wedge Breakout Attempt
Higher Low Formation
Strong Bullish Candle
RSI Breakout
Bollinger Band Expansion
Positive Price-Volume Confirmation
Improving Relative Strength versus NIFTY
Buyers' Dominance
Momentum indicators continue to support the developing structure. RSI at 65.64 reflects healthy bullish momentum without reaching extreme overbought conditions. MACD remains in positive territory, indicating improving trend strength, while ADX at 21.33 suggests that a new trend may be beginning to develop. Although CCI remains slightly negative at -46.11, it is steadily improving, indicating that bearish momentum is fading. The Stochastic reading of 97.04 highlights strong short-term momentum but also suggests that temporary pullbacks may occur after sharp advances.
The projected Central Pivot Range (CPR) for the next trading session has shifted higher, with the Pivot projected at ₹1,839.75. A rising and wide CPR generally reflects improving market acceptance of higher prices and often supports trend continuation when accompanied by sustained buying interest.
The immediate technical focus remains on the resistance zone between ₹1,878 and ₹1,900. A decisive close above this region, supported by stronger-than-average volume, would confirm the Falling Wedge breakout and strengthen the overall bullish structure. If confirmed, the next observation area lies near ₹1,938. On the downside, ₹1,817 acts as the first important support, while the structural invalidation level remains at ₹1,638.40.
From a business perspective, Bajaj Finserv is one of India's leading diversified financial services companies with operations spanning lending, insurance, wealth management and digital financial services. Its diversified business model, strong brand presence and continued focus on financial inclusion provide a constructive long-term business outlook.
Support and resistance levels should be treated as observation zones rather than predictive targets. Chart patterns, price action, volume analysis, momentum indicators and CPR are educational tools intended to help market participants understand evolving market structure within a disciplined risk-management framework.
________________________________________
⚠️ Disclaimer
This analysis is provided strictly for educational and informational purposes.
It does not constitute financial, investment or trading advice and should not be interpreted as a recommendation to buy or sell any security.
Investments in the stock market are subject to market risks, including the possible loss of capital.
Historical performance, chart patterns and technical indicators do not guarantee future results.
Please conduct your own research and consult a SEBI-registered investment adviser before making any investment decisions.
STWP assumes no responsibility or liability for any financial loss arising directly or indirectly from the use of this analysis.
HINDUNILVR | 2-Year Symmetrical Triangle — Breakout Zone WatchOverview
Hindustan Unilever — one of India's most widely held FMCG stocks — has been forming a Symmetrical Triangle on the Daily chart spanning nearly 2 years. Price is currently sitting inside the triangle's breakout zone, with yesterday's strong +3% bullish candle adding momentum to the setup.
The next few sessions will be critical in determining whether this triangle resolves bullishly or bearishly.
The Symmetrical Triangle
A Symmetrical Triangle forms when price makes lower highs and higher lows simultaneously — compressing into a tighter range as neither buyers nor sellers gain control. The upper boundary connects a series of declining highs from the October 2024 peak, while the lower boundary connects a series of rising lows from early 2025.
Both lines are converging toward an apex — and price is currently sitting right inside this breakout zone.
Yesterday's Bullish Candle — +3%
On July 1, HINDUNILVR closed with a strong +3% bullish candle from the Support 1 area near ₹2,070. This candle:
Bounced strongly from the triangle's lower support boundary
Closed near the middle of the triangle range
Signals buyers stepping in aggressively at the lower boundary
This is the catalyst that makes today's price action particularly important.
Key Levels
🔴 Resistance 1 — 2,367 (Triangle Upper Resistance area)
🔴 Resistance 2 — 2,406
🔴 Resistance 3 — 2,477
🟡 Current Price — 2,182 (inside triangle)
🟢 Support 1 — 2,070
🟢 Support 2 — 2,006 (Swing Low)
Two Scenarios
🟢 Scenario A — Bullish Breakout
Price closes decisively above the Triangle Upper Resistance line (currently near ₹2,367) on a daily basis. This would confirm a bullish breakout from the 2-year triangle. Targets would be Resistance 2 at ₹2,406, then Resistance 3 at ₹2,477 progressively.
A breakout here would also signal potential sector rotation into FMCG — significant for the broader market.
🔴 Scenario B — Bearish Breakdown
Price fails to hold above Support 1 (₹2,070) and breaks below the Triangle Lower Support line. This would confirm a bearish breakdown from the triangle. Watch Support 2 at ₹2,006 (Swing Low) as the next key level.
⚪ Scenario C — Range Compression Continues
Price continues to compress inside the triangle between ₹2,070 and ₹2,367 for more sessions. In this case wait for a confirmed breakout in either direction with volume before acting.
Why Symmetrical Triangles Matter
A Symmetrical Triangle is one of the most reliable continuation or reversal patterns in technical analysis. It represents a period of indecision — energy building up before a decisive move. The longer the triangle forms, the more significant the eventual breakout tends to be.
With this triangle spanning nearly 2 years, the breakout — when it comes — is likely to be substantial in magnitude. Patience is required, but the setup is worth watching closely.
Conclusion
HINDUNILVR is at a technically significant junction. A 2-year Symmetrical Triangle is reaching its breakout zone, with yesterday's +3% candle suggesting buyers are defending the lower boundary. Watch the upper resistance at ₹2,367 closely — a daily close above this level would be a major breakout signal.
Do not predict — observe the close and react with confirmation.
For educational purposes only. Not financial advice. Always manage your risk.
3 Signs a Breakout Will Fail# 3 Signs a Breakout Will Fail
### Stop Entering Every Candle That Breaks Resistance
Most beginner traders see price crossing a resistance level and immediately think:
“Breakout aa gaya, ab price upar hi jayega.”
But in real markets, every breakout is not a valid breakout.
Many breakouts are traps.
They attract late buyers, trigger stop losses, create excitement, and then price quickly reverses back inside the range.
This is called a **failed breakout** or **fakeout**.
A professional trader does not enter just because price breaks a level.
A professional trader waits for confirmation.
Here are **3 signs that a breakout may fail.**
------------------------------------------------
## 1️⃣ Breakout Happens With Weak Volume
A strong breakout usually needs strong participation.
Volume tells us whether big players are interested or not.
If price breaks resistance but volume is low, it means the move may not have enough strength behind it.
In simple words:
Price is moving up, but buyers are not aggressive enough.
This type of breakout often fails because there is no strong demand to continue the move.
### What to watch:
✅If price breaks resistance but volume is below average, be careful.
✅If the breakout candle looks strong but volume does not support it, avoid chasing.
✅A breakout without volume is like a car moving without fuel.
It may move a little, but it may not go far.
------------------------------------------------
## 2️⃣ Candle Closes Back Inside the Range
This is one of the biggest warning signs.
Many traders enter when price only touches or crosses the breakout level during the candle.
But the close matters more than the wick.
A candle may move above resistance during the session, but if it closes back below resistance, it shows rejection.
That means sellers are still active at higher levels.
The market tried to break out but failed to hold above the level.
This tells us that buyers lost control near resistance.
### What to watch:
Do not enter only because price crossed the level intraday.
Wait for a proper candle close above resistance.
If price breaks out and then closes back inside the range, avoid the trade.
A failed close is often the first signal of a trap.
------------------------------------------------
## 3️⃣ Breakout Candle Has a Long Upper Wick
A long upper wick near resistance shows rejection.
It means price moved higher, but sellers pushed it back down before the candle closed.
This is a sign of supply.
Many beginners see the breakout and enter late, but professionals notice the rejection.
A long wick after breakout tells us:
Buyers tried to push price higher, but sellers were stronger.
This often leads to a pullback or complete breakout failure.
### What to watch:
✅If the breakout candle has a long upper wick, avoid aggressive buying.
✅If the candle closes weak near the lower part of the candle, breakout strength is doubtful.
✅A good breakout candle should usually close strong, preferably near the high.
------------------------------------------------
## Bonus Sign: Breakout Happens After a Big Extended Move
Sometimes price already moved too much before reaching resistance.
By the time breakout happens, many buyers are already late.
This creates exhaustion.
Instead of continuing upward, price may trap breakout buyers and reverse.
A breakout after a clean consolidation is usually better than a breakout after a vertical move.
### Remember:
Breakout after base = stronger setup
Breakout after overextension = higher failure risk
------------------------------------------------
## How Professionals Handle Breakouts
Instead of buying immediately, they ask:
✅Is volume supporting the breakout?
✅Did the candle close above the level?
✅Is the candle showing strength or rejection?
✅Is the breakout coming from a clean consolidation?
✅Is there enough space for price to move after breakout?
If the answer is not clear, they wait.
Waiting is also a trading decision.
------------------------------------------------
## Simple Breakout Confirmation Checklist
Before entering a breakout trade, check these points:
✅ Price closes above resistance
✅ Volume is higher than average
✅ Candle body is strong
✅ Wick is small
✅ Retest holds the breakout level
✅ Market structure supports the move
✅ Risk-to-reward is clear
If most of these are missing, the breakout may fail.
------------------------------------------------
## Example
Suppose Nifty is trading below resistance at 24,000.
Price suddenly moves above 24,000.
Beginner trader thinks:
“Breakout! Buy now.”
But then:
Volume is low
Candle forms a long upper wick
Price closes back below 24,000
This is not a strong breakout.
This is a warning.
A better trader waits for price to close above 24,000 and then watches if the retest holds.
If the retest holds with buying strength, then the breakout becomes more reliable.
------------------------------------------------
## Final Lesson
A breakout is not confirmed when price crosses a level.
A breakout is confirmed when price holds above the level with strength.
Most traders lose money in breakouts because they enter too early.
They buy the excitement, not the confirmation.
Your job is not to catch every breakout.
Your job is to avoid bad breakouts and trade only high-quality setups.
Breakout trading becomes powerful when you combine:
Structure
Volume
Candle close
Retest
Risk management
Trade the confirmation, not the emotion.
------------------------------------------------
### Educational Purpose Only
This post is for learning and educational purposes only. Always manage your risk and follow your own trading plan.
XAUUSD: Breaking below 4,000; sellers paving the way to 3,822XAUUSD is trading around 3,968, positioned entirely below the Ichimoku cloud and remaining locked in a clear bearish structure. Notably, the price has not only lost the psychological 4,000 level but continues to be pressured below the downtrend line extending from previous highs.
The 4,020 area now serves as the immediate resistance. Should gold stage a pullback to this zone but fail to break through, it could mark a point where sellers regain control. Given the current structure, the next downside target on the chart is 3,822, situated within a lower support zone.
Entry Focus: Prioritize SELL positions if the price retraces to the 4,000–4,020 range and a rejection candle appears.
Target: 3,822
Invalidation: The bearish scenario weakens if the H4 timeframe closes decisively above 4,035.
The 3Ms of Trading SuccessA successful trader is not built by finding a secret indicator or a perfect strategy. Many traders spend years searching for a system that never loses, but the real difference between an average trader and a consistent trader comes from building a complete trading framework.
Every strong trading edge is built on three important foundations: Method, Mind, and Money Management. These three elements work together to create consistency, discipline, and long-term survival in the market.
1. Method: Building a Repeatable Trading System
Method is the foundation of your trading journey. It defines how you analyze the market, identify opportunities, and make decisions before entering a trade.
A proper trading method includes your market approach, entry rules, exit strategy, timeframe selection, and trade management process. It gives you a clear structure instead of making decisions based on emotions or random market movements.
Many traders fail because they constantly jump between different strategies. They use one indicator today, follow another strategy tomorrow, and abandon everything after a few losses.
The problem is not always the strategy. The problem is the lack of consistency and understanding. Even a simple method can become powerful when a trader studies it deeply and applies it with discipline.
A good trading method does not need to predict every market move. It only needs to provide a small advantage that can work over hundreds of trades.
Professional traders focus on probabilities, not certainty. They understand that losses are part of the process, but a strong method helps them maintain a positive edge over time.
2. Mind: Mastering Trading Psychology
Trading is not only a technical game; it is also a psychological battle. A trader can have the best strategy in the world, but poor emotional control can still destroy their results.
The market constantly challenges human emotions. Fear can make traders exit good trades too early, greed can make them take unnecessary risks, and frustration can lead to revenge trading after losses.
Many traders know what they should do but fail to execute because emotions take control during real market situations.
A strong trading mind means following your plan even when the outcome is uncertain. It means accepting losses without changing your strategy after every losing trade.
Successful traders understand that one trade does not define their performance. They focus on executing their process correctly and allowing their edge to work over a large number of trades.
The goal is not to remove emotions completely. The goal is to develop enough discipline that emotions do not control your decisions.
3. Money Management: Protecting Your Trading Capital
Money management is the part that keeps you alive in the market. Without proper risk control, even the best trading strategy can fail.
Many traders focus only on making money but ignore the importance of protecting their account. They take oversized positions, risk too much on single trades, and eventually suffer losses that become difficult to recover.
Good money management includes controlling position size, using proper stop losses, maintaining reasonable risk per trade, and avoiding unnecessary leverage.
A trader who protects capital gives themselves more opportunities to improve and benefit from their trading edge.
The main goal of money management is not to avoid losses. Losses are unavoidable in trading. The goal is to make sure that one bad trade or a losing streak does not damage your ability to continue.
How the 3Ms Create a Real Trading Edge:
A profitable trader is not created by one single factor. The Method shows you where and when to trade. The Mind helps you execute your plan with discipline. Money Management protects your capital during uncertainty.
If any one of these pillars is missing, the entire trading system becomes weak. A trader with a great strategy but poor discipline will struggle. A disciplined trader without risk control can eventually lose their account. A trader with good risk management but no proven method will lack a real advantage.
The strongest traders focus on improving all three areas continuously.
My Conclusion:
Trading success is not about finding a shortcut. It is about building a complete system that can survive different market conditions.
Develop your Method to find opportunities. Train your Mind to stay disciplined. Master Money Management to protect your future.
The real trading edge is created when all three work together.
By BrightRally_Research on TradingView
#LALPATHLABCurrent Overview
Current Price: 1,689.20 INR
Daily Performance: Up by 33.20 points (+2.00%)
Trend: Short-term bullish recovery
Key Chart Observations
Sharp Drop / Gap Down: Around early May, the stock experienced a significant, sudden drop in price, bringing it down sharply from the 1,600+ levels to near the 1,400 levels.
Bullish Recovery: Following the May drop, the stock has entered a strong recovery phase. The candlesticks show a steady uptrend characterized by a series of higher highs and higher lows, indicating sustained buying pressure.
Support Level (Pink Line): The horizontal pink line drawn at 1,497.65 appears to be a key structural level. The price briefly consolidated near this area before aggressively pushing higher, suggesting it acts as a strong support zone.
BTCUSD daily timeframe analysis📊 BTCUSD | Daily Timeframe Analysis
🔍 BTC continues to respect the broader bearish market structure after breaking below the ascending channel. The recent Break of Structure (BOS) suggests that buyers have lost short-term momentum, while previous support has now turned into a potential resistance area.
📉 The highlighted supply zone (around 66K–68K) may attract selling pressure if price revisits this region. On the downside, the marked demand zone near 58K–60K remains an important support. A clean break below this level could open the door for a move toward the 52K area, while a confirmed rejection from support may indicate a short-term recovery.
⚠️ This analysis is based on price action, market structure, BOS, and key support/resistance levels. Always wait for confirmation and manage risk accordingly.
Educational purpose only — not financial advice.
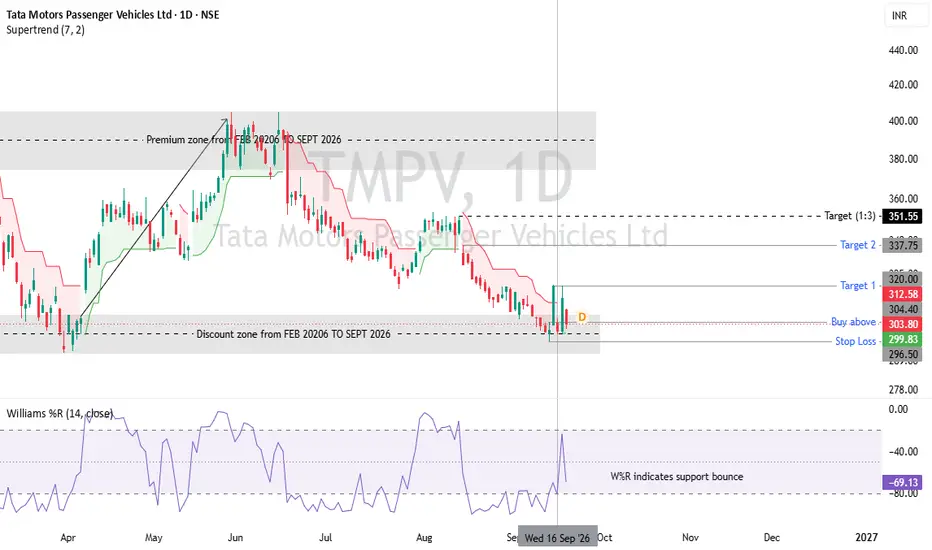
TATA MOTORS 4H BULLISH Continuation WedgeTATA MOTORS 4H BULLISH Continuation Wedge
NSE:TMCV
Best Buy Entry Zone: Rs.397-400
TP1= Rs. 464
TP2= Rs. 487
S/L = Rs. 395
This analysis is for educational and informational purposes only and should not be considered investment advice. Market investments are subject to risks. Please consult your financial advisor before making any investment decisions.
Biocon Limited: Macro Update & Structural BoundariesBiocon continues to consolidate tightly within its broader macro Wave (5) advance. The immediate 337.00 horizontal support shelf represents accumulation on the monthly chart.
A clean breakout above recent swing highs confirms the next impulsive leg is underway toward the upper parallel channel boundary. However, a monthly close below 337.00 will signal that immediate bullish momentum has broken down, warranting an immediate defensive exit before a deeper correction can unfold.
Disclaimer: Educational post only. DYOR before making any trading decisions.
Two Bullish Patterns, One High-Probability Setup | Natural Gasometimes, the strongest setups appear when multiple technical patterns align. That's exactly what caught my attention in Natural Gas.
After a prolonged correction, price formed a well-defined Inverse Head & Shoulders (IH&S) pattern, signalling a potential trend reversal. The breakout above the neckline confirmed that buyers had regained control and the broader sentiment had shifted from bearish to bullish.
What's interesting is what happened next.
Instead of continuing straight higher, price entered a controlled pullback, forming a Bullish Flag. This is a classic continuation pattern that often develops after a strong impulsive move, allowing the market to consolidate before attempting the next leg higher.
The combination of these two patterns is what makes this setup particularly interesting.
Inverse Head & Shoulders → Indicates a potential reversal after a downtrend.
Bullish Flag → Suggests the newly established uptrend may be preparing for continuation.
This transition from reversal to continuation often creates high-quality trading opportunities, provided the breakout is confirmed.
What I'm Watching
The upper boundary of the Bullish Flag is the key level to monitor. A decisive breakout above this resistance, preferably supported by increasing volume, would strengthen the bullish case.
Until then, the setup remains under observation. I prefer waiting for confirmation rather than anticipating the breakout.
Key Takeaways
• Inverse Head & Shoulders signals a potential change in trend.
• Bullish Flag represents a healthy pause within an uptrend.
• Two bullish patterns aligning increase the quality of the setup.
• Confirmation is more important than prediction.
• Always manage risk and let price action validate your analysis.
As always, this analysis is shared for educational purposes and reflects my interpretation of the current chart structure. It is not a buy or sell recommendation.
The market doesn't reward predictions. It rewards patience, preparation, and disciplined execution.
Liquidity and Market Movement:Many traders believe markets move randomly.
One day price breaks a resistance level and rallies. The next day it breaks the same type of level and immediately reverses. Sometimes a stop loss gets hit perfectly before the market moves exactly in the expected direction.
After experiencing this enough times, traders begin asking the same question:
Is the market really random, or is it moving toward something?
The answer often lies in one of the most important concepts in modern price action:
* Liquidity.
Understanding liquidity can completely change the way you view charts. Instead of seeing random candles and unpredictable movements, you begin to understand why price is attracted to certain areas and why some moves happen before the real move begins.
What Is Liquidity?
In simple terms, liquidity is where a large number of buy and sell orders exist.
Financial markets need liquidity to function.
Large institutions cannot simply place massive orders whenever they want. They need enough participants on the opposite side of the trade.
Because of this, price is often drawn toward areas where many orders are waiting.
Think of liquidity as fuel.
Without fuel, the market cannot make significant moves.
Why Stop Losses Attract Price
One of the biggest misconceptions among retail traders is that stop losses are hidden from the market.
In reality, stop-loss orders often gather around obvious chart levels.
For example:
Above major resistance
Below major support
Above previous highs
Below previous lows
Around trendline breaks
When many traders place stop losses in the same location, those areas become liquidity pools.
Price may move toward these zones because they contain the orders institutions need to fill larger positions.
This is why traders often feel like the market "hunted" their stop loss.
The market is not targeting individual traders.
It is seeking liquidity.
Equal Highs and Equal Lows
Equal highs and equal lows are among the clearest signs of potential liquidity.
When multiple highs form at the same level, many traders see resistance.
Short sellers enter positions.
Breakout traders place buy-stop orders above the highs.
At the same time, short sellers place stop losses above those highs.
All of these orders create liquidity.
As a result, price is often attracted to equal highs before making its next major decision.
The same principle applies to equal lows.
These areas act like magnets because of the concentration of orders sitting there.
The Truth About Breakout Traps
Every trader has experienced a breakout that looked perfect.
Price breaks resistance.
Volume increases.
Momentum appears strong.
Then suddenly the market reverses and moves in the opposite direction.
This is known as a breakout trap.
The breakout itself may have been enough to trigger buy orders and stop losses, providing liquidity for larger participants.
Once sufficient liquidity is collected, the market can move in its intended direction.
This is why experienced traders often wait for confirmation rather than entering immediately after every breakout.
Patience can be one of the best forms of risk management.
Institutional Movement and Market Behavior
Large institutions operate differently from retail traders.
They manage positions worth millions or even billions of dollars.
Because of their size, they cannot simply enter trades with a single click.
They need liquidity.
This is why institutional activity is often associated with:
Liquidity grabs
Stop-loss sweeps
False breakouts
Sharp reversals
Strong reactions at key levels
While retail traders focus on candles, institutions often focus on where orders are concentrated.
Understanding this difference helps explain many market movements that initially seem confusing.
Liquidity Before Direction
One of the most valuable lessons a trader can learn is that price often seeks liquidity before revealing its true direction.
A market may sweep highs before falling.
It may sweep lows before rallying.
It may trigger breakout traders before reversing.
The purpose is often the same:
To access liquidity.
Once that liquidity is available, the market can continue its larger move.
This idea helps traders avoid emotional decisions and encourages them to focus on the bigger picture.
Final words:
Liquidity is one of the hidden forces that drive financial markets.
It explains why price often moves toward obvious levels.
It explains many false breakouts and stop-loss sweeps.
And it helps traders understand that the market is not simply moving from one candle to the next.
It is constantly searching for liquidity.
When you begin looking at charts through the lens of liquidity, you stop asking why your stop loss was hit.
Instead, you start asking where liquidity is located and where price is most likely to go next.
That shift in perspective can completely change the way you understand market movement.
ICICI BankThe price is giving a trend line breakout. Though it looks bullish, today's candle close shows bearish sentiment. The price can take support from 1372 - 1382 zone. If this support did not hold, then it can take support from the trend line at the 1350 zone.
Support zones are 1350 and 1372.
Resistance zones are 1430 and 1442.
Watch how the price is acting at support/resistance before taking a trade.
PATELENG | Inverted H&S + Descending Channel BreakoutTechnical Setup
Patel Engineering has broken above a descending channel that had been in place since mid-2024 while simultaneously completing an Inverted Head & Shoulders pattern near the channel base.
The breakout was accompanied by the highest volume in the stock's history, adding conviction to the move.
When multiple bullish patterns resolve in the same zone with record volume, it often signals a meaningful trend reversal.
Fundamental Support
FY26 performance showed improving business fundamentals:
● Revenue: ₹5,102 Cr
● PAT: ₹294 Cr (+21.6% YoY)
● Q4 PAT: +118% YoY
● EBITDA Margin: 15.14%
● Net Margin: 5.77% vs 4.75% last year
● Debt-to-Equity: Improved to 0.27x from 0.43x
● Asset Monetisation: ₹185 Cr
Growth Visibility
● Order Book: ₹15,119 Cr (nearly 3x FY26 revenue)
● FY27 Order Inflow Target: ₹8,000 Cr
● Identified Pipeline: ₹20,000 Cr
● Subansiri HEP Unit-4 commissioned
● CIDCO TWT-II tunnel breakthrough achieved
Risks
● Interest costs remain elevated at ~₹79 Cr per quarter
● Interest coverage still relatively thin
● Q4 revenue declined 11.8% YoY
● Promoter holding at 31.5%
● EPC execution can remain lumpy
Technical invalidation: Sustained close below ₹28.
Conclusion
The stock is showing signs of a potential infrastructure-led turnaround supported by improving margins, lower leverage, and a strong project pipeline. The combination of an Inverted H&S breakout and channel breakout at record volume makes this a chart worth tracking.
A retest of the ₹30–32 zone could offer a more favourable risk-reward than chasing the breakout.
Not financial advice. DYOR.
USDJPY at 161: Bull Trend or Intervention Trap?The broader market structure continues to favour buyers, but the risk profile has changed. Price is now trading in an extended zone where intervention headlines, profit-taking and failed-breakout pressure could produce sharp volatility.
Bullish Scenario
The main requirement for further upside is acceptance above 161. A temporary spike or wick above this level would not be enough. Buyers need to hold the breakout area and continue forming higher lows.
If price remains stable above 161, the next areas of interest are:
161.50 – Immediate upside level
162.00 – Major psychological target
A controlled consolidation above 161 would be healthier than another vertical move because it would confirm that buyers are willing to defend the breakout.
Bearish Scenario
A move above 161 followed by a quick close back below the level would indicate a possible false breakout. That would suggest weakening momentum and trapped buyers near the highs.
In that situation, price may rotate toward:
160.00 – First major psychological support
159.50 – Deeper support and momentum test
A decline toward 159.50 would not automatically reverse the broader bullish structure, but it would confirm that short-term momentum has weakened.
Intervention Risk
The major risk is the speed of any reversal. A normal technical pullback and an intervention-driven move should not be treated in the same way.
If price suddenly falls through several levels with unusually large candles, traders should avoid assuming it is only a standard correction. Intervention-related volatility can create poor fills, wider spreads and rapid price gaps.
Key Levels
Resistance Zone: 161.00–161.50
Bullish Extension: 162.00
Main Support: 160.00
Deeper Support: 159.50
Conclusion
The trend remains bullish, but this is now a decision zone rather than an easy continuation entry. Chasing price after an extended move offers weak risk-to-reward.
The better approach is to wait for one of two confirmations:
A stable hold above 161 with continued higher lows
A clear rejection below the breakout area
The reaction around 161 will likely determine whether USDJPY begins another leg higher or turns into an intervention trap.
What do you expect next: continuation toward 162 or rejection back below 160?
Why I Stopped Staring at Candles After Years of TradingI spent years in manual/discretionary trading.
Staring at candles for hours.
Waiting for setups.
Second guessing entries.
And still…
Taking losses that didn’t just hit my account —
they hit mentally.
Stress. Frustration. Overtrading.
You probably know that feeling.
At one point I realized something:
👉 The problem wasn’t the market.
👉 The problem was how I was trading it.
Too much emotion.
Too much screen time.
Too much inconsistency.
So I changed the approach.
Instead of chasing trades…
I started building systems.
“If it can be backtested, it can be improved.”
That became the foundation.
Fast forward 5 years —
No more staring at charts all day.
No more impulsive decisions.
No more revenge trading.
Just:
⚙️ Build pre-defined rules
📊 Data-backed validations
🤖 Automated trades execution
And here’s the reality most retail traders ignore:
The biggest players in the market…
aren’t trading manually.
They rely on systems.
This doesn’t mean algo trading is magic.
But it does mean one thing:
👉 Discipline can be engineered.
Today, trading for me is no longer about
“Will this trade work?”
It’s about:
“Does this follow the system?”
If you’re still stuck:
- Watching charts all day
- Missing trades
- Entering late
- Letting emotions take over
Maybe it’s time to rethink the approach.
Not everything needs to be manual.
Curious to see how automated systems actually work? Let me know in the comments.
US30 Strategy: Channel Accumulation & Short Squeeze
1. Market Context
On the 1H chart of image, US30 is trading within a dominant ascending channel. After reclaiming the lower boundary from the pink "Kill Zone" (50,400), the price surged to the upper trendline resistance at 52,200 (marked "Seller") before entering a healthy corrective phase.
2. Sentiment & Liquidity Analysis
• The Seller Trap: Retail traders aggressively shorted the touch of the upper trendline resistance ("Seller" at 52,200), expecting a drop back to the channel bottom. Their stop losses (buy stops) are concentrated heavily above 52,200, representing a massive pool of buy liquidity.
• The Target: Once the price breaks above the 52,200 resistance, a rapid short squeeze will drive the market to the next major expansion target at 53,261 (marked "No Seller"), where supply is expected to be extremely thin.
3. Trade Setup
We target a long entry from the current institutional accumulation zone to ride the next bullish expansion wave.
• Entry: 51,177.3 (Buying the local support retest).
• Stop Loss (SL): 50,659.1 (Placed safely below the local consolidation zone).
• Take Profit (TP): 53,261.2 (Targeting the upper parallel channel expansion).
• Risk-to-Reward Ratio (R:R): Approx 4:1
RBL Bank – Weekly Chart Breakout Setup📈 Subject: RBL Bank – Weekly Chart Breakout Setup 🚀
🟢 Strong Bullish Structure Emerging!
RBL Bank is trading near ₹378.85, gaining +3.55% on the weekly timeframe. 💪
Price is approaching a major resistance zone around ₹380–₹400, signaling a potential breakout. 🎯
A successful breakout above this zone could open the path toward the ₹650–₹675 range in the longer term. 🚀
The stock has formed a series of higher highs and higher lows, confirming a strong uptrend. 📈
Banking sector strength and improving momentum add support to the bullish outlook. 🏦
⚠️ Risk Management: A sustained move above resistance is key. Failure to hold above ₹350–₹360 may lead to short-term consolidation. 🛡️
✨ Overall View: Long-term trend remains positive, with a breakout above ₹400 potentially triggering the next leg of the rally. 🚀📊