ASTRAL ltd ready to move higher?No strong breakout yet. Stock is consolidating.
above 1500 looks like a breakout level
sl 20-25%
tp 50-75%
rrr 1:2
Key levels to watch:
Support: ₹1,400–1,420
Major support: ₹1,300
Resistance: ₹1,520–1,550
Astral has the potential to move higher, but the ride may not be smooth, there are mixed signals in the short term and fundamental drivers that matter most over the long run high-quality compounder going through a slowdown phase.
If you’re trading short-term, watch for confirmed breakout levels and volume strength.
If you’re investing long-term, fundamentals like earnings growth, market share, and sector momentum will be key.
Community ideas
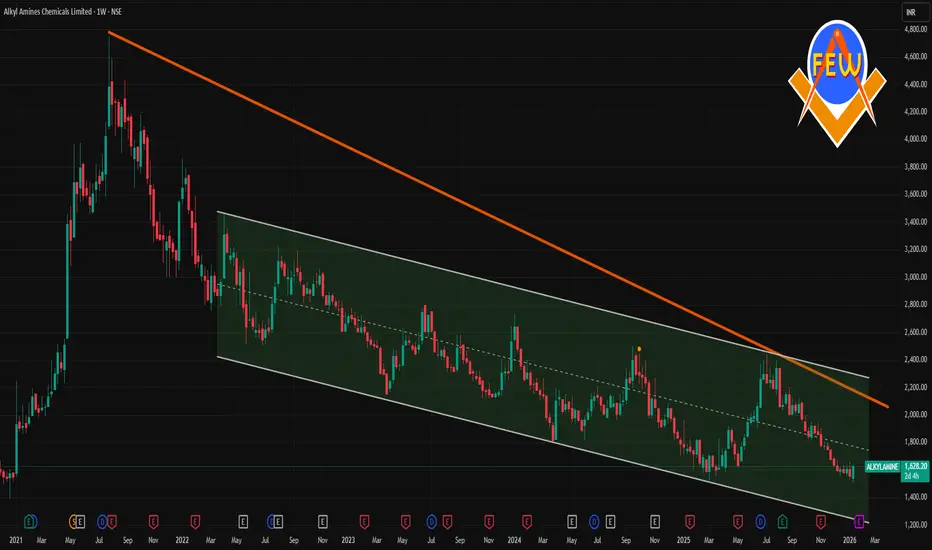
ALKYLAMINE 1 Week Time Frame 📌 Current Price (Latest Market Levels)
Approximate current trading price: ₹1,570 – ₹1,610 range on NSE (mid‑January 2026) — slightly below recent intraday highs/lows around this zone.
52‑week range: Low ~₹1,506 • High ~₹2,438.
Short‑term price action has been slightly bearish to neutral around this zone with some down‑side pressure evident.
📈 1‑Week (Weekly) Technical Levels
🔑 Weekly Pivot Levels
These come from multiple pivot calculations (classic & fibo), giving a weekly frame support/resistance range:
Weekly Pivot Zone
Pivot (~1,580 – 1,584) — acts as the mid‑point level this week.
Weekly Resistance
R1: ~₹1,610 – 1,615 (first resistance ahead).
R2: ~₹1,630 – 1,650 (stronger resistance).
R3: ~₹1,670 – 1,680 (broader weekly upper target).
Weekly Support
S1: ~₹1,545 – 1,555 (initial support).
S2: ~₹1,520 – 1,530 (deeper support).
S3: ~₹1,485 – 1,495 (significant near‑term buffer).
📌 Weekly pivot levels are useful to gauge if price holds above support — which implies stay bullish weekly — or breaks down through support — into bearish continuation.
💡 What This Means for the Next 1 Week
✅ Key levels to watch for directional bias:
Weekly Bullish trigger: Close above ₹1,610‑1,615
Weekly bearish trigger: Close below ₹1,545
Apollo Tyres Ltd – Chart Analysis (Daily)Price has respected the ₹495–500 support zone multiple times, indicating strong demand at lower levels.
A bullish pin bar has formed near this support, suggesting rejection of lower prices and potential upside continuation.
Current price is trading above support and near ₹525–530, showing improving momentum.
Immediate resistance: ₹535–540
Trend bias: Neutral to bullish above ₹495; weakness only if support breaks decisively.
Disclaimer:
This chart analysis is for educational and informational purposes only. It is not a buy/sell recommendation. Stock market investments are subject to market risk. Please do your own research or consult a qualified financial advisor before making any trading or investment decisions.
Banco Products (India) LtdDate 14.10.2026
Banco Products (India) Ltd
Timeframe : Day Chart
Highlight :
Despite of 38% rise in share price in the last 1 year the stock PE Ratio is still at 21
This is very rare occurrence in todays era in stock market, indicates strong earnigs & managment
About
Manufactures and supplies engine cooling modules and systems for automotive and industrial applications in both the domestic and international markets
Revenue Breakup
(1) OEMs: 55-60%
(2) Aftermarkets: 15%
(3) Export: 30%
Geographical Split
(1) International: 68%
(2) India: 32%
Top Clientele
(1) Ashok Leyland
(2) Eicher
(3) Mahindra
(4) Godrej
(5) TATA
(6) TVS
(7) Swaraj Mazda
(8) JCB
(9) John Deere
(10) The top 5 customers contribute less than 35% of revenue
Manufacturing Facilities
The company has 5 manufacturing facilities with a capacity to produce 3.33 million radiators annually
Valuations
(1) Market Cap ₹ 9,191 Cr
(2) Stock Pe 21
(3) Roce 32.4 %
(4) Roe 32.2 %
(5) Book Value 5.5X
(6) Opm 17.14%
(7) Promoter 67.88%
(8) Profit Growth (TTM) 26%
(9) EV/Ebita 114
(10) PEG 0.60
Regards,
Ankur Singh
BEL | Breakout WatchDescription
Bharat Electronics (BEL) is forming a clear Ascending Triangle on the daily chart.
Price has tested the ₹420–₹422 resistance zone multiple times.
Each pullback is making higher lows, indicating steady accumulation.
Price is now compressed near resistance, suggesting a potential breakout.
This structure reflects buyers absorbing supply and preparing for a directional move.
Trade Plan
Breakout Trigger
Daily close above ₹422
Entry
Above ₹423 after confirmation
Stop Loss
Below ₹410 (below rising trendline)
Target
Triangle height ≈ ₹40
Target zone: ₹460 – ₹465
Risk–Reward
Entry ~ ₹423
SL ~ ₹410
Risk ~ ₹13
Target ₹460 = ₹37
Target ₹465 = ₹42
Risk–Reward ≈ 1 : 2.8 to 1 : 3.2
Notes
This is a volatility compression pattern. When it breaks, the move is usually fast and directional.
Not financial advice. Always manage risk.
BAJFINANCE : AT A GOOD SWING
Timeframe: Daily
Current Spot Price: ~₹949
Trend Context: Primary uptrend intact | Ongoing corrective phase
🔍 Technical Structure Overview
Bajaj Finance has completed a corrective ABC structure, where:
Wave (a) initiated the correction,
Wave (b) retraced upward,
Wave (c) is nearing completion near a high-probability demand zone.
The ABC completion zone (₹934–₹945) coincides with:
Rising trendline support
Prior structure demand
Short-term mean reversion support (7-SMA)
This confluence increases the probability of a trend resumption bounce rather than a breakdown.
🟩 Swing Trade – Buying Strategy (Cash / Futures)
✅ Buy Zone (Accumulation Range):
₹945 – ₹935 (staggered buying preferred)
🎯 Swing Targets:
Target 1: ₹981
Target 2: ₹1,020
Extended Target: ₹1,066 (only if momentum sustains)
🛑 Stop Loss (Strict):
₹903 (Daily candle close basis)
Risk–reward remains favorable as long as price holds above the ABC completion zone and trendline support.
🟨 Options Trade Strategy – January Expiry
📌 Directional Bias: Moderately Bullish (Buy on Dip)
▶️ Call Buying Setup
Buy: 960 CE or 980 CE (January Expiry)
Ideal Entry: When spot sustains above ₹950–₹955 after pullback confirmation
🎯 Option Targets:
On move towards ₹981–₹1,020 in spot, expect healthy premium expansion
🛑 Option Stop Loss:
Spot-based SL: Hourly close below ₹931
OR 40–45% premium SL, whichever is hit earlier
Avoid aggressive OTM calls; prefer ATM or slightly ITM strikes for better theta and delta balance.
⚠️ Risk Management Notes
If price fails to hold ₹931 on an hourly closing basis, the bullish structure weakens.
A daily close below ₹903 invalidates the swing setup and may open deeper correction.
Position sizing should be conservative due to January expiry volatility.
📌 Summary View
Bias: Buy on dips near demand
Structure: ABC correction nearing completion
Edge: Trendline + demand zone confluence
Best Approach: Staggered swing buying + disciplined option positioning
⚠️ Disclaimer
This analysis is for educational purposes only. I am not a SEBI-registered analyst. Traders should manage risk responsibly and consult their financial advisor before taking positions.
AUROBINDO PHARMA – Bearish Breakdown patternAurobindo Pharma has broken down from a Double Top pattern , confirming bearish momentum.
🔻 Structure: Double Top Breakdown
🔻 Trend: Bearish
🔻 Volume: Breakdown supported by selling pressure
Trade Setup (Short):
Entry: Below Double Top neckline (breakdown zone)
Target: 1143 🎯
Stop Loss: 1221 ⛔
As long as price stays below 1221, downside pressure may continue. A decisive move towards 1143 is expected if bears maintain control.
⚠️ Disclaimer: This is for educational purposes only. Not financial advice. Manage risk properly.
EMCURE PHARMA ANALYSISTHIS IS MY CHART OF THE WEEK PICK
FOR LEARNING PURPOSE
EMCURE PHARMA- The current price of EMCURE is 1540.60 rupees
I am going to buy this stock because of the reasons as follows-
1. It has given a breakout of last 15 months resistance with some good volume and looks great.
2. This stock has seen some great buying in last few months. After IPO, it went down but later it recovered.
This stock has been in my watchlist from last few weeks.
3. It is showing better relative strength as it stood strong in volatile times including last few weeks.
4. The risk and reward is favourable.
5. The stock is one of the outperformers in this market. The structure is great as of now. It has also outperformed it's sector in very short term but it was more of a lagging stock in last 1 year and probably it will show better strength in coming days.
6. Another good part- The overall sector has shown some decent strength and have good momentum.
Also, Mutual Funds and FIIs have increased their stake in last Q.
I am expecting more from this in coming weeks.
I will buy it with minimum target of 35-40% and then will trail after that.
My SL is at 1352.45 rupees.
I will be managing my risk.
NETWEB: High-Conviction Support Bounce & Momentum ShiftNETWEB is demonstrating a powerful Breakout and Retest play. After clearing its 2024–2025 resistance levels near the ₹3,000 zone, the stock has pullbacked to test this area, which is now acting as a high-probability Demand Zone. This retest coincides with the weekly 20-SMA, increasing the conviction of a fresh upward leg.
Technical Analysis & Breakout Factors
Role Reversal (S/R Flip): The previous major supply zone around ₹3,000–₹3,100 has been comfortably absorbed and is now serving as solid structural support.
Moving Average Alignment: The stock is trading above ALL key long-term moving averages (100-day and 200-day SMAs). Crucially, the recent price action shows a successful bounce and close above the 10 and 21 Exponential Moving Averages (EMA), signaling that short-term momentum has reclaimed control.
Relative Strength (RS): RS is CONFIRMED POSITIVE. While the broader Sensex/Nifty has shown weakness (declining ~2.6%), NETWEB has significantly outperformed, gaining 8.3% in the same weekly period.
Character Change: The recent surge from the pivot bottom marks a Change of Character (CHoCH) with price now rising 9.5% from that local low.
Volume Confirmation: The initial breakout was supported by massive institutional delivery volumes (nearly 94% higher than the average), indicating genuine accumulation rather than retail speculation.
Trade Recommendation: Long Position (Swing Trade)
Action: BUY (Long Entry)
Entry Trigger: Current levels or a break above the recent intraday high of ₹3,437.
Target 1 (T1): ₹3,850 (Immediate swing high resistance).
Target 2 (T2): ₹4,480 (Test of the All-Time High).
Stop-Loss (SL): ₹2,980 (Weekly close below the critical ₹3,000 support zone).
Risk/Reward Ratio (R:R): Approx. 1:3.0 (Risking ~₹330 for a gain of ~₹1,160 to T2).
Key Takeaway for Traders
NETWEB is a unique "Sovereign AI" play with strong fundamental tailwinds, including a ₹21,840 million strategic order pipeline. The technical confluence of a Support Flip and positive RS makes this a standout candidate for the next leg of the bull run. Position size carefully ahead of the Q3 earnings results on January 16-17, 2026.
Disclaimer: This analysis is for educational purposes only and does not constitute financial advice. Always perform your own research before trading.
#Banknifty Directions and Levels for Jan 12thCurrent View
> If the market declines initially, the immediate support zone is expected to act as a strong support.
> If price gets rejected from this zone, structurally this could be a 5th sub-wave. In that case, the 5th sub-wave correction may complete here, followed by a bounce of around 38%–61% of the minor swing.
> This is the base structure. However, if price does not reject around the pullback zone, the 5th sub-wave could extend toward 58,737.
Alternate View
> The alternate scenario suggests a range-bound market with a bearish bias.
> If the market opens positive, we can expect a bounce of around 23%–38%. However, even if a bounce occurs, the broader outlook remains bearish, and the market may return to its opening level by the end of the day.
HAL (W): Neutral-Bullish (Coiling Pre-Budget)Timeframe: Weekly | Scale: Logarithmic
The stock is in the final stages of a 7-month consolidation pattern (Descending Triangle). While typically a bearish pattern, in a strong structural uptrend (like Defense), this often acts as a "Pause" before the next leg up, especially with the Budget acting as a trigger.
🚀 1. The Fundamental Catalyst (The "Why")
The stock is waking up due to seasonality:
> Union Budget (Feb 1): We are 3 weeks away from the Budget. The market expects increased defense spending, specifically for the Tejas Mk2 and AMCA programs, which directly benefits HAL.
> Volume Pickup: The recent volume accumulation suggests "Pre-Budget Positioning" by institutions who expect a breakout.
📈 2. The Chart Structure (The Squeeze)
> Resistance (The Lower Highs): The angular trendline starting from the July 2024 ATH is currently passing through ₹4,900 – ₹4,800 . A weekly close above this invalidates the correction.
> Support (The Floor): The horizontal support at ₹4,150 (active since Apr 2025) has held multiple times. This is the "Line in the Sand."
> Current Position: The stock is trading tight against the resistance. A breakout here would release 7 months of stored energy.
📊 3. Technical Indicators
> RSI: The RSI rising while price is sideways is a Bullish Divergence (hidden). It shows internal strength.
> EMAs: Watch for the short-term EMA's Positive Cross-over state.
Conclusion
This is a "Event-Driven Setup" .
> Refinement: The "Wait and Watch" approach maybe correct, but be ready to act fast. The Budget Expectation will likely force the breakout before Feb 1.
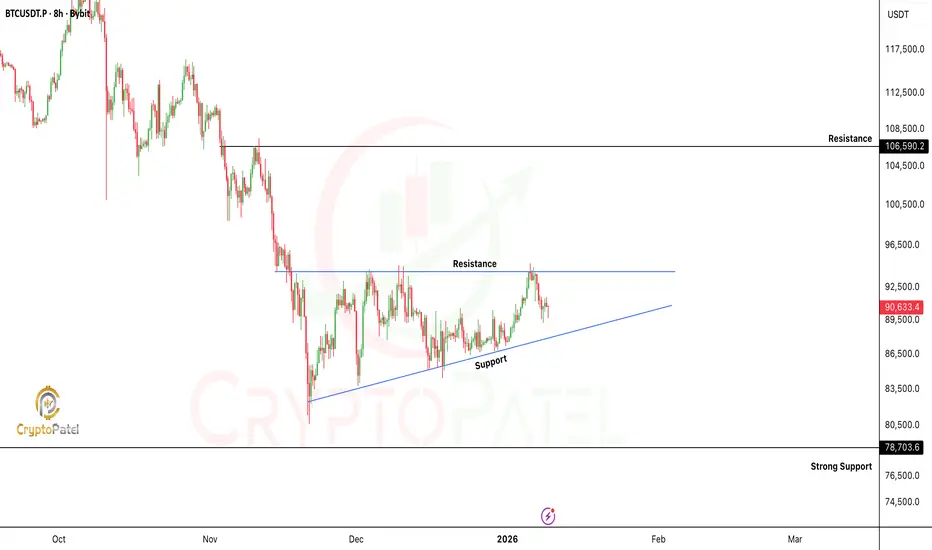
BTC | 8H Technical Structure UpdateBTC | 8H Technical Structure Update
Price Is Printing A Clear Ascending Triangle With Consistent Higher Lows Pressing Into A Well-Defined Horizontal Supply Zone At $94,500
Key Technical Levels:
🔹 Range High / Supply: $94,500 → $107,000
🔹 Ascending Trendline (Dynamic Demand): ~$88,000
🔹 HTF Demand / Structural Support: $78,000
Market Structure Read:
🔹 Compression Phase Ongoing
🔹 Volatility Expansion Imminent
🔹 Trendline Continues To Act As Acceptance Support
🔹 Liquidity Resting Above Range High
Scenarios:
✔️ 8H Close Above $94500 → Range Expansion Toward $106K+
❌ Loss Of Ascending Trendline → Structural Rotation To $78K
Market Is At Decision Point. Wait For Acceptance, Not Anticipation.
NIFTY 50 – Close Below 50 EMA & SMA | Downside Levels IdentifiedTechnical View:
Over the last two years, NIFTY has consistently shown that a daily close below both the 50 EMA and 50 SMA results in an average correction of 4–5%.
🔍 Current Structure:
Price has closed below 50 EMA & 50 SMA
Rising wedge structure near the top → breakdown risk
Weak follow-through after the recent high
🎯 Downside Levels (Supports & Targets)
🔹 Immediate Support: 25,450 – 25,400
(Recent demand zone & neckline support)
🔹 Target 1 (≈2%): 25,350 – 25,250
(First reaction zone after breakdown)
🔹 Target 2 (≈3%): 25,100 – 25,000
(Psychological level + prior consolidation)
🔹 Extended Target (4–5%): 24,600 – 24,400
(Historical average correction zone based on EMA/SMA breakdowns)
📌 Invalidation / Resistance
Resistance: 25,900 – 26,000
(A move back above this zone negates the immediate bearish view)
⚠️ Disclaimer:
This analysis is based purely on technical probabilities and historical behavior. Not a buy/sell recommendation. Use strict risk management.
Short term Analysis of RelianceWrap up:-
Reliance is making a wxy pattern in wave c and has completed its wave w at 1581 and wave x is expected to be completed near 1450. Thereafter, Reliance will head towards wave y.
What I’m Watching for 🔍
Buy Reliance in the range of 1460-1480 sl 1440 for a target of 1578-1687.
Disclaimer: Sharing my personal view — only for educational purpose not financial advice.
"Don't predict the market. Decode them."
COFORGE – Weekly Chart | Clean Technical ViewNSE:COFORGE
🔹 Trendline + 50 EMA Support:
Price has pulled back into a rising weekly trendline, and the 50 EMA is sitting right there. This confluence is the key zone.
🔹 Price Action:
Rejection from 1950–2000 came with a controlled pullback, not panic selling. That tells me distribution isn’t aggressive yet.
🟢 Buy Zone (Support-based): 1680 – 1700
NIFTYIT Sector About to go for a Breakout attempt
🔹 Bias:
Above trendline + 50 EMA → bullish bias intact
Weekly close above 1750–1780 → scope to retest 1900–2000
Weekly close below demand → bullish view invalid
Keep Learning,
Happy Trading.
SRF LTD: Price Compression at Key Resistance|Clean Breakout Play📌 Structure: Daily Timeframe
SRF has been consolidating inside a clean descending channel, printing lower highs while demand holds near the channel base.
Price is now pressing against well-tested channel resistance — a clear decision zone.
🔴 Key Reads
Descending resistance respected multiple times
Tight price compression near supply → volatility contraction
Buying interest visible near demand
Muted volume during consolidation → pre-expansion behaviour
This is structure-led, not momentum-driven.
🟢 Breakout Rules (Strict)
Trade triggers only if:
Strong green Marubozu / near-Marubozu
Daily close above descending resistance
Clear volume expansion
No close above resistance = no trade.
🎯 Trade Plan
Entry: Breakout close
SL: Low of breakout candle
Target 1: ₹3300, then trail
Management: Trail via higher lows / structure
Defined risk. Reward from range expansion, not prediction.
🧠 Why It Works
- Long consolidation builds energy
- Repeated rejections weaken supply
- Channel breakouts often expand fast
Clean price + volume = institutional participation
⚠️ Invalidation
Weak breakout
Low volume
Rejection wick with close back inside channel
→ No trade
📊 Final Word
SRF is coiled, not weak.
Patience first. Execution only on confirmation.
➡️ Let price prove strength. 👍 Appreciate if this helps.
⚠️ Disclaimer
This is a technical study for educational purposes only, based purely on price action and volume.
Not financial advice. Please manage risk as per your own trading plan.
🔔 Follow
If you like clean, no-indicator, price–volume based setups,👉 Follow for more structure-led trade ideas and chart studies.
💬 Your Turn
Have a stock you want analysed using pure price action & volume?
Drop the name in the comments — I’ll pick a few and share clean charts.
NAUKRI – Tight Range, Clear Structure, Price Under CompressionPrice has been moving inside a well-defined converging range, with lower highs pressing from the top and higher lows holding from the bottom.
Each rejection from the upper line and each response from the lower line shows that both buyers and sellers are active, but volatility is gradually compressing.
This kind of structure usually forms when the market is digesting the previous move and deciding the next direction.
No indicators, no assumptions — just pure price respecting structure.
At this stage, the focus is not on guessing, but on observing how price behaves as it approaches the edge of the range.
Clarity always comes from price itself.
SAIL - Weekly - LongThis is a weekly chart of the SAIL, so it is useful for positional or swing trading.
First, let’s understand the trend based on the markings.
Earlier on the left side, the stock was making lower highs and lower lows, which clearly shows a downtrend. This phase is marked with “lower low” arrows. After that, the selling pressure reduced and the price started stabilizing. From the middle of the chart onward, you can see the structure changing. The stock started making higher lows. This is the first sign that the downtrend is ending and accumulation is happening. Later, the price moved above the 20 EMA and started respecting it as support. Each dip near the 20 EMA formed a higher low, which confirms a trend shift from downtrend to uptrend.
Now, focus on the 20 EMA.
In the recent candles, price is staying above the 20 EMA. The candle marked as “elephant bar above 20 EMA” shows strong buying interest. A large green candle closing above the moving average usually indicates strength and momentum returning to the stock. As long as price stays above the 20 EMA on a weekly closing basis, the trend remains positive.
Resistance and breakout view.
There was a clear resistance zone around the 139–140 area. The price has now moved above this level, which is marked as “resistance broken”. When an old resistance is broken, it often turns into support. This breakout improves the probability of further upside.
Volumes analysis.
Volume was relatively low during the sideways and base formation phase. Recently, volume has expanded on the bullish candle, which is marked as “high volumes”. This is important because a breakout with higher volume shows genuine participation and not just a weak bounce. Rising price with rising volume supports the bullish view.
RSI analysis.
RSI is around the 60–65 zone. This indicates strength but not overbought conditions. RSI staying above 50 usually supports an uptrend. Since RSI is rising and comfortably above 50, it confirms positive momentum. There is still room for upside before RSI reaches extreme levels.
Overall trend conclusion.
The structure has shifted from lower lows to higher lows. Price is above the 20 EMA, resistance is broken, volume is supporting the move, and RSI confirms strength. All these signals together indicate a bullish trend on the weekly timeframe.
Entry plan.
A safer entry would be on a small pullback towards the broken resistance zone or near the 20 EMA, around 138–142, if price shows support in this area. Aggressive traders can also enter on a weekly close above the breakout level if the next candle holds above it.
Stop loss placement.
Stop loss should be below the recent higher low or below the 20 EMA on a weekly closing basis. A practical stop loss zone would be around 128–130. This keeps you protected if the breakout fails.
Targets and risk management.
The first target can be near the previous swing resistance around 155–160. If momentum continues, the next positional target can be near 168–170.
Risk only a small portion of your capital on this trade, ideally 1–2 percent. Position size should be calculated based on the distance between entry and stop loss. Do not move the stop loss upward too quickly; let the trade breathe as long as the price respects the 20 EMA.
In simple words, this chart shows a clear trend reversal into an uptrend. Patience, disciplined entry near support, and strict risk management are the key to trading this setup safely.
NBCC (India) Ltd | Weekly Consolidation Breakout SetupNBCC is showing a constructive weekly structure after a healthy pullback.
Price is holding above key moving averages
Higher lows indicate trend continuation
Tight consolidation near resistance suggests accumulation
Setup favors a range breakout on strength
Trade View:
Buy on strength above ₹125
Support zone: ₹112
Target - 140-150-160
Upside: Gradual move towards prior highs if breakout sustains
⚠️ Purely technical view. Risk management is essential.
SANSERA ENGG@1871Not a SEBI registered, just sharing idea. On weekly time frame SANSERA @1871 gave breakout from rounding bottom @1767 with volume. Entry can be made 1871 and @1767, SL-1700 Target 1-2600 in 2-3 month, 2-3300 in 5-6 month. It is in Bull trend RSI on DAILY, WEEKLY >70 and MONTHLY>=70.
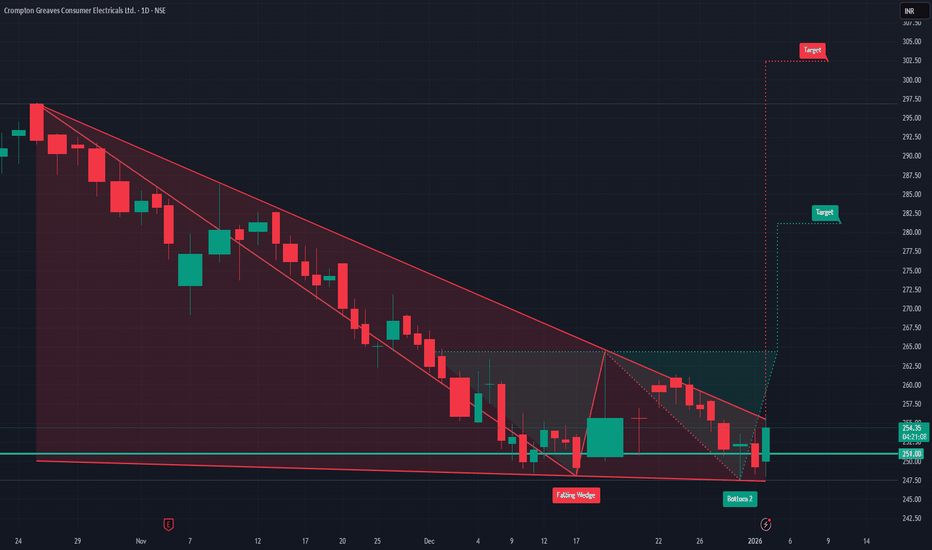
Crompton Greaves Falling?Technical (upgrade)
Crompton Greaves Consumer Electricals has been sliding inside a falling wedge, but price is trying to base around ₹248-252 (teal support on your chart). A daily close above ~₹260–262 (wedge top/near-term trendline) would confirm a breakout and set up a move toward ₹275 first and ₹300 next If price fails and closes back below ₹248, treat it as a false start and expect the downtrend to resume keep risk tight in that zone.
Fundamentals (quick, clean)
Latest print showed mixed trends—Q2 FY26 consolidated revenue ~₹1,915.6 cr, PAT ~₹75.4 cr, with margin pressure; the quarter also carried an exceptional ₹20.36 cr charge for the Vadodara plant restructuring. Butterfly (kitchen appliances) grew double‑digits YoY and lighting rose ~3% YoY, partly offsetting weakness in electric consumer durables. The company fully repaid its ₹300 cr NCDs in Jul‑2025 and said it is net‑cash/zero‑debt, which is a positive for flexibility. Valuation and efficiency are mid‑pack for consumer durables (P/E ~34–35; P/B ~4.3–4.9; ROE ~13–15%; ROCE ~15–19%). Net‑net: fundamentals are stable but margins need rebuilding—if your chart gets the ₹260–₹262 breakout, technicals can align with a gradual recovery story.
Like, comment your thoughts, and share this post
Explore more stock ideas on the right hand side your feedback means a lot to me!
Disclaimer: This post is for educational purposes only and should not be considered a buy/sell recommendation.
BHEL – Weekly Trendline Still in ControlBHEL continues to trade in a strong uptrend on the weekly timeframe, with price respecting the rising trendline and closing near the recent highs around ₹299.50. The series of higher highs and higher lows remains intact, and the latest bullish weekly candle reinforces the strength of buyers along this trendline support
As long as the stock holds above this rising trendline and the recent swing low on weekly closing basis, the bias stays positive and dips toward the trendline can be treated as buy‑on‑decline opportunities for positional traders. A clean weekly close below the trendline, however, would be an early signal of waning momentum and a cue to re‑evaluate long positions and tighten risk.
Disclaimer: This analysis is for educational and informational purposes only and does not constitute investment, trading, or financial advice. This is not a buy/sell/hold recommendation. Please do your own research and consult a SEBI‑registered financial advisor before making any investment decisions.