INDIANB (Indian Bank)INDIAN BANK is showing a strong and constructive setup.
The stock recently made a fresh all-time high near 894, followed by a healthy pullback, which is a positive sign and often helps in building a stronger base for the next move. Importantly, the pullback was well-controlled, indicating limited selling pressure.
Price has now resumed its upward move and is trading above all key EMAs, reflecting continued strength and bullish momentum. The overall structure remains intact with higher highs a
Community ideas
ACC (NSE) | Weekly | Harmonic Reversal This chart highlights a high-probability bullish reversal on ACC (Weekly timeframe) based on Harmonic structure + Smart Money Context.
🔹 Pattern Insight
A well-formed XABCD harmonic structure has completed near the 0.886–0.918 PRZ
Price has respected the D-point demand zone, indicating smart money absorption
Extended consolidation near lows suggests selling pressure exhaustion
🔹 Why This Setup Is Strong
✅ Confluence of harmonic PRZ + higher-timeframe demand
✅ Structural symmetry maintained throu
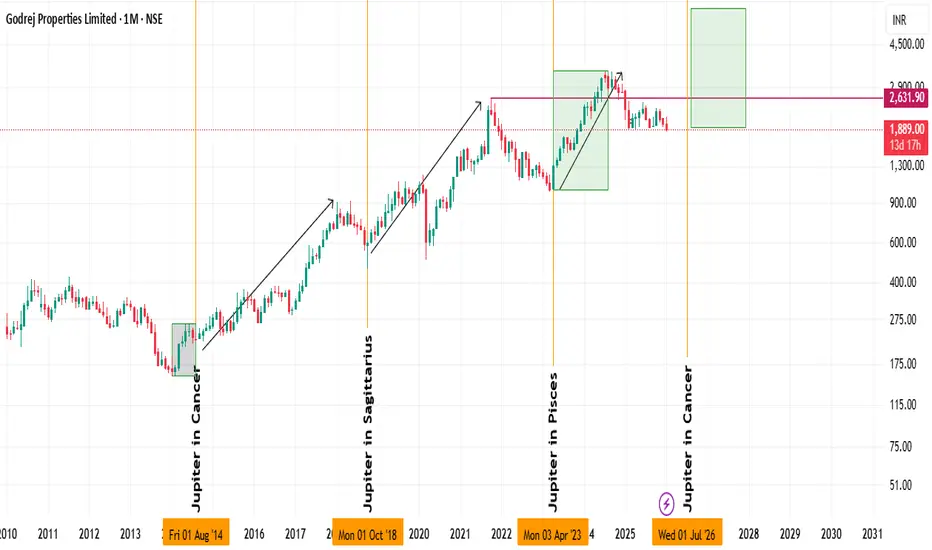
W. D. Gann TIME CYCLE VS ASTRO-TIME CYCLE (Real Estate Boom)W. D. GANN TIME CYCLE VS ASTRO TIME CYCLE
W. D. Gann and "Astro Time Cycles" are not actually opposing forces; rather, astrology was the secret engine behind Gann’s most famous time cycles.
While modern technical analysis often separates "Gann Angles" (math) from "Astro Cycles" (planets), Gann himself viewed them as the same thing. He believed the "Law of Vibration" governed both the movement of planets and the movement of stocks.
Here is the breakdown of how these two concepts relate and
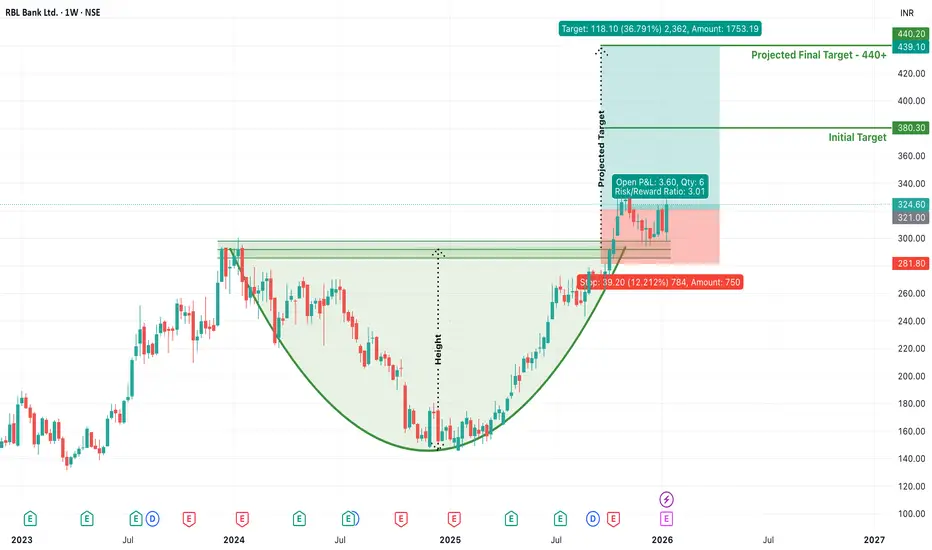
RBL Bank Shows a Powerful Cup Pattern Breakout on Weekly ChartRBL Bank has completed a textbook Cup & Handle pattern on the weekly timeframe, signaling a meaningful shift from a long consolidation phase into a fresh bullish trend. The rounded base formation highlights a gradual transition from distribution to accumulation, indicating growing confidence among long-term market participants.
The most critical development is the decisive breakout above the handle resistance zone, which had previously acted as a strong supply area. This breakout is supported b
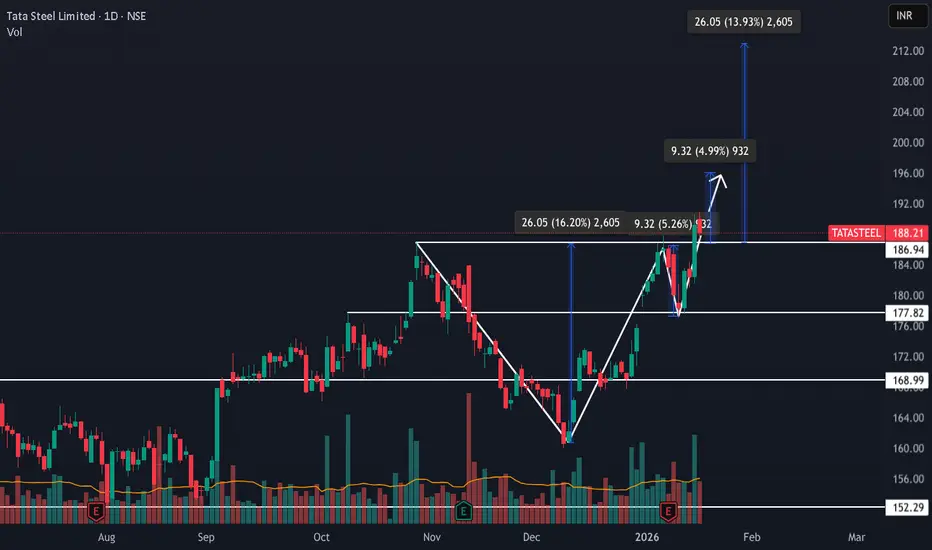
Tata Steel Ltd The chart exhibits a Cup and Handle pattern on Tata Steel’s daily timeframe.
1. Pattern structure:
Cup: Formed from Nov to early Jan, with a rounded decline and recovery, creating the “U” shape.
Handle: A tighter consolidation from mid‑Jan to Feb, retracing ~10–15% of the cup’s advance, which is typical for a healthy handle.
2. Breakout:
The price has pierced the handle’s resistance (≈₹178) with decent volume (26 M shares), confirming the bullish signal.
The breakout candle i
Understanding Inverted Head & Shoulder Pattern & RSI MomentumBase Chart : TATA CONSUMER PRODUCTS LIMITED
🔍 What is an Inverted Head & Shoulder Pattern?
Definition: The inverted head & shoulder is a bullish reversal pattern that often signals the end of a downtrend or prolonged consolidation.
Structure:
Left Shoulder: A decline followed by a rebound.
Head: A deeper decline forming the lowest point.
Right Shoulder: A shallower decline followed by recovery.
Neckline: The resistance line connecting the peaks between the shoulders and the head.
Psycholo
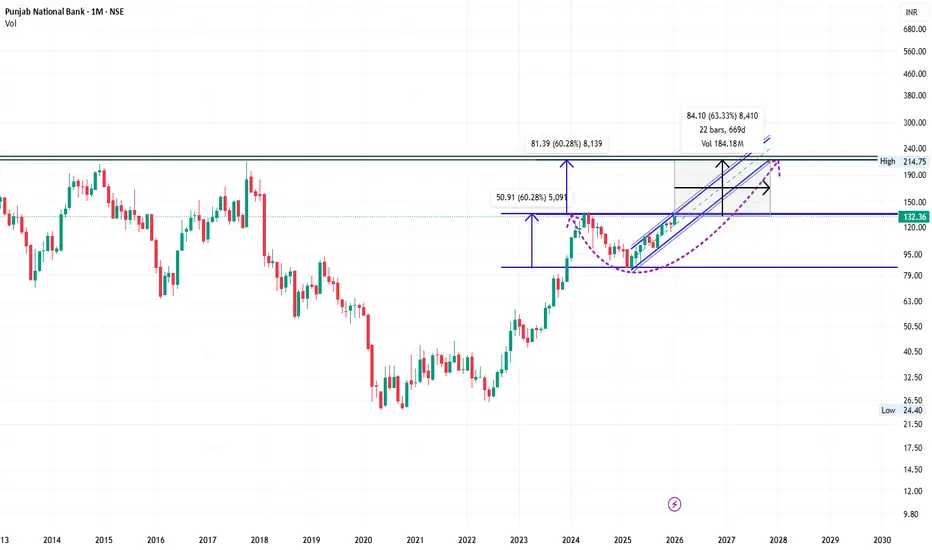
PNB Ready to touch ATH 225+ in next 1.5-2 Years timeframePNB Ready to touch ATH 225+ in next 1.5-2 Years timeframe
Fundamentals:
Stock is trading at 1.07 times its book value
Company has delivered good profit growth of 111% CAGR over last 5 years
Company has been maintaining a healthy dividend payout of 19.2%
Technical:
Chart has been forming rounding bottom on Monthly chart & is on breakout levels. Move above 145 will take the stock to 225+ Levels.
Timeframe - 1.5-2 Years
Earning potentials - 60%+
Happy Investing.
SBI Life: Double Top Signals Short-Term Downside RiskSBI Life Insurance is showing signs of a short-term trend reversal after forming a well-defined double top near the ₹2,105–2,110 zone on the hourly chart. The stock has slipped below its neckline support around ₹2,065, confirming bearish structure and indicating distribution at higher levels.
Momentum indicators reinforce the downside bias, with the RSI trending near 39 and MACD remaining in negative territory, suggesting selling pressure is still dominant. As long as prices remain below ₹2,08
ASTRAL ltd ready to move higher?No strong breakout yet. Stock is consolidating.
above 1500 looks like a breakout level
sl 20-25%
tp 50-75%
rrr 1:2
Key levels to watch:
Support: ₹1,400–1,420
Major support: ₹1,300
Resistance: ₹1,520–1,550
Astral has the potential to move higher, but the ride may not be smooth, there are mixed signals in the short term and fundamental drivers that matter most over the long run high-quality compounder going through a slowdown phase.
If you’re trading short-term, watch for confirmed breakout le
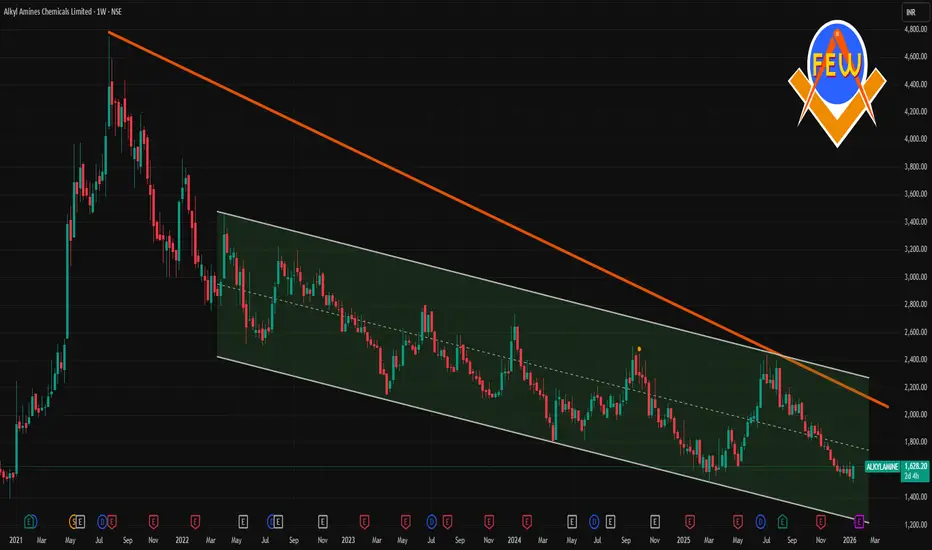
ALKYLAMINE 1 Week Time Frame 📌 Current Price (Latest Market Levels)
Approximate current trading price: ₹1,570 – ₹1,610 range on NSE (mid‑January 2026) — slightly below recent intraday highs/lows around this zone.
52‑week range: Low ~₹1,506 • High ~₹2,438.
Short‑term price action has been slightly bearish to neutral around this zone with some down‑side pressure evident.
📈 1‑Week (Weekly) Technical Levels
🔑 Weekly Pivot Levels
These come from multiple pivot calculations (classic & fibo), giving a weekly frame support/res
Apollo Tyres Ltd – Chart Analysis (Daily)Price has respected the ₹495–500 support zone multiple times, indicating strong demand at lower levels.
A bullish pin bar has formed near this support, suggesting rejection of lower prices and potential upside continuation.
Current price is trading above support and near ₹525–530, showing improving momentum.
Immediate resistance: ₹535–540
Trend bias: Neutral to bullish above ₹495; weakness only if support breaks decisively.
Disclaimer:
This chart analysis is for educational and informationa
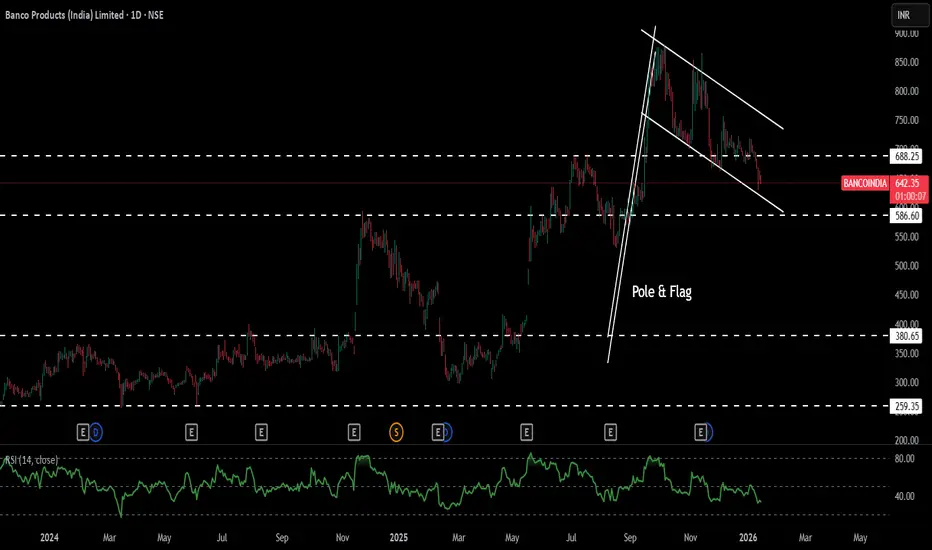
Banco Products (India) LtdDate 14.10.2026
Banco Products (India) Ltd
Timeframe : Day Chart
Highlight :
Despite of 38% rise in share price in the last 1 year the stock PE Ratio is still at 21
This is very rare occurrence in todays era in stock market, indicates strong earnigs & managment
About
Manufactures and supplies engine cooling modules and systems for automotive and industrial applications in both the domestic and international markets
Revenue Breakup
(1) OEMs: 55-60%
(2) Aftermarkets: 15%
(3) Export: 30%
BEL | Breakout WatchDescription
Bharat Electronics (BEL) is forming a clear Ascending Triangle on the daily chart.
Price has tested the ₹420–₹422 resistance zone multiple times.
Each pullback is making higher lows, indicating steady accumulation.
Price is now compressed near resistance, suggesting a potential breakout.
This structure reflects buyers absorbing supply and preparing for a directional move.
Trade Plan
Breakout Trigger
Daily close above ₹422
Entry
Above ₹423 after confirmation
Stop Loss
Below ₹41
BAJFINANCE : AT A GOOD SWING
Timeframe: Daily
Current Spot Price: ~₹949
Trend Context: Primary uptrend intact | Ongoing corrective phase
🔍 Technical Structure Overview
Bajaj Finance has completed a corrective ABC structure, where:
Wave (a) initiated the correction,
Wave (b) retraced upward,
Wave (c) is nearing completion near a high-probability demand zone.
The ABC completion zone (₹934–₹945) coincides with:
Rising trendline support
Prior structure demand
Short-term mean reversion support (7-SMA)
This confluence incr
AUROBINDO PHARMA – Bearish Breakdown patternAurobindo Pharma has broken down from a Double Top pattern , confirming bearish momentum.
🔻 Structure: Double Top Breakdown
🔻 Trend: Bearish
🔻 Volume: Breakdown supported by selling pressure
Trade Setup (Short):
Entry: Below Double Top neckline (breakdown zone)
Target: 1143 🎯
Stop Loss: 1221 ⛔
As long as price stays below 1221, downside pressure may continue. A decisive move towards 1143 is expected if bears maintain control.
⚠️ Disclaimer: This is for educational purposes only. Not fina
EMCURE PHARMA ANALYSISTHIS IS MY CHART OF THE WEEK PICK
FOR LEARNING PURPOSE
EMCURE PHARMA- The current price of EMCURE is 1540.60 rupees
I am going to buy this stock because of the reasons as follows-
1. It has given a breakout of last 15 months resistance with some good volume and looks great.
2. This stock has seen some great buying in last few months. After IPO, it went down but later it recovered.
This stock has been in my watchlist from last few weeks.
3. It is showing better relative strength as it stood
NETWEB: High-Conviction Support Bounce & Momentum ShiftNETWEB is demonstrating a powerful Breakout and Retest play. After clearing its 2024–2025 resistance levels near the ₹3,000 zone, the stock has pullbacked to test this area, which is now acting as a high-probability Demand Zone. This retest coincides with the weekly 20-SMA, increasing the conviction of a fresh upward leg.
Technical Analysis & Breakout Factors
Role Reversal (S/R Flip): The previous major supply zone around ₹3,000–₹3,100 has been comfortably absorbed and is now serving as s
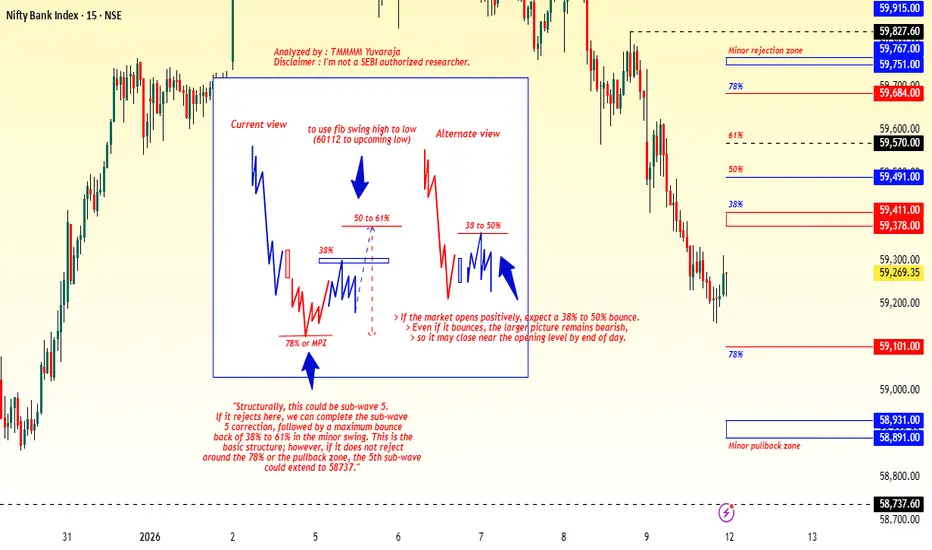
#Banknifty Directions and Levels for Jan 12thCurrent View
> If the market declines initially, the immediate support zone is expected to act as a strong support.
> If price gets rejected from this zone, structurally this could be a 5th sub-wave. In that case, the 5th sub-wave correction may complete here, followed by a bounce of around 38%–61% of the minor swing.
> This is the base structure. However, if price does not reject around the pullback zone, the 5th sub-wave could extend toward 58,737.
Alternate View
> The alternate scenario
HAL (W): Neutral-Bullish (Coiling Pre-Budget)Timeframe: Weekly | Scale: Logarithmic
The stock is in the final stages of a 7-month consolidation pattern (Descending Triangle). While typically a bearish pattern, in a strong structural uptrend (like Defense), this often acts as a "Pause" before the next leg up, especially with the Budget acting as a trigger.
🚀 1. The Fundamental Catalyst (The "Why")
The stock is waking up due to seasonality:
> Union Budget (Feb 1): We are 3 weeks away from the Budget. The market expects increased defe
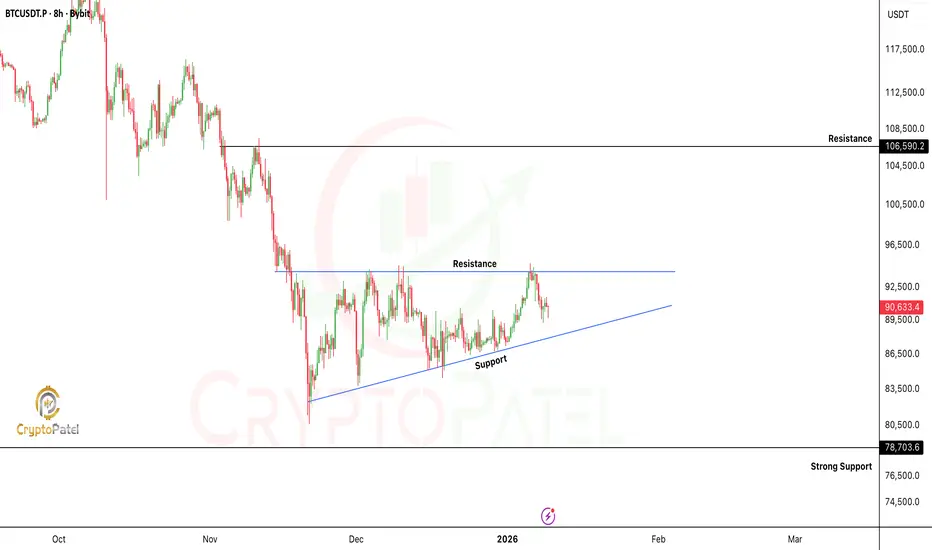
BTC | 8H Technical Structure UpdateBTC | 8H Technical Structure Update
Price Is Printing A Clear Ascending Triangle With Consistent Higher Lows Pressing Into A Well-Defined Horizontal Supply Zone At $94,500
Key Technical Levels:
🔹 Range High / Supply: $94,500 → $107,000
🔹 Ascending Trendline (Dynamic Demand): ~$88,000
🔹 HTF Demand / Structural Support: $78,000
Market Structure Read:
🔹 Compression Phase Ongoing
🔹 Volatility Expansion Imminent
🔹 Trendline Continues To Act As Acceptance Support
🔹 Liquidity Resting Above Range Hig
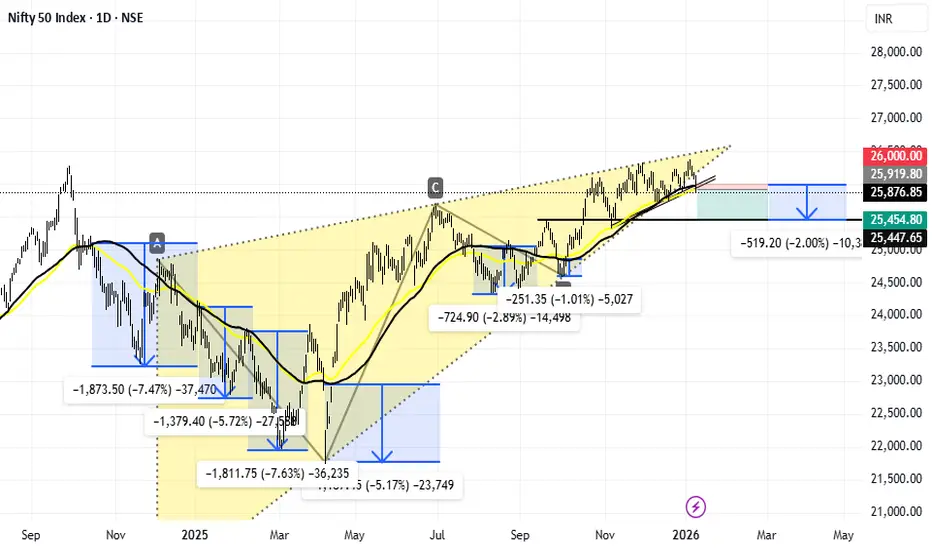
NIFTY 50 – Close Below 50 EMA & SMA | Downside Levels IdentifiedTechnical View:
Over the last two years, NIFTY has consistently shown that a daily close below both the 50 EMA and 50 SMA results in an average correction of 4–5%.
🔍 Current Structure:
Price has closed below 50 EMA & 50 SMA
Rising wedge structure near the top → breakdown risk
Weak follow-through after the recent high
🎯 Downside Levels (Supports & Targets)
🔹 Immediate Support: 25,450 – 25,400
(Recent demand zone & neckline support)
🔹 Target 1 (≈2%): 25,350 – 25,250
(First reaction zone af
Short term Analysis of RelianceWrap up:-
Reliance is making a wxy pattern in wave c and has completed its wave w at 1581 and wave x is expected to be completed near 1450. Thereafter, Reliance will head towards wave y.
What I’m Watching for 🔍
Buy Reliance in the range of 1460-1480 sl 1440 for a target of 1578-1687.
Disclaimer: Sharing my personal view — only for educational purpose not financial advice.
"Don't predict the market. Decode them."