COFORGE – Weekly Chart | Clean Technical ViewNSE:COFORGE
🔹 Trendline + 50 EMA Support:
Price has pulled back into a rising weekly trendline, and the 50 EMA is sitting right there. This confluence is the key zone.
🔹 Price Action:
Rejection from 1950–2000 came with a controlled pullback, not panic selling. That tells me distribution isn’t aggressive yet.
🟢 Buy Zone (Support-based): 1680 – 1700
NIFTYIT Sector About to go for a Breakout attempt
🔹 Bias:
Above trendline + 50 EMA → bullish bias intact
Weekly close above 1750–17
Community ideas
SRF LTD: Price Compression at Key Resistance|Clean Breakout Play📌 Structure: Daily Timeframe
SRF has been consolidating inside a clean descending channel, printing lower highs while demand holds near the channel base.
Price is now pressing against well-tested channel resistance — a clear decision zone.
🔴 Key Reads
Descending resistance respected multiple times
Tight price compression near supply → volatility contraction
Buying interest visible near demand
Muted volume during consolidation → pre-expansion behaviour
This is structure-led, not momentum-driven
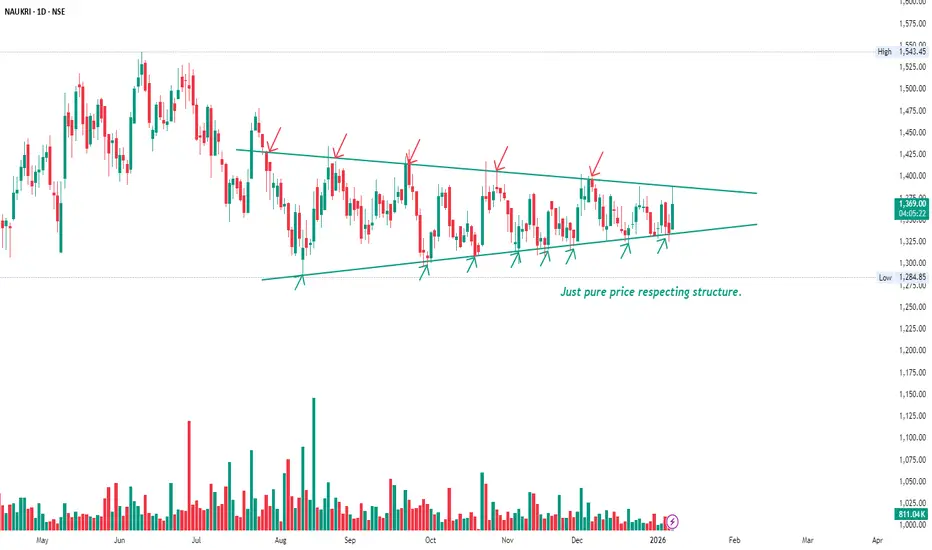
NAUKRI – Tight Range, Clear Structure, Price Under CompressionPrice has been moving inside a well-defined converging range, with lower highs pressing from the top and higher lows holding from the bottom.
Each rejection from the upper line and each response from the lower line shows that both buyers and sellers are active, but volatility is gradually compressing.
This kind of structure usually forms when the market is digesting the previous move and deciding the next direction.
No indicators, no assumptions — just pure price respecting structure.
At this
SAIL - Weekly - LongThis is a weekly chart of the SAIL, so it is useful for positional or swing trading.
First, let’s understand the trend based on the markings.
Earlier on the left side, the stock was making lower highs and lower lows, which clearly shows a downtrend. This phase is marked with “lower low” arrows. After that, the selling pressure reduced and the price started stabilizing. From the middle of the chart onward, you can see the structure changing. The stock started making higher lows. This is the firs
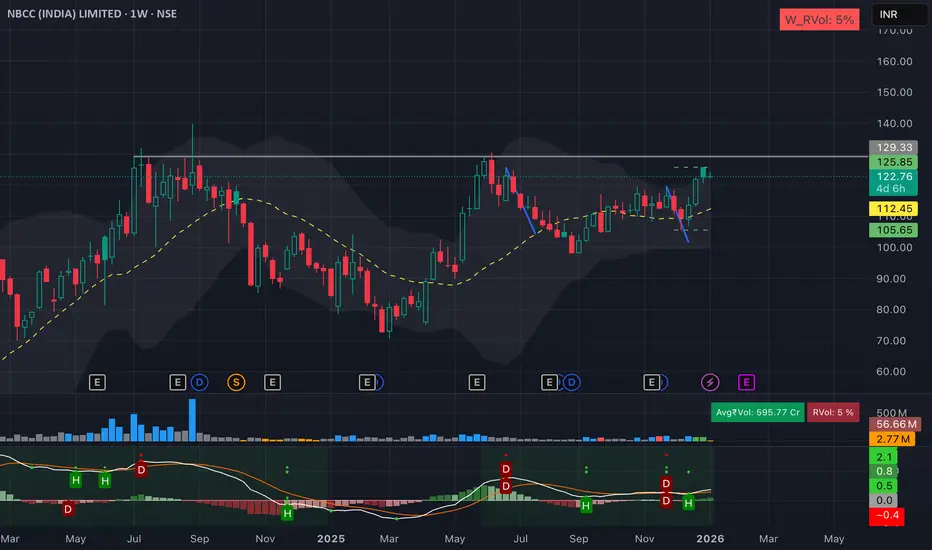
NBCC (India) Ltd | Weekly Consolidation Breakout SetupNBCC is showing a constructive weekly structure after a healthy pullback.
Price is holding above key moving averages
Higher lows indicate trend continuation
Tight consolidation near resistance suggests accumulation
Setup favors a range breakout on strength
Trade View:
Buy on strength above ₹125
Support zone: ₹112
Target - 140-150-160
Upside: Gradual move towards prior highs if breakout sustains
⚠️ Purely technical view. Risk management is essential.
SANSERA ENGG@1871Not a SEBI registered, just sharing idea. On weekly time frame SANSERA @1871 gave breakout from rounding bottom @1767 with volume. Entry can be made 1871 and @1767, SL-1700 Target 1-2600 in 2-3 month, 2-3300 in 5-6 month. It is in Bull trend RSI on DAILY, WEEKLY >70 and MONTHLY>=70.
Crompton Greaves Falling?Technical (upgrade)
Crompton Greaves Consumer Electricals has been sliding inside a falling wedge, but price is trying to base around ₹248-252 (teal support on your chart). A daily close above ~₹260–262 (wedge top/near-term trendline) would confirm a breakout and set up a move toward ₹275 first and ₹300 next If price fails and closes back below ₹248, treat it as a false start and expect the downtrend to resume keep risk tight in that zone.
Fundamentals (quick, clean)
Latest print showed mi
BHEL – Weekly Trendline Still in ControlBHEL continues to trade in a strong uptrend on the weekly timeframe, with price respecting the rising trendline and closing near the recent highs around ₹299.50. The series of higher highs and higher lows remains intact, and the latest bullish weekly candle reinforces the strength of buyers along this trendline support
As long as the stock holds above this rising trendline and the recent swing low on weekly closing basis, the bias stays positive and dips toward the trendline can be treated as b
Crompton Greaves Cmp 252 Reversed from supportCrompton Greaves Cmp 252 dated 2-1-2025
1. Rectangle Consolidation
2. Price reversal from support
3. Price increase with Volumes
4. RSI reversal
5. Good Risk Reward Ratio
Buy above 254 SL 245 target 256-258-260-262-265
268-270-272-275-280
It is just a view, please trade at your own risk.
BPCL : Trading the Confluence of Price Action & Macro TailwindsThe stock has been consolidating within a defined range over the past few weeks and has recently started forming a solid base. While the breakout volume isn’t a classic “God-candle,” price action continues to hold firmly above key moving averages, which is a constructive sign. That said, the price is somewhat extended from the EMAs, increasing the probability of a mean-reversion move. Hence, the stop loss needs to be placed wider rather than just below the basing structure.
The conviction behin
GIFTNIFTY IntraSwing Levels For 02nd JAN 2026🚀Follow & Calculate Premium with NIFTY Post for NF Trading
💥Level Interpretation / description:
L#1: If the candle crossed & stays above the “Buy Gen”, it is treated / considered as Bullish bias.
L#2: Possibility / Probability of REVERSAL near RLB#1 & UBTgt
L#3: If the candle stays above “Sell Gen” but below “Buy Gen”, it is treated / considered as Sidewise. Aggressive Traders can take Long position near “Sell Gen” either retesting or crossed from Below & vice-versa i.e. can take Short po
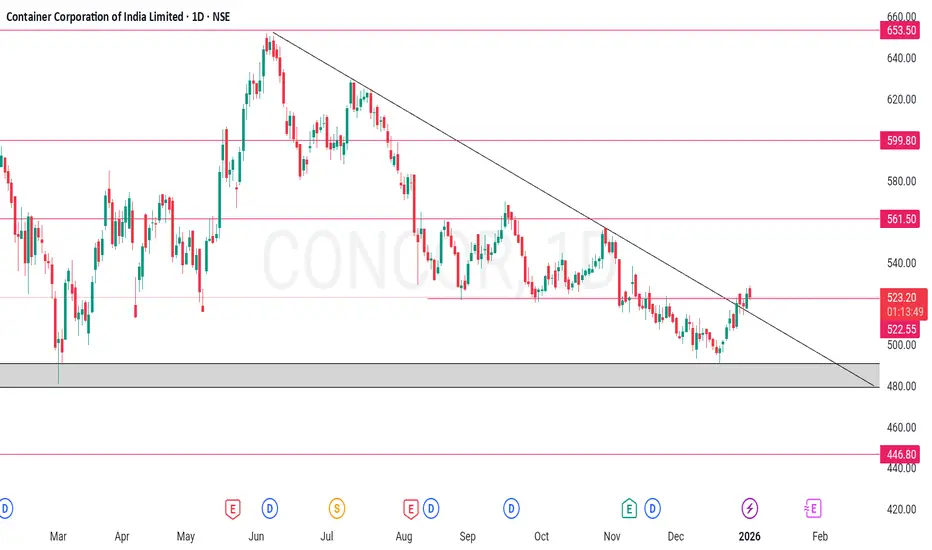
CONCOR – 1D | 10-Year Support & Trendline BreakoutCompany Intro:
Container Corporation of India Ltd (CONCOR) is a Navratna PSU and India’s largest integrated logistics company, operating inland container depots (ICDs), container freight stations (CFS), and rail-based logistics services. It plays a key role in India’s EXIM trade and domestic freight movement.
Technical View (Daily Chart):
CONCOR has broken out above a 10-year long-term support trendline, indicating a structural trend reversal, The stock has given a strong close near ₹525, con
LongKey Points About Your Breakout Strategy
Identify breakouts using recent pivot highs and lows.
Clear entry, stop-loss, and target levels from the indicator.
Trade only when price breaks support or resistance.
Targets set using risk-reward from recent highs/lows.
Capture momentum while managing risk with stop-losses.
-------------------------------------------------------------------------------------------------------------
Essential Disclaimer:
For educational purposes only; not financial advi
Kotak Mahindra Bank - Bulls Wish Happy 2026 Ahead!!!Kotak Mahindra Bank after 4 years of tight consolidation , has given a Beautiful 2025 Yearly Breakout!!!
It is trading inside a expanding ascending channel pattern from 2014 till now ....taking support and resistance at respective channel lines( shown below- 6month timeframe chart )
Chances are less for a down move after this clean yearly breakout... .Breaking 2059.2 will be a warning sign and possibly delay the upmove...(not for long term investors....)
Monthly time frame chart view b
NIFTY Set to Sign Off 2025 Quietly—Could 2026 Bring a Rally?As we enter the last week of 2025 and approach the first week of 2026, Nifty is doing something familiar—consolidating in a tight range.
Everything looks calm at first glance: volatility is very low (India VIX at 9.15), trading volumes are light, and price changes are small. But history shows that such calm often comes before a big move.
◉ What it means actually?
● Nifty near lifetime highs, but breadth remains weak
● Low volatility → calm market, but risk of sudden moves
● Traders aren’t ch
Volume building to go longTimeframe: Daily
Trend: Uptrend
Structure:
• Support: 560
• Resistance: 625,645
• Key Level: 607
View:
If Price holding above 607 level. both targets are achievable
Target1: 625
Target 2: 645
Risk Note:
Invalidation below 560.
⚠️ Educational & analytical view only. No investment advice.
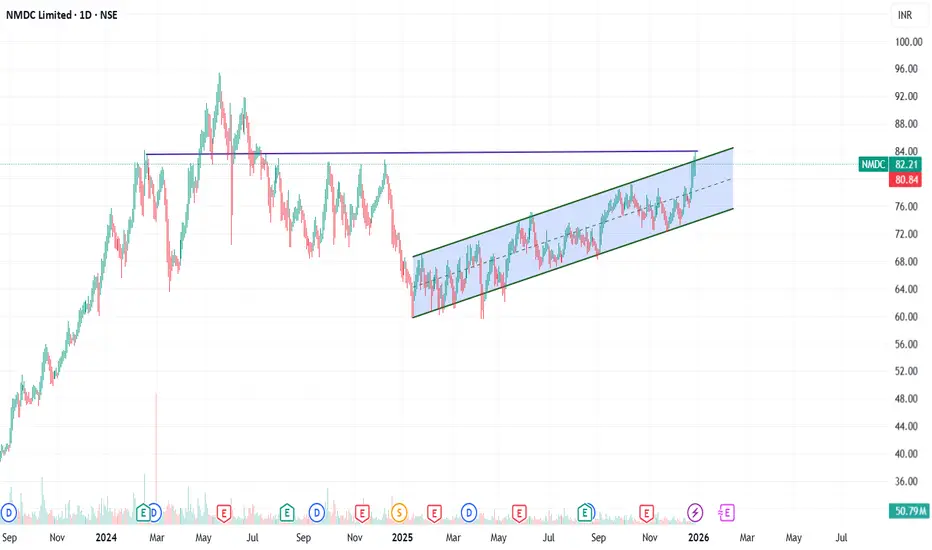
NMDC.. Can give breakout if moved out of this channell.MNDC is trading inside a channel as seen.. Tried to give breakout today but faced resistance at around 84.20..
Volume is building..
Need to hold above 84 for further movement.
If sustained then can go up to 90..
One can book profit at somewhere around 90 or trail the same..
Axis Bank — Positional Long Setup | Plan the Pullback🟢 Long Plan – Buy the Dip Zone
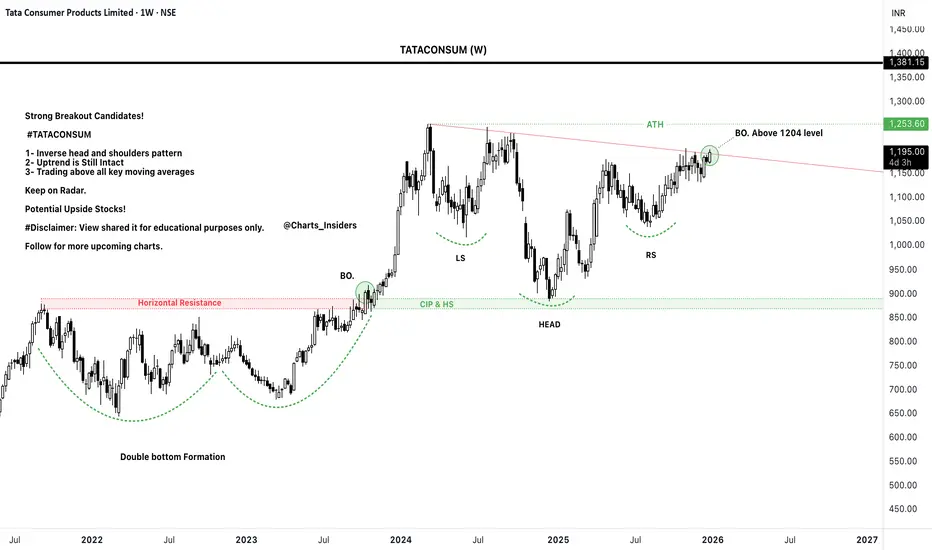
🛒 Entry Zones
Entry 1: around ₹1140
Entry 2: around ₹1132–₹1124 (deeper fill zone)
⛔ Stop Loss
Below ₹1124 (decisive breakdown = setup invalid)
🎯 Upside Targets
Target 1: Previous support retest near ₹1214
Target 2: Resistance retest around ₹1274
Target 3: Trail the position toward ₹1528 if momentum continues
I prefer partial booking + trailing SL as price moves higher.
Trade Logic: A positive Trend & Pulse on daily and weekly time frames + A strong Demand Zone
Modern Insulators - Rounding Bottom PatternModern Insulator is heading towards a 100% gain. Factors:
1. Rounding Bottom Pattern on weekly time frame - look at last week's bullish candle
2. All Time High Breakout - ATH breakout from 2024 price, after so many rejections it has finally given a breakout
3. Company has shown growing revenue and profit trends, QoQ profits are increasing. 50% of revenue from exports.
4. Electrification of Indian Railways - Modern insulators is one of the largest supplier of insulators to railways.
Given the
Strong bullishcase for NALCONational Aluminium Company Ltd | Weekly Elliott Wave Update
On the weekly timeframe, price has already exceeded the typical projection for Wave (5), confirming that the market is well into an ongoing impulsive phase, not a pending one.
Key structural observations:
Both Wave (2) and Wave (4) retraced close to 61.8%, indicating deep corrective behaviour earlier in the trend.
Despite these deep retracements, price has now surpassed the common Wave (5) target zone, strengthening the bullish case