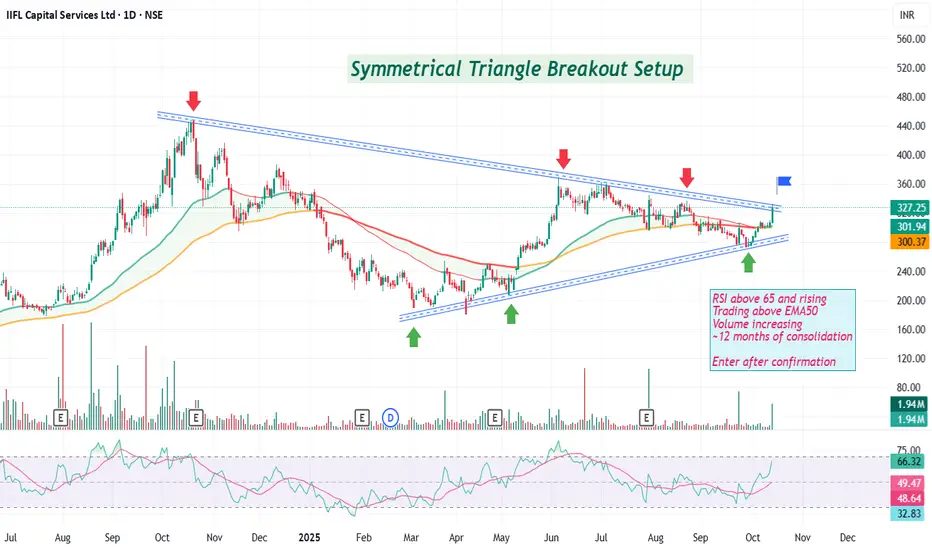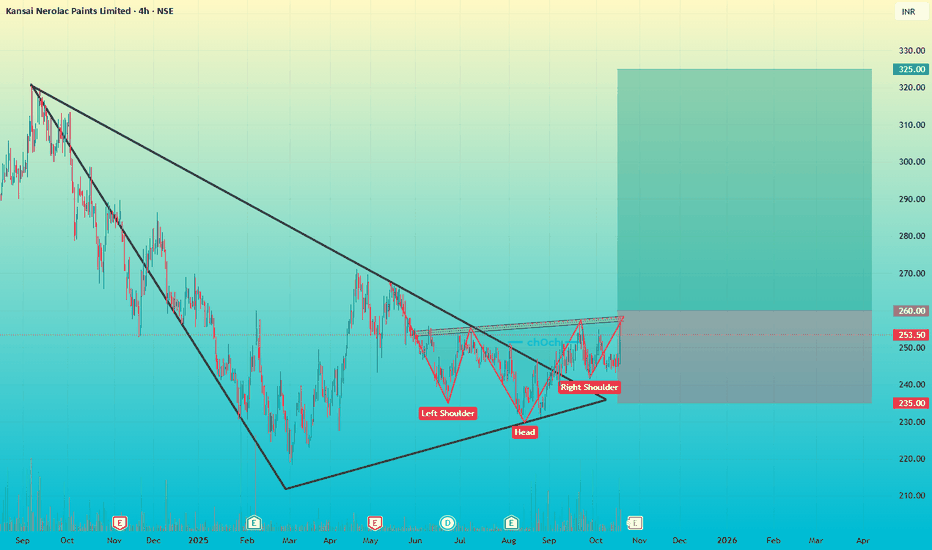
Kansai Nerolac – Triangle + Inverse H&S | Bullish Move loadingKansai Nerolac Paints – Symmetrical Triangle + Inverse Head & Shoulders Breakout Setup
Timeframe: 4H
Trend: Bullish Reversal in Progress
Price has been consolidating for months within a symmetrical triangle structure.
Inside the triangle, an Inverse Head & Shoulders pattern has formed — a classic bullish reversal signal.
A clear Change of Character (ChoCh) indicates a shift from bearish to bullish market structure.
A breakout above the upper trendline could confirm the start of a new uptren
Community ideas
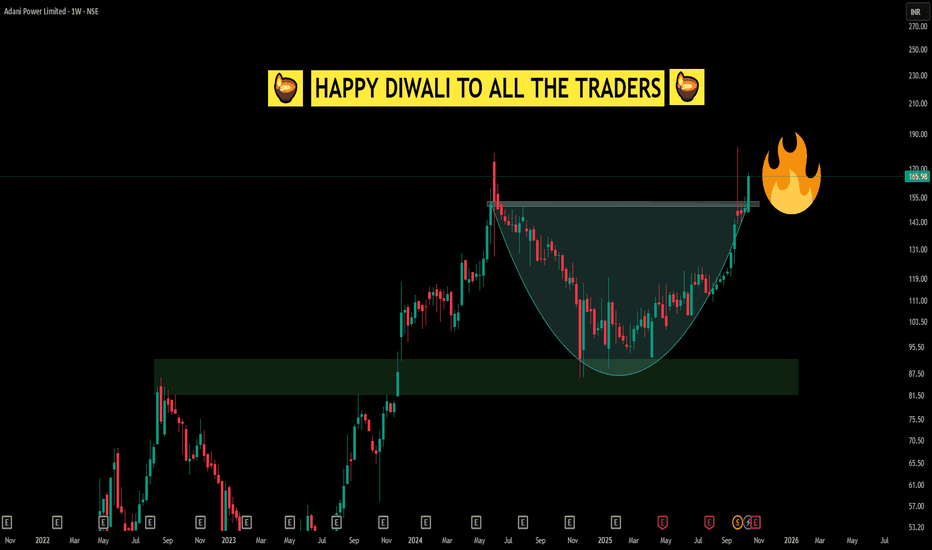
Simple CUP Pattern looking like a Diwali Diya Happy Diwali to All Traders!
This Diwali, the chart tells a special story—a classic cup breakout, but look closely and you'll notice it also resembles a beautifully lit diya. Just like Diwali celebrates the light conquering darkness, this breakout is a reminder of the power of patience, conviction, and disciplined observation in trading.
The cup pattern, much like the diya, signifies a period of accumulation, resilience, and hope before an illuminating breakout. As traders, we learn that endur
#PNB | Inverse Head & Shoulders Bullish SetupCMP: 113.70
🔼 Key Resistance Levels: 118 / 120 / 143
🔽 Key Support Levels: 113.30 - 110.50 / 107.30
❌ Invalidation Level: 100.60 (Weekly Close Below)
✴️ Breakout Point: Weekly close above the neckline (Pink dotted line) 👀
🎯 Pattern Target: 145 (+27% from CMP)
#PNB | #InverseHeadAndShoulders | #ChartPatterns | #PriceAction | #SwingTrading
📌 Disclaimer: This analysis is shared for educational purposes only. It is not a buy/sell recommendation. Please do your own research before m
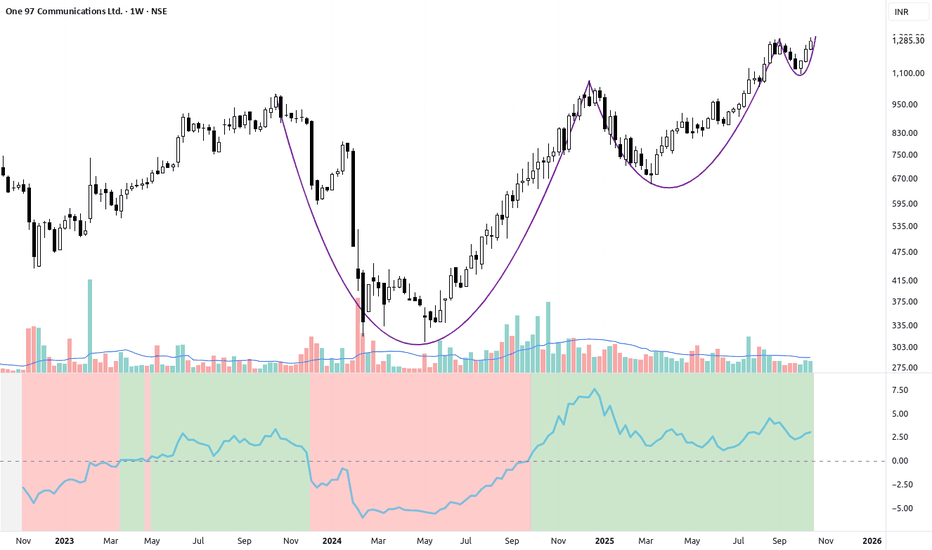
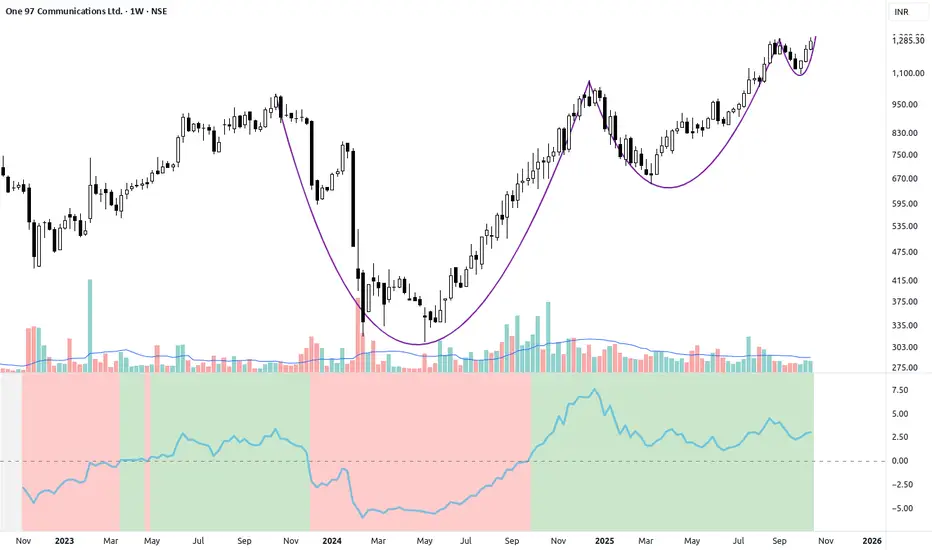
PAYTM (ONE97) - Power Consolidation at 52-Week HighsThe Setup: Major Base Breakout in Progress
ONE97 has transformed from a long-term downtrend into a powerful uptrend. The chart shows a massive multi-year base (a large rounded bottom) that is now being successfully broken out of. This transition signals a potential paradigm shift in the stock's long-term structure.
The final leg of this base is crucial:
The stock has powered past multiple resistance levels and is now consolidating right at its 52-week high and the major pivot near ₹1,285.
Th
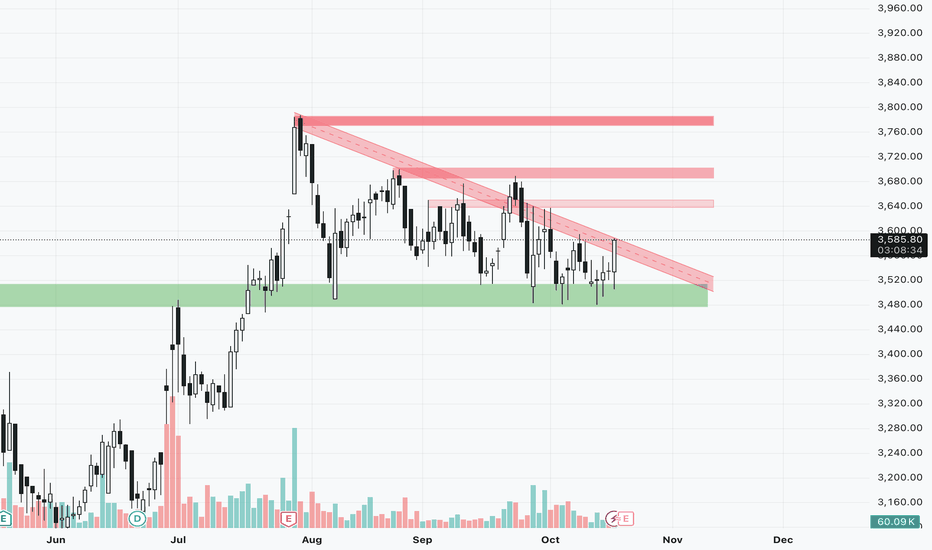
Torrent Pharma Long Swing CandidateChart Analysis :
Price making a flat decending triangle pattern while holding a major weekly support of 3500 levels and looking to breakout above the trendline resistance zone and can be considered for long. One can enter here or wait for 3600 above daily close or one hour sustain above 3600.
Key Levels :
Targets (Resistance) - 3650/3685/3700/3750
StopLoss (Major Support) - 3500 below daily close
Disclaimer:
I am not SEBI registered. This analysis is for educational purposes only and no
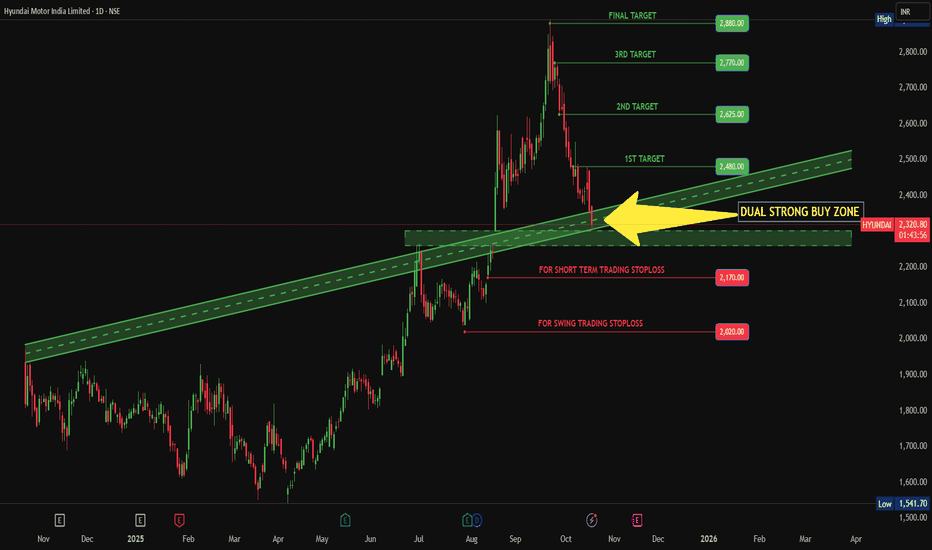
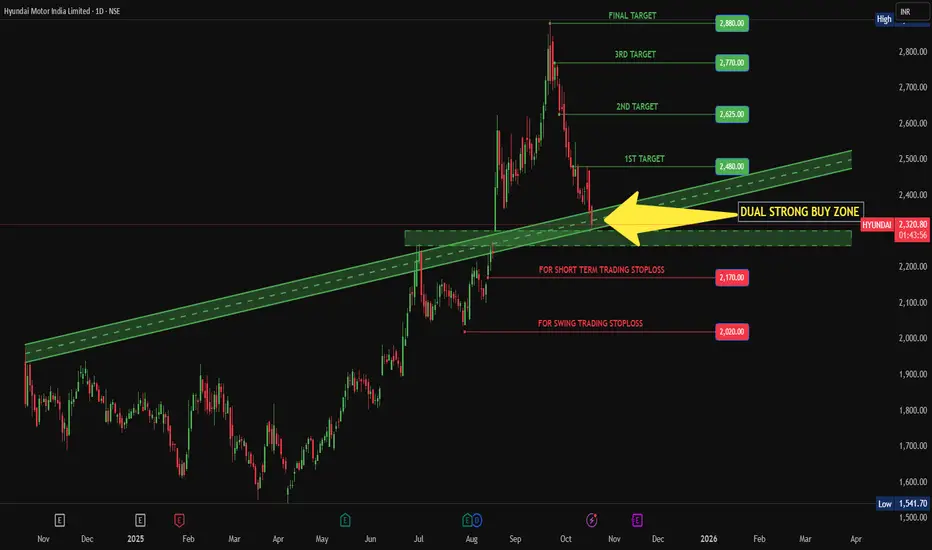
HYUNDAI IN STRONG BUY ZONEHyundai Motors India reach at dual strong buy zone area to consider as a long trade, use your skill as well knowledge to enter in a trade not guaranteed return. Do your own research than make a trade. But technically and fundamentally Hyundai is in good spot to consider as a long trade.
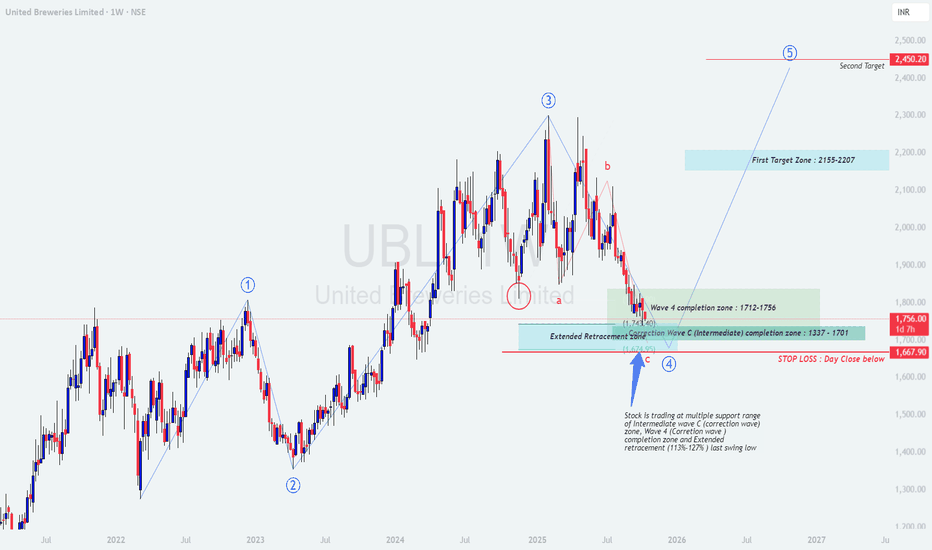
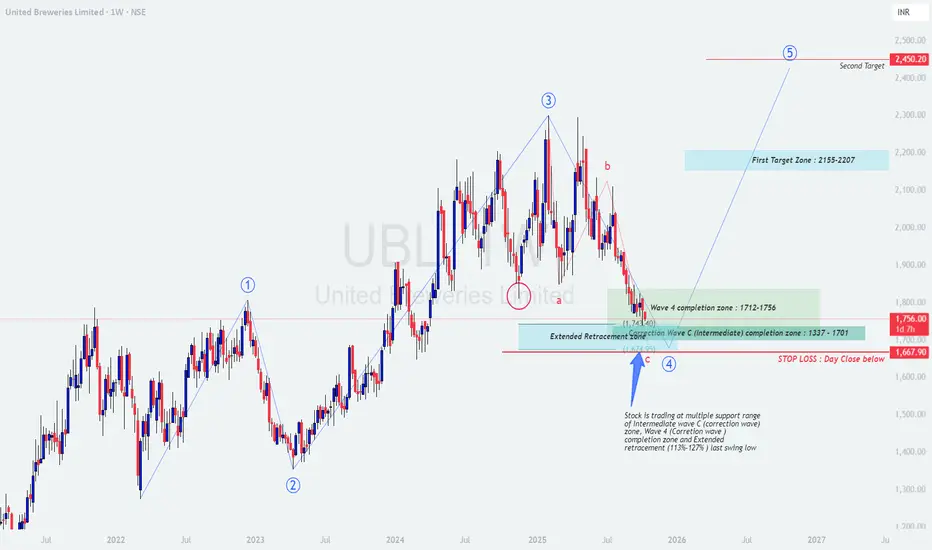
UBL (United Breweries) – Weekly Swing Trading PlanUBL (United Breweries) – Weekly Swing Trading Plan (Educational)
Structure overview
Price has completed a multi‑month corrective leg into a confluence support cluster: Wave‑4 completion zone 1712–1756 overlaps with the projected Wave‑C (intermediate) completion band 1701–1337 and the extended retracement window from the last swing 113%–127%. The market is attempting to base near this cluster with downside risk defined by the recent swing low.
Bias is accumulation-to-reversal as long as pric
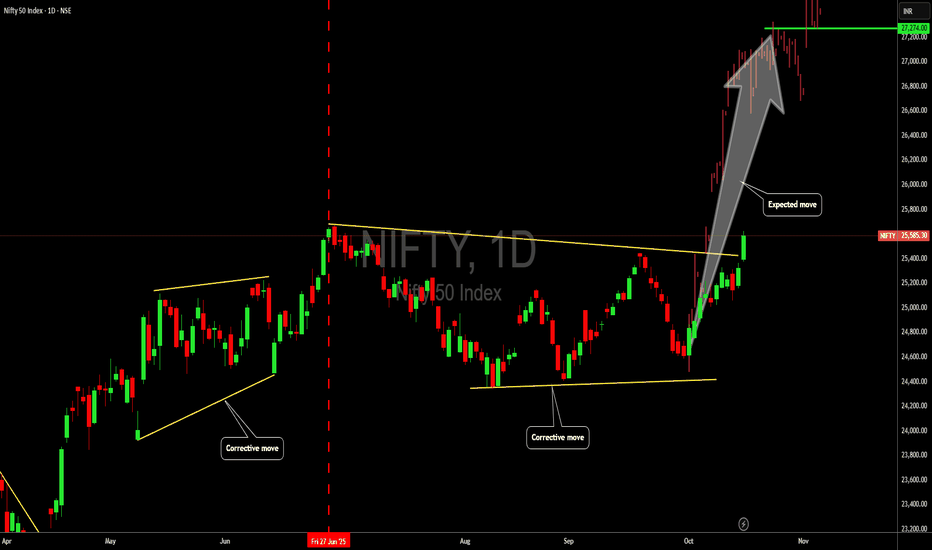
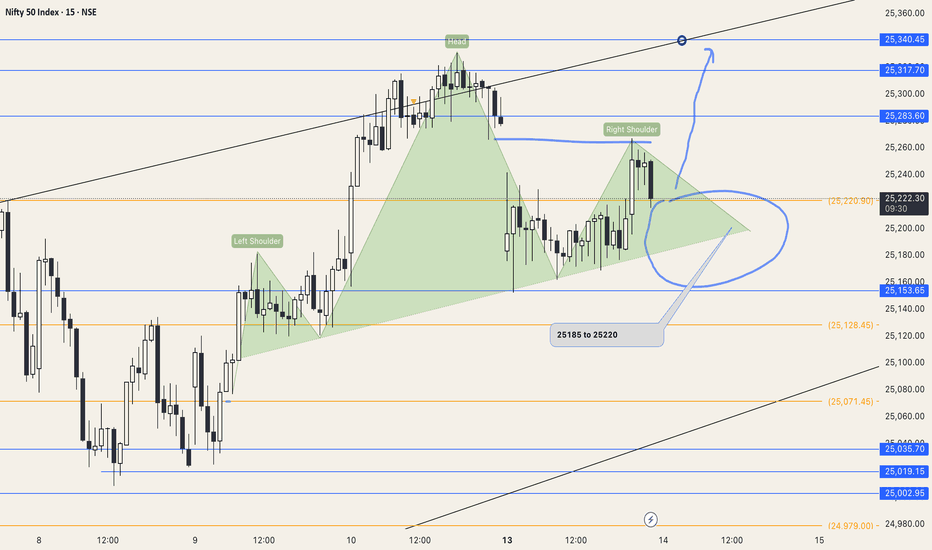
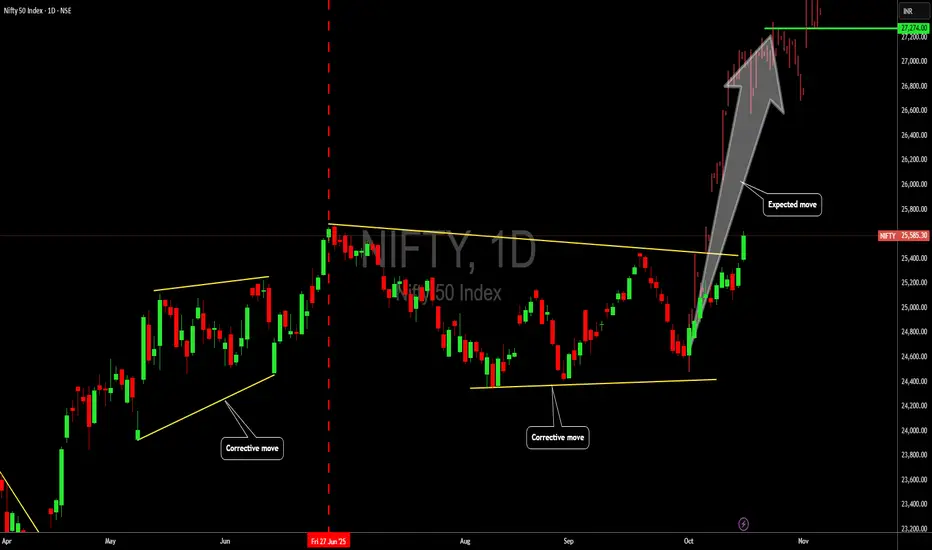
Bulls coming in on the Nifty50 indexHello,
Since June 27th, 2025, the Nifty 50 index has been undergoing a correction phase, reflecting a temporary pause in the market's strong upward trend. Recent market data, however, indicates that this corrective phase is likely behind us, paving the way for renewed bullish momentum. This development offers a timely opportunity for investors to consider entering the market.
The correction served as a healthy consolidation, allowing for the market to digest previous gains and set a firmer fou
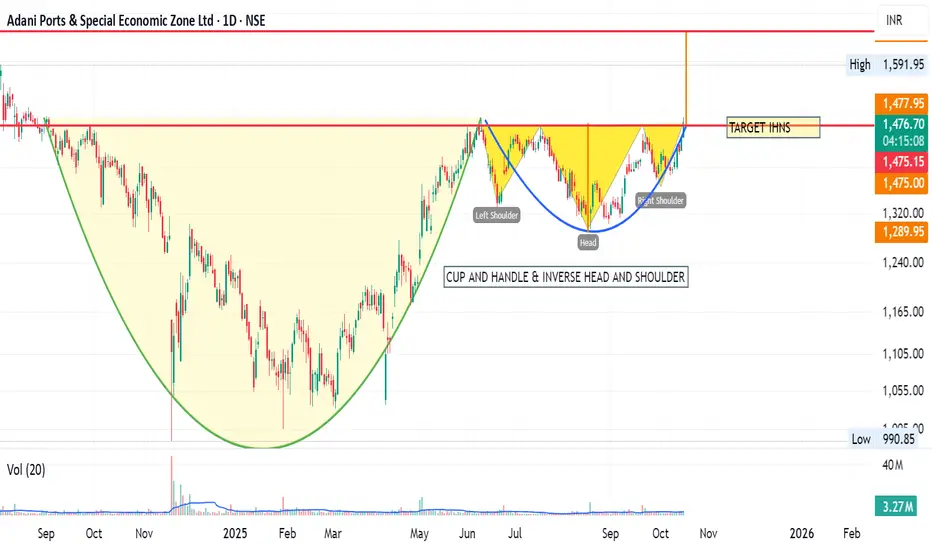
Cup and Handle & Inverse Head and Shoulder in Adani Ports.The Stock Had Formed Cup And Handle & Inverse Head and Shoulder. It seems to breaks out of the Neckline, it may hit the IHNS target of 1662 approximately. And than Target of Cup & Handle. Lets see how it unfolds .Rest targets will be updated as chart unfolds. All Targets mention are Approximate. Good luck. TY .
ITS JUST PURELY FOR LEARNING AND EDUCATIONAL PURPOSE. Please Consult your financial advisor before trading or investing. I am not responsible for any kinds of your profits and your losse
Goderaj Properties Technical analysisGodrej Properties has formed a triple bottom pattern at the demand zone (₹1,850–1,900), signaling strong accumulation and reversal from support. Price has broken above the CISD neckline (~₹2,100) with strong bullish candles and volume confirmation — indicating breakout strength.
Outlook:
Momentum remains bullish; next resistance lies near the supply zone ₹2,450–₹2,500.
Support: ₹2,080
Target: ₹2,400–₹2,500
Bias: Bullish above ₹2,100
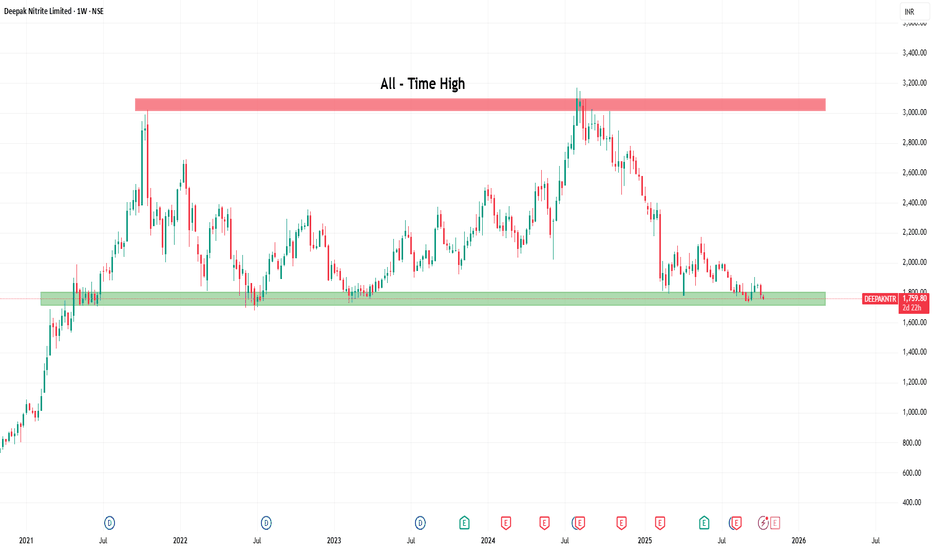
Deepak Nitrite Ltd: At a Crossroad After a Decade-long Rally🔍 Technical Analysis
Deepak Nitrite has experienced an extraordinary rally over the past decade—from below ₹100 to a peak near ₹3,000 in October 2021. The ₹3,000–₹3,200 zone has repeatedly acted as resistance, while the ₹1,700–₹1,800 range has served as a strong support zone. Currently, the stock trades around ₹1,760, hovering near that support.
Lately, fundamentals have decelerated: after years of strong growth until ~2022, the company has faced negative year-on-year profits in recent period
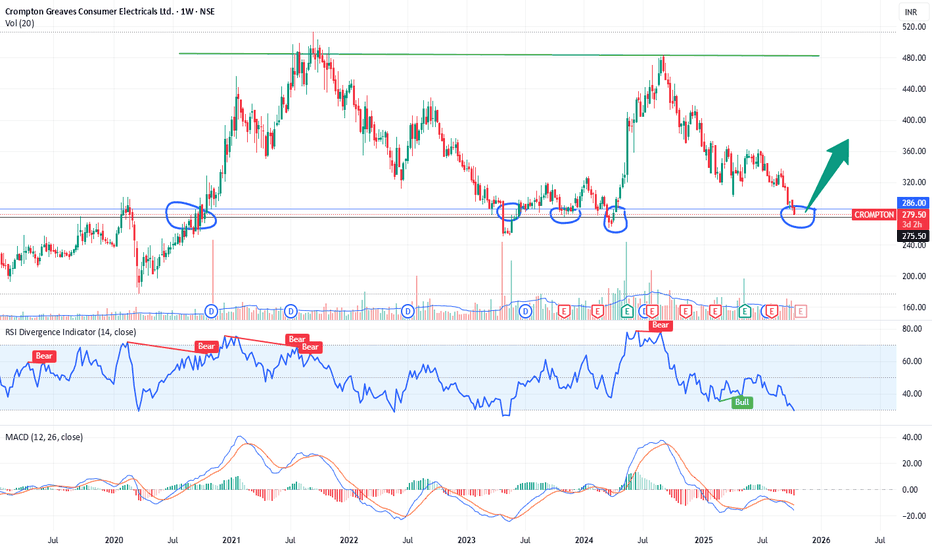
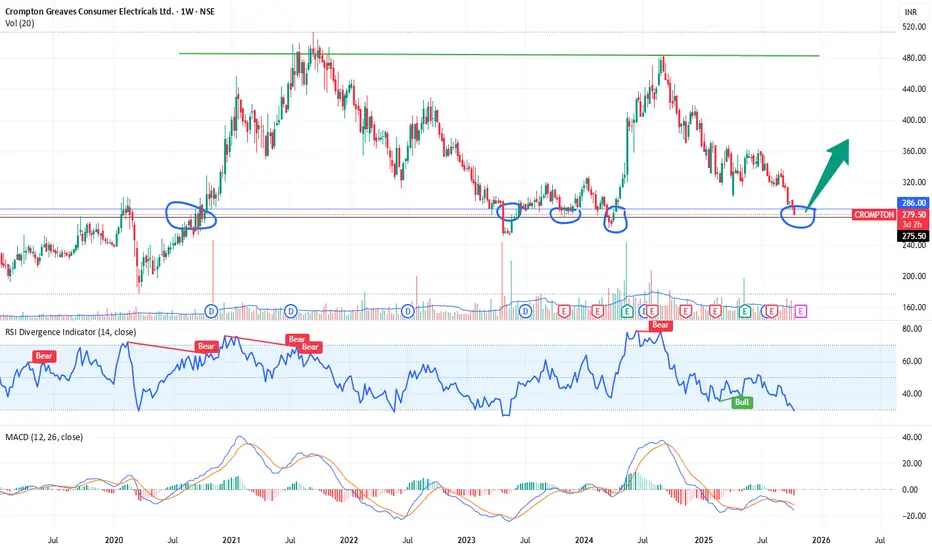
Crompton 52-Week Low Reversal Setup – Oversold Swing Trade1. Price Action
The stock is trading around ₹279–₹286, which is exactly at its 52-week low and a historical support zone from mid-2022.
Previous rebounds from this same area have led to 30–40% upside swings, indicating it’s a well-tested demand zone.
2. RSI (Relative Strength Index)
RSI at 23.8 → clearly oversold, near the lower extreme of its historical range.
In past instances (see mid-2022, mid-2023), RSI below 30 at this price level resulted in strong upward bounces — a potential bullish di
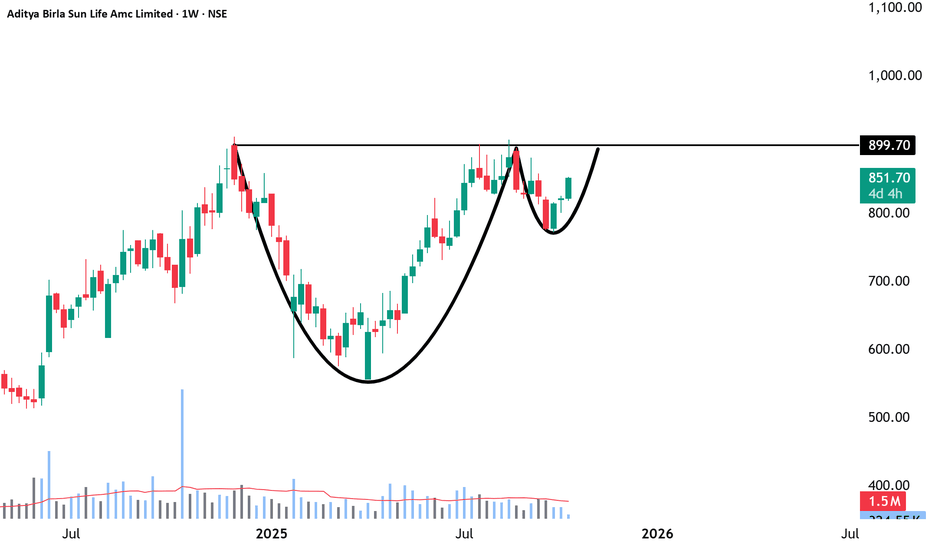
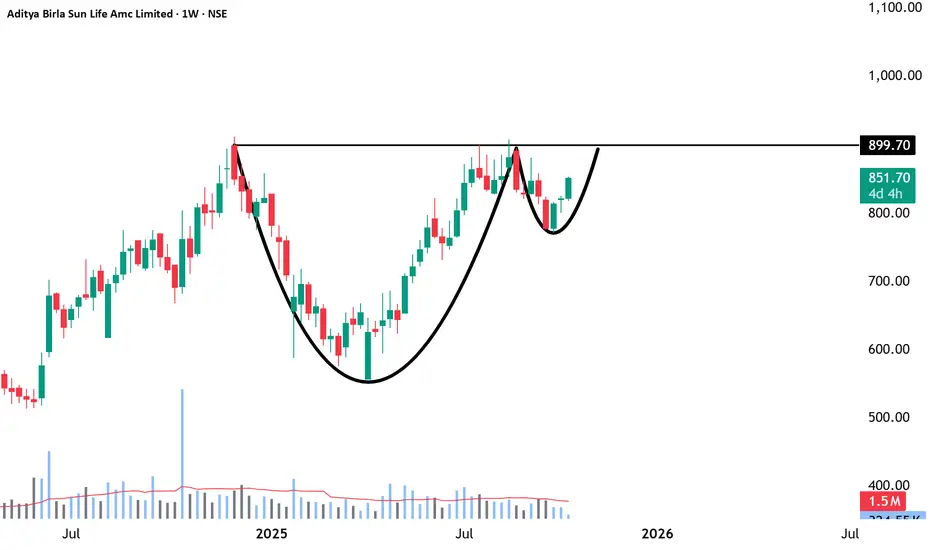
Aditya Birla Sun Life AMC-Built to Compound, Poised to BreakoutNSE:ABSLAMC
🔹 Fundamental Overview
Business Strength—One of India’s leading asset management companies, part of the Aditya Birla Group; operates across mutual funds, PMS, and AIF segments.
Financial Health – Debt-free balance sheet with excellent profitability and high cash reserves.
Profitability Metrics – ROE around 28%, ROA near 25%, and net margins above 50%, indicating strong operational efficiency.
Growth Trend – Revenue and net profit are both growing at ~20–25% YoY, supported by
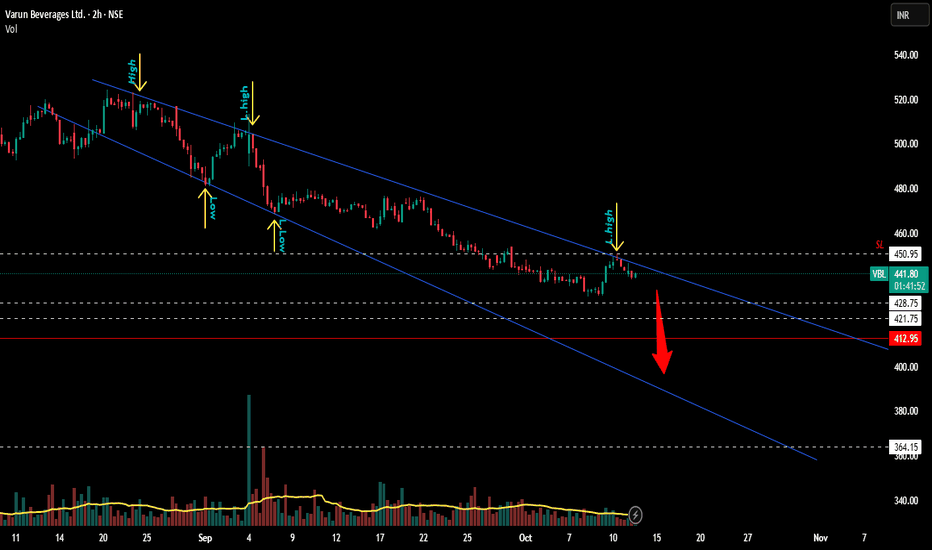
VBL Looking Bearish??!!!VBL - On Weekly timeframe,
Inverted cup&handle pattern and a breakdown visible!!! (shown below)
On Dailytimeframe,
VBL is travelling inside a Descending channel pattern making highs and lowerhighs...lows and lowerlows...
SL & Target levels shown @ chart!!!
Let's wait & watch!!!
Thank you!!!
Just my view...not a tip nor advice!!!!
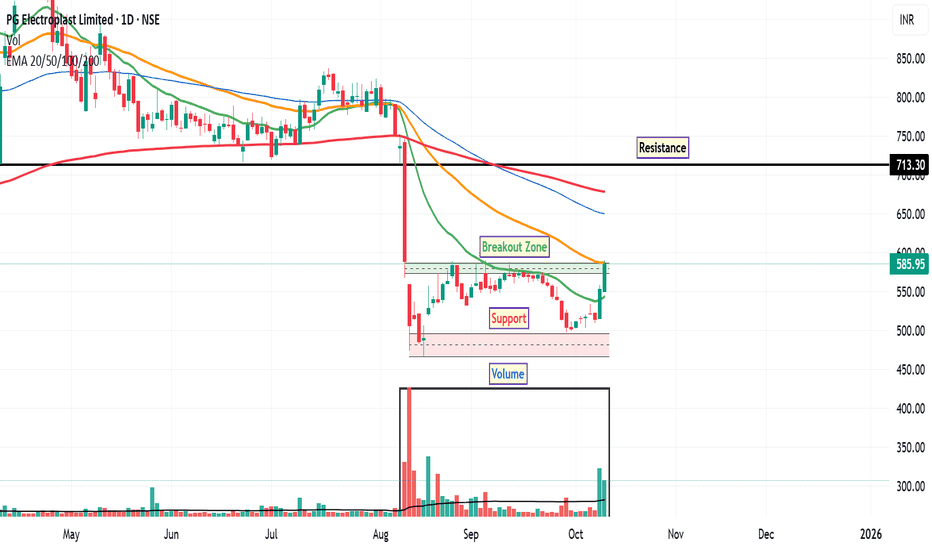
PGEL: Suggest Momentum ShiftPG Electroplast Ltd. (PGEL) has recently shown signs of emerging strength after a prolonged phase of consolidation. Over the last two trading sessions, the stock has demonstrated upward momentum, suggesting a possible attempt to break out of its range-bound structure. This observation is supported by several technical factors:
1. Moving Averages & Volume Dynamics
The stock has successfully closed above the 20-day EMA, indicating short-term bullish sentiment.
It is currently trading near the
Ixigo (W) - At a Crossroad: Bullish Trend vs. Bearish PatternAfter a spectacular run-up, Ixigo (Le Travenues Technology Ltd) has entered a sideways consolidation phase. The current price action presents conflicting technical signals, placing the stock at a critical inflection point where it could either be pausing before another surge or forming a major top.
The Powerful Backdrop
Since April 2025, Ixigo has been in a powerful bull market, delivering an extraordinary gain of approximately 166% in just a few months. Following this rapid ascent, the s
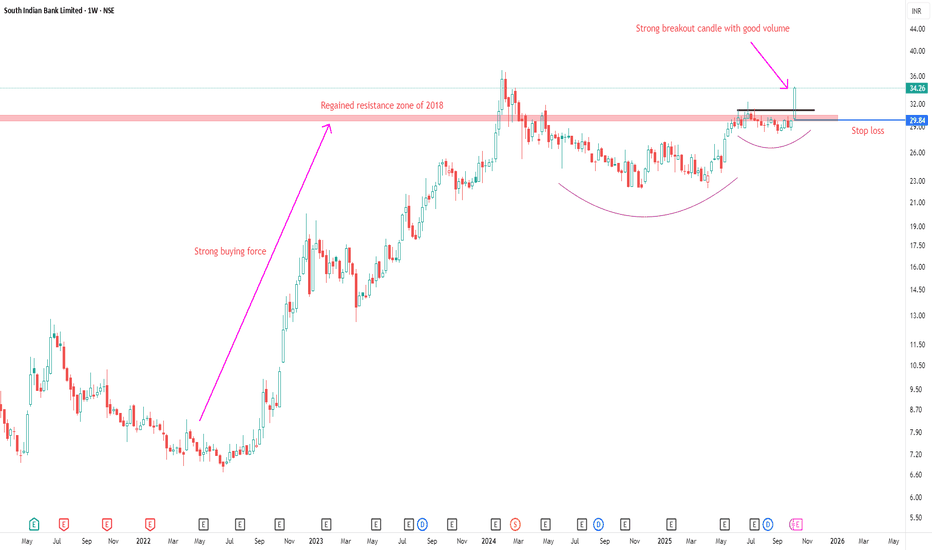
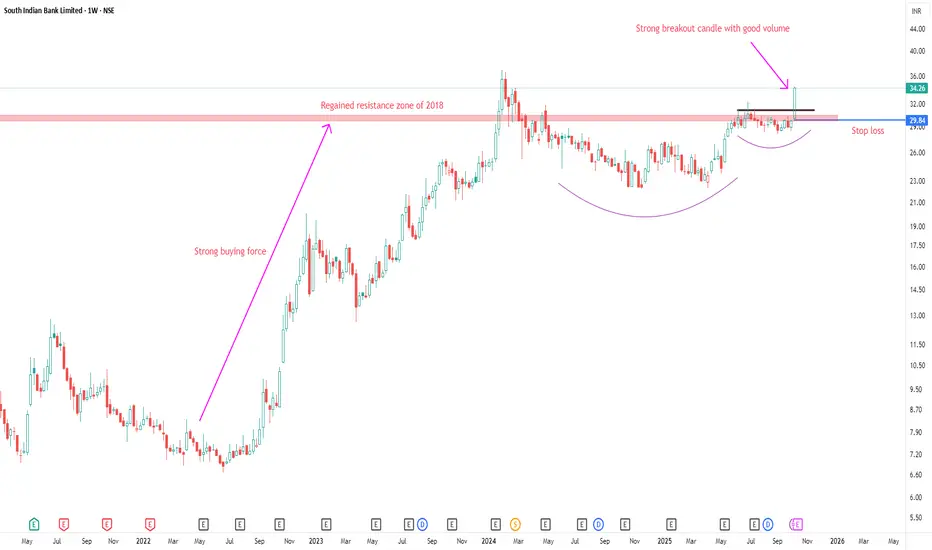
SOUTH INDIAN BANK LTD ANALYSISFOR LEARNING PURPOSE
SOUTH INDIAN BANK LTD- The current price of SOUTH INDIAN BANK is 34.26 rupees
I am going to buy this stock because of the reasons as follows-
1. Its making 52W high with some good volume (sign of strength)
2. It got a great buying force and moved up by 440% in 2022-2023 (which shows smart money)
3. It is showing better relative strength as it stood strong in volatile times including last few weeks.
4. The risk and reward is favourable. The good part- The stock is n
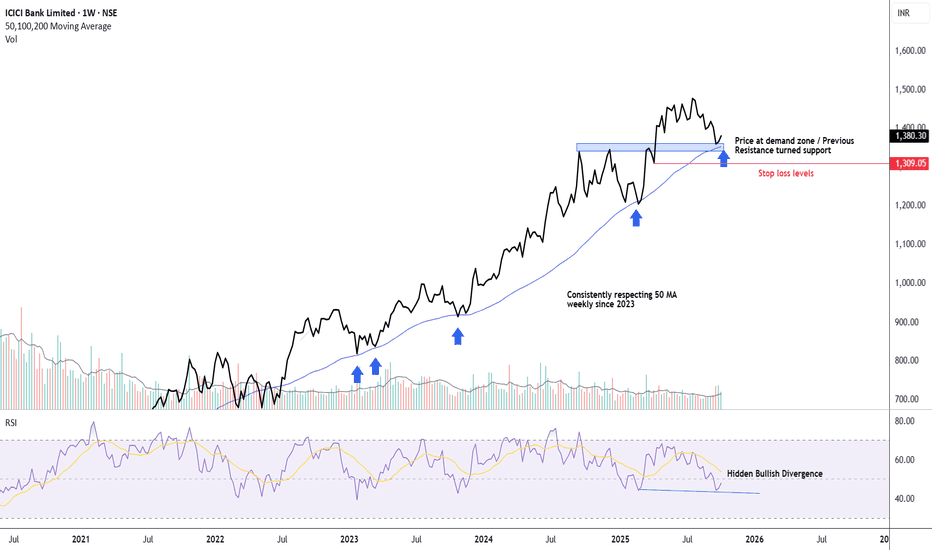
ICICI Bank – Low-Risk Investment OpportunityFor positional investments , I prefer analyzing the weekly chart to filter out short-term noise and whipsaws.
The price has been consistently respecting the 50-week moving average (50 MA) since 2023 - a strong sign of trend stability.
The stock is currently trading near a demand zone, which also aligns with a previous resistance turned support area.
There’s a confluence of bullish factors - 50 MA support, horizontal demand zone, and a hidden bullish RSI divergence - all pointing to a
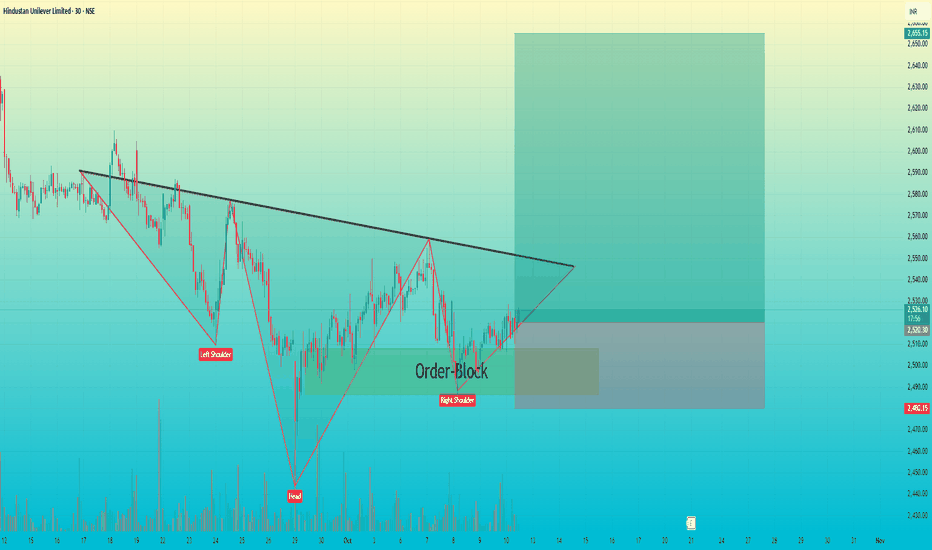
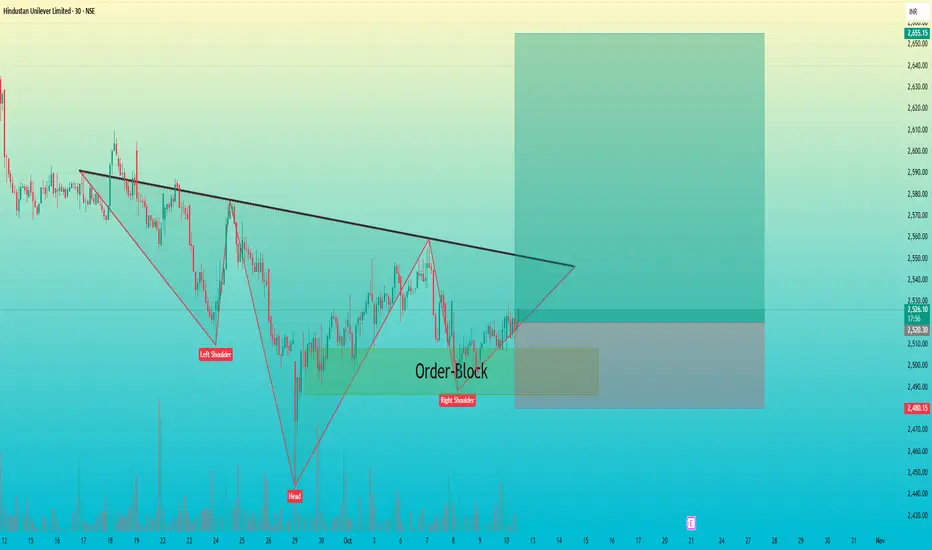
HINDUNILVR : Inverse Head & Shoulders + Order-Block setup Technical Analysis: Hindustan Unilever Ltd
Timeframe: 30-Minute
Pattern: Inverse Head & Shoulders with Order Block Confluence
Pattern Insight
The market has created a clear inverse head and shoulders structure —
showing potential trend reversal from a short-term downtrend to an uptrend.
The neckline is acting as dynamic resistance.
Price is consolidating inside a bullish order block, confirming demand presence.
Order Block Zone
The highlighted green zone around ₹2,485–₹2,505 represen
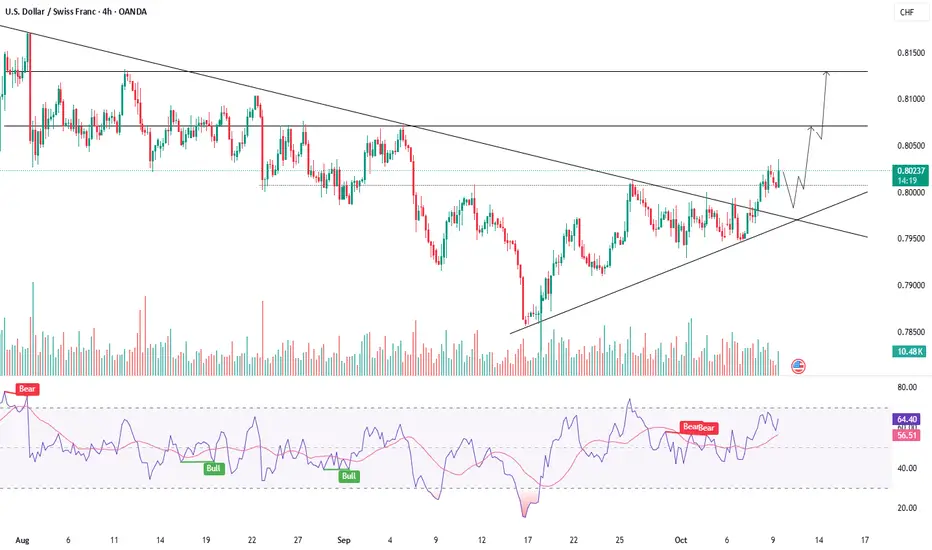
USDCHF - TREND REVERSAL CONFIRMEDSymbol - USDCHF
USDCHF is confirming a reversal of its prior downtrend and appears poised to transition into a distribution phase, supported by strength in the US Dollar Index.
The dollar is currently breaking through resistance and may continue its bullish correction within the broader long-term downtrend. Against this backdrop, the Swiss franc is gradually losing momentum.
The currency pair is exhibiting signs of a local trend breakout, with the breach of the ascending triangle’s resistance