Community ideas
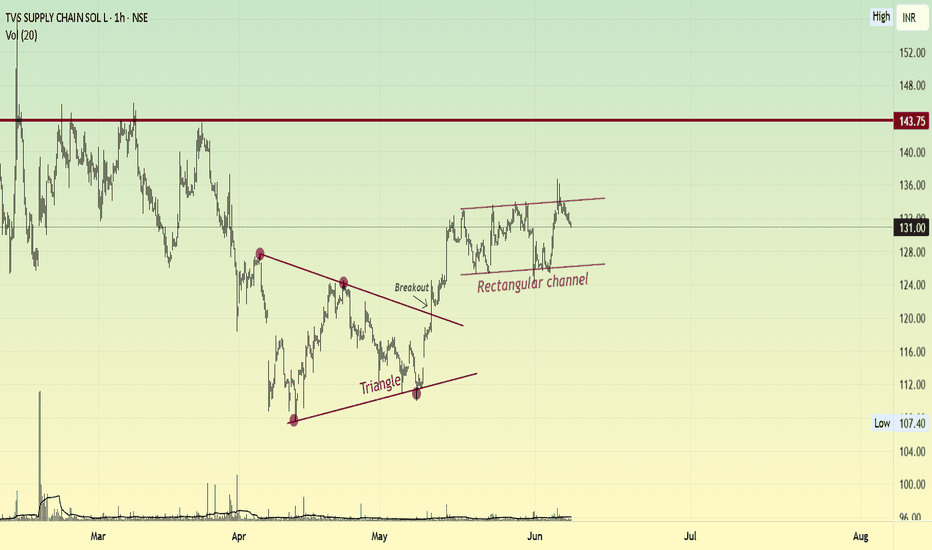
TVSSCS - Triangle into a flag!The following points are of note:
------------------------
1. A symmetrical triangle formed as a near-term bottom for the stock
2. After breaking out of the triangle, price is consolidating in a rectangular range
3. A pole and flag formation, when broken out can give targets of 143, 147, with SL of 123
Disclaimer:
This is NOT a trading recommendation, only my observation. Please do your own analysis before entering any trade.
GODREJIND - Inverse Head and Shoulders Breakout Pattern Overview:
A classic Inverse Head and Shoulders pattern has formed on the Godrej Industries chart. This is a strong bullish reversal pattern, indicating a possible trend change from downtrend to uptrend.
What is an Inverse Head and Shoulders Pattern?
This pattern consists of three troughs:
Left Shoulder: Price declines, then rebounds.
Head: Price declines more deeply, then rebounds.
Right Shoulder: Price again declines but not as much as the head.
A neckline connects the peaks
SHAKTI PUMP : A text book break out• Stock broke a 4 month long short term trendline on 06th Jun25.
• Taken support from long term trendline.
• Big boys took position for the last 2 months without disturbing the price.
• An increase in volume is the testament of the hypothesis.
• Go long on positional/swing basis.
• Target 1: 1029.5
• Target 2: 1192
• Target 3: 1356.5
• SL for Swing traders: 878
• SL for positional trader: 839
• A RR of 1:4.75. A classical textbook breakout.
• Enjoy the show!!!
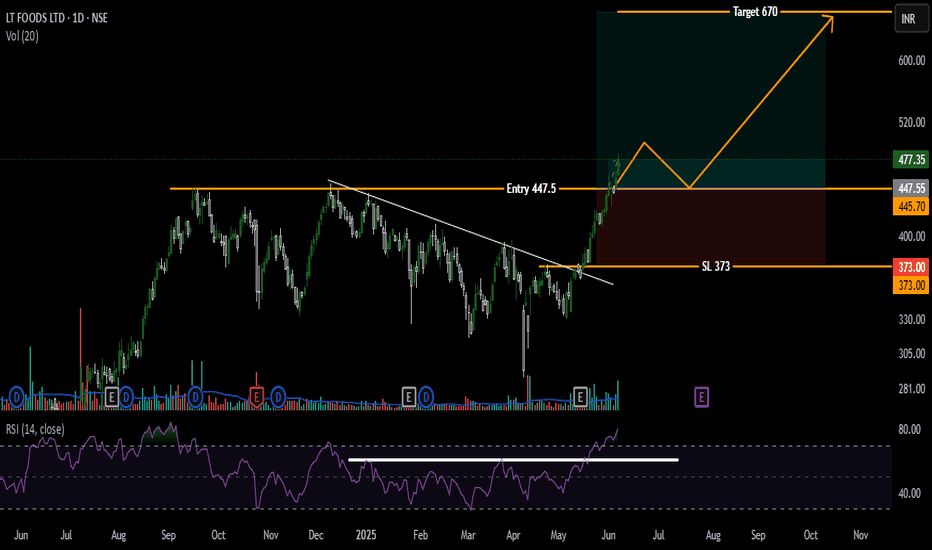
LT Foods | Fresh Breakout Above 52-Week High | Swing Trade SetupLT Foods Ltd (DAAWAT) has given a strong breakout above its multi-month resistance zone around ₹447.5, backed by rising volume and momentum. This marks a fresh 52-week high, supported by bullish RSI strength (above 80).
📈 Trade Setup:
🔹 Entry: ₹447.5 (Breakout Retest Zone)
🔹 Target: ₹670
🔹 Stop Loss: ₹373
🔹 Risk-Reward Ratio: ~3:1
✅ Why I Like This Setup:
Clean breakout from consolidation
Strong volume confirms participation
RSI above 80 indicates trend strength
Bullish price structure acr
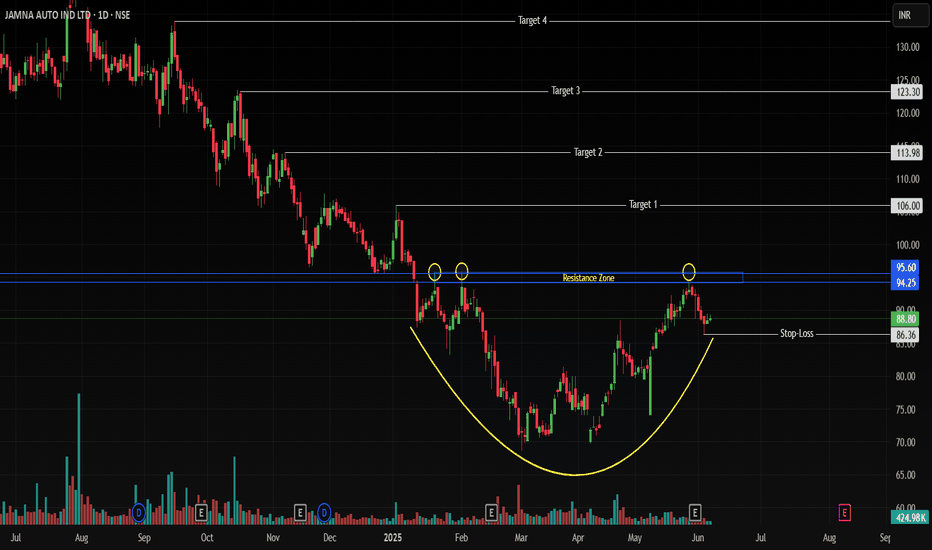
Swing/Positional Trade Idea: Jamna Auto (NSE: JAMNAAUTO)Pattern Alert: Rounding Bottom Nears Breakout!
📈 Technical Setup
Daily Chart Pattern: Price is completing a multi-month rounding bottom (bullish reversal pattern), signaling accumulation.
Current Price: Consolidating near ₹88.80, approaching the crucial breakout zone of ₹94.25–95.60.
Confirmation Trigger: A decisive close above ₹95.60 on rising volume validates the breakout.
🎯 Trade Strategy
Entry: Buy on breakout confirmation above ₹95.60 (close basis).
Stop Loss: ₹86.36 (below the recent
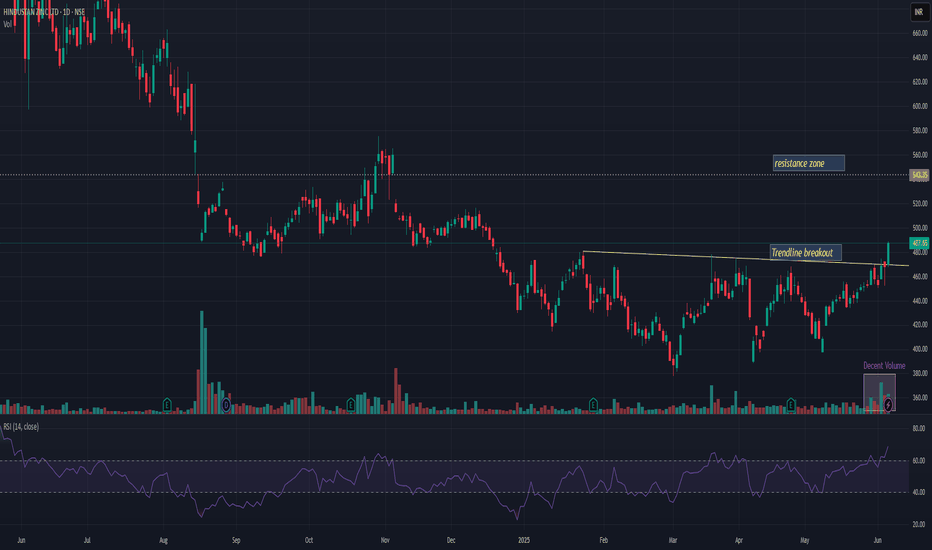
NOCIL LTD
Breakout Confirmation:
Strong bullish breakout above the ₹195–₹198 resistance zone.
Volume & Strength:
A breakout after a multi-week sideways range indicates potential trend reversal from the previous downtrend.
Resistance Ahead:
Immediate resistance near ₹208–₹212, which coincides with March swing highs.
Major resistance at ₹225, then ₹240.
Support Levels: New support at breakout zone: ₹195–₹198.
Stronger base at ₹185-170.
Trend Shift: The chart shows a base formation between ₹170–₹19
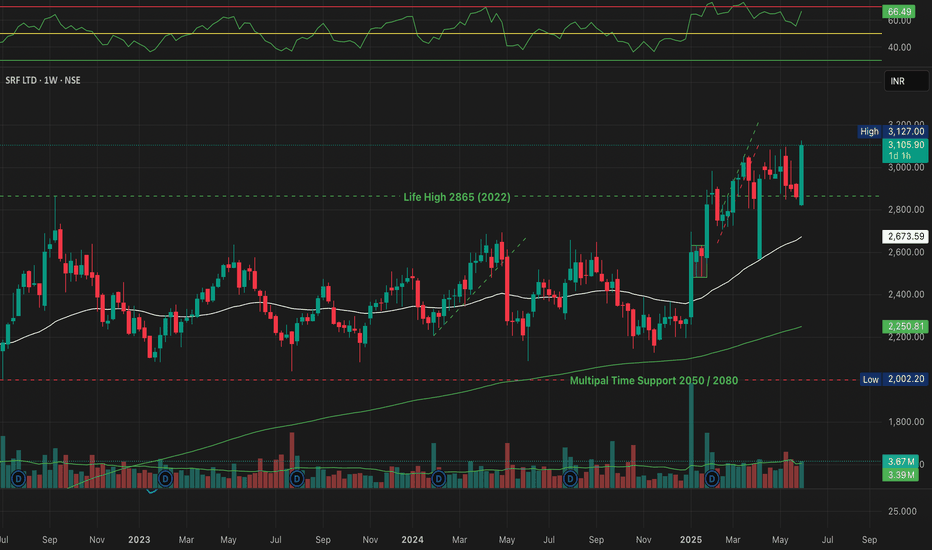
SRF Ltd Breaks Out Above 2022 High — Is ₹3,300 the Next DestinatSRF Ltd has officially broken above its previous all-time high of ₹2,865 (from 2022), closing strong at ₹3,112, with an impressive weekly gain of +8.78%. Backed by increasing volume and a strong RSI of 66.70, the breakout looks technically significant.
• ✅ Breakout above life high of ₹2,865 (2022)
• 📈 Weekly High: ₹3,127
• 💰 Closing Price: ₹3,112
• 📉 50 EMA Support: ₹2,673
• 🔰 Major Support Zone: ₹2,050–₹2,080
• 📊 RSI (Weekly): 66.70 — bullish momentum building
• 🔄 Volume: 3.66M — above
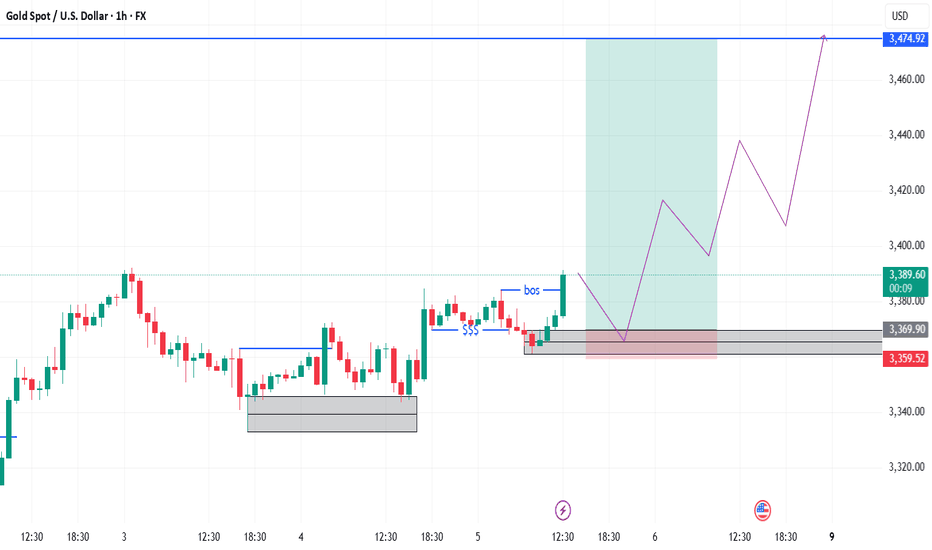
FXHUNTER / XAUUSDHello, I am FXHUNTER. In this post, we will analyze the XAUUSD symbol. As you can see, the structure of the gold symbol is bullish. In this situation, the block order candle that I have identified as the last block order is bearish before a strong upward move. You can wait and enter the trade when the price reaches it with confirmations such as choch, pin bar candle or trend line breakout on the 1-minute timeframe. The target is set on the higher timeframe.
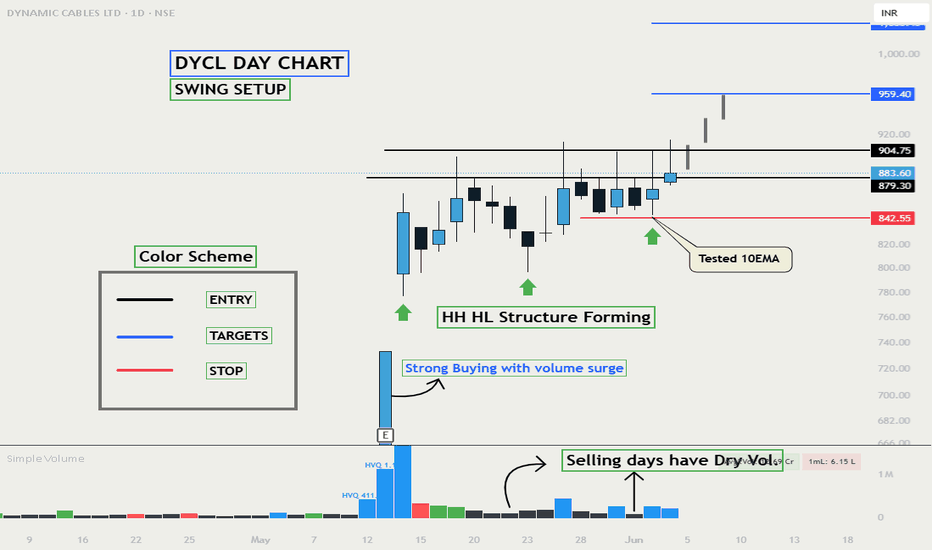
DYCL STRONG BREAKOUT CANDIDATENSE:DYCL
Cable and WIre Industry Stock Good for Swing
#DYCL Strong Conviction - Increasing day by day.
Study the Price and Volume action closely.
Spikes are grabbing supplies from top and low volatility closing showing - accumulation.
Today price respected the previous day close and formed a higher high higher low structure.
All Major Levels are marked on chart.
Keep Learning,
Happy Trading.
Nifty June Iron Condor Strategy–Range is Back Premiums are JuicyHello Traders!
Here’s a plan for calm minds who want to generate passive monthly income by leveraging the power of non-directional option selling. Based on the current Nifty structure and OI data, I’ve spotted a new range-bound opportunity — perfect for executing a safe, hedged Iron Condor setup.
Why This Strategy Now? (Based on Chart Analysis)
Resistance Zone: 25400-25500 (Heavy supply, multiple rejection visible)
Support Zone: 23400-23500 (Major bounce levels, strong OI support)
Ni
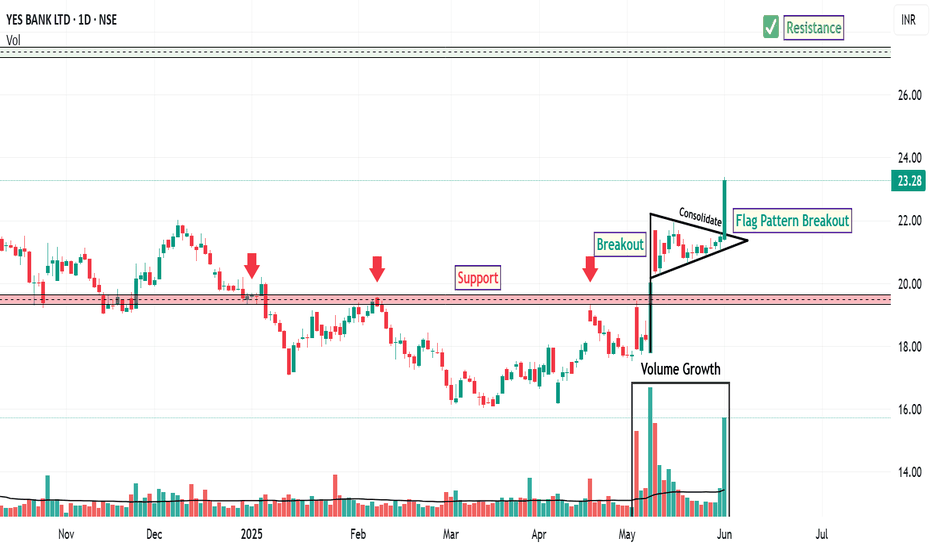
YESBANK: Riding the Bullish WaveYes Bank has exhibited a notable breakout above the resistance level established in December 2024. This breakout is accompanied by a classic flag pattern formation, which has resolved to the upside—typically interpreted by technical analysts as a continuation signal within an existing trend.
A significant increase in trading volume during the breakout phase adds weight to the move, suggesting heightened market participation. Furthermore, the 20-day EMA has crossed above the 200-day EMA, a cr
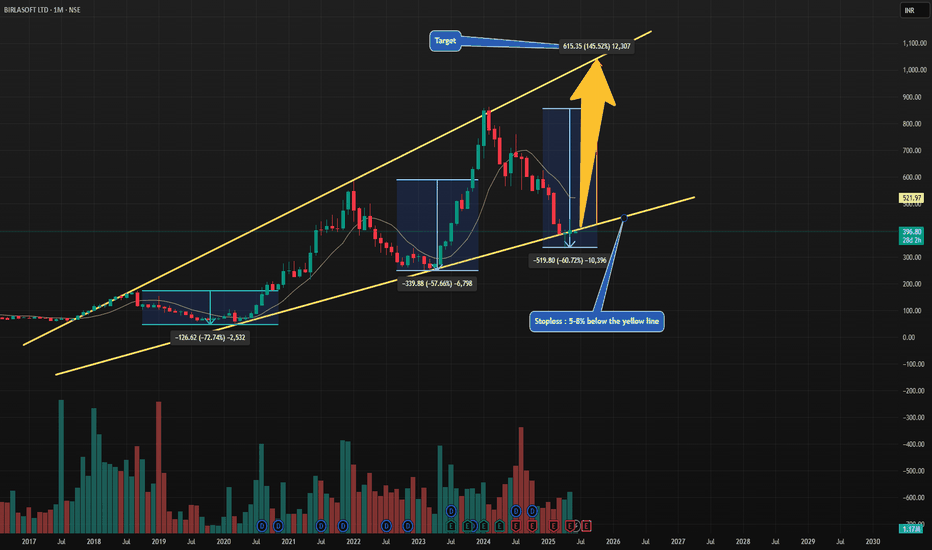
BirlaSoft : Giving another Multibagger Opportunity of ~145% ?Hi Friends,
BirlaSoft a looking very good in terms of chart formation at this junture. Though The fundamentals are yet to reflect.
It usually corrects by 55-75% from the top. This time it has corrected by 60% almost .
Now the Target comes out to be around ~600 level (~145%) from the current levels .
How Target was calculated :
----------------------------------
yellow parallel lines are for channel which is respected by the stock . The same lower yellow channel line should be treated a
LIC of India cmp 954.45 by Weekly Chart view since listedLIC of India cmp 954.45 by Weekly Chart view since listed
- Support Zone 865 to 900 Price Band
- Resistance Zone 1010 to 1055 Price Band
- Bullish Rounding Bottom under Resistance Zone
- Heavy Volume surge by demand based buying last week
- Rising Support Trendline respected and Falling Resistance Trendline Breakout, both seem well sustained