Momentum in Amber Enterprises LtdFuture Segment Stock
Consumer Durables Sector Stock
Amber Enterprises India Ltd is showing a clear setup—an earlier uptrend, followed by a wide sideways range forming a head-and-shoulders pattern, and now a breakout with a textbook retest.
More importantly, the weekly RSI breakout suggests strong momentum can continue in the near term.
Caution: This is an F&O stock with relatively low liquidity and can be highly volatile, especially around results.
Note: This analysis is for educational purposes only and is not intended as a recommendation or trading advice.
Community ideas
# NLCINDIA NLC INDIA LIMITED
Multi-month consolidation breakout with strong volume expansion on weekly timeframe. Stock has given a clean breakout above major resistance zone after long accumulation.
Entry: Above ₹330 weekly closing basis
Stop Loss: ₹311
Targets:
🎯 Target: ₹419
Why this setup looks strong?
✅ Strong weekly candle breakout
✅ Volume expansion confirming buying interest
✅ Price trading above 21EMA & 50EMA
✅ Higher high – higher low structure intact
✅ Long consolidation breakout generally leads to strong trending move
Risk Reward:
Approx 1:3+ setup from breakout zone.
Trading Plan:
Wait for sustained move above breakout area and manage position with trailing upto 419.
⚠️ Disclaimer:
This post is shared only for educational and learning purposes. Charts, levels, and analysis are personal views and not investment advice or a recommendation to buy/sell any stock. Please do your own research and consult your financial advisor before taking any trade. Trading and investing in the stock market involve financial risk.
BHEL - Long Setup ONBHEL , after reaching to Resistance 3, stock may face some supply zone near to level 358 .
Technical indicators, RSI, MACD and ADX suggest lone bullish trend which may allow stock to reach next resistance which place at 450 level. While previous resistance will be primary support for this move.
Disclaimer : This analysis is intended solely for educational and informational purposes. It does not constitute financial advice or a recommendation to buy, sell, or hold any security. Market participants should evaluate risks independently and consult a licensed financial professional before making investment decisions.
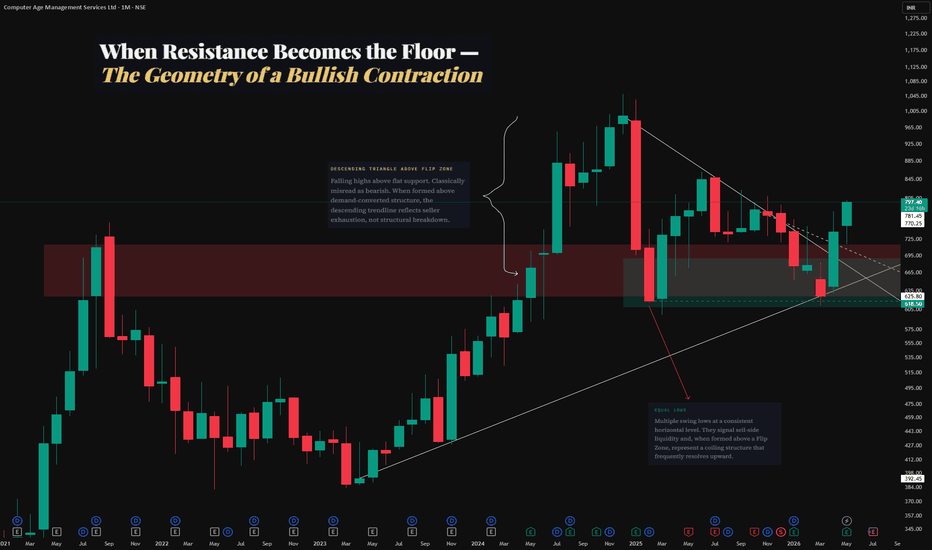
The Geometry of a Contraction Pattern01 The Anatomy of a Flip Zone
A Flip Zone is one of the most structurally significant phenomena in technical price action analysis. It describes a price zone,most meaningful when observed on the monthly time frame, that first acted as a formidable resistance ceiling over multiple touches, and subsequently, following a decisive Breakout Candle, requalified itself as a demand zone beneath price.
The mechanism is grounded in market memory. Institutional participants who previously defended that resistance level now shift their posture: the same supply that capped price on the way up becomes the structural support that cushions any retest on the way down. This conversion is not instantaneous - it is confirmed by how price behaves on its return visit to the zone.
Core Principle
A Flip Zone is not a line. It is a contextual reclassification of a prior supply cluster — validated only when price revisits the zone and structure holds.
02 The Breakout Candle — Structural Reclassification
The catalyst for the flip is the Breakout Candle: a high-momentum close that absorbs the overhead supply and clears the prior resistance zone with authority. This candle represents a decisive shift in the demand-supply equilibrium, What makes this candle consequential on the monthly time frame is the weight of the timeframe itself.
Structural Note
The quality of the flip is directly proportional to the quality of the breakout. A convincing, high-volume breakout candle creates a more structurally robust demand zone upon retest.
03 The Descending Triangle
Classical technical analysis characterizes the Descending Triangle as a bearish continuation pattern — a series of lower highs pressing against a horizontal support floor, with the implication of a downside breakdown. This characterization is correct in isolation.
The critical word is isolation.
When a descending triangle forms above a validated monthly Flip Zone, following a one-sided bullish rally, the structural context inverts the conventional expectation. What appears as distribution or topping is, in fact, a contraction pattern — price digesting its own momentum, compressing within a range where demand is structurally anchored beneath it.
Published for educational purposes only.
All concepts — Flip Zone, Equal Highs, Equal Lows, Descending Triangle, Breakout Candle — are referenced in the context of historical price structure analysis.
This is not financial advice. Past price behavior does not determine future outcomes.
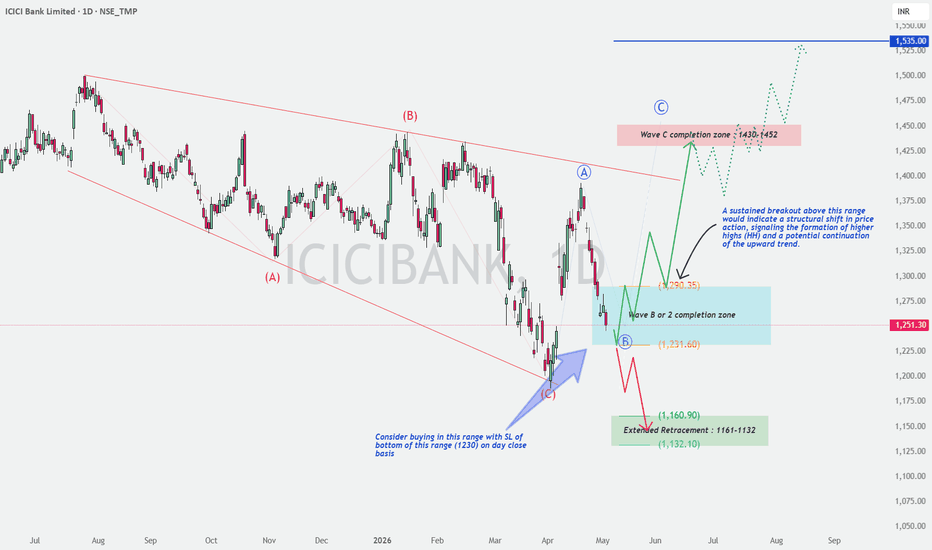
ICICIBANK : Time to buy? Outlook and Wave analysisThis analysis explores the current price action of ICICI Bank on the daily timeframe, focusing on structural transitions and potential wave completions. 📈
🔍 Technical Observation: The Corrective Phase
ICICI Bank has been operating within a large Descending Broadening Wedge pattern since late 2025. This structure typically represents a period of high volatility and corrective price action. Based on the chart, we have observed a completed ABC corrective cycle:
Wave (A): The initial downward impulse.
Wave (B): A corrective rally toward the upper trendline.
Wave (C): A final flush that bottomed out near the 1200 level in early April.
🏗️ Current Structure: The "Wave B or 2" Zone
Following the bounce from the Wave (C) lows, the price is currently navigating a critical decision zone. We are identifying the range between 1231.60 and 1290.35 as the "Wave B or 2 Completion Zone."
Educational Insight: 📘
If the price sustains above this zone, we transition into a bullish Wave 3 or Wave C impulse.
A failure to hold the lower boundary of this range suggests an Extended Retracement toward the 1132–1161 support cluster.
🎯 Key Levels & Trading Logic
Accumulation Zone: Consider entries within the current blue shaded box (approx. 1230–1250).
Risk Management: A strict stop-loss (SL) is recommended below the bottom of this range (1230) on a daily closing basis.
Bullish Confirmation: A sustained breakout above 1290.35 would indicate a structural shift, signaling the formation of Higher Highs (HH) and a potential rally toward the primary target zone.
Target Zone: 1430 – 1452 (Wave C completion zone), with an ultimate structural target of 1535.
🛡️ Risk Management Note
Trading corrective structures requires patience. Always wait for the price to react at defined zones rather than anticipating the move. Volume expansion on a breakout above 1290 will be the primary confirmation of bullish intent.
Disclaimer: I am not a SEBI-registered analyst. This analysis is for educational purposes only and does not constitute financial advice. Please conduct your own research or consult a certified professional before trading.
Disclaimer: Educational purposes only. Not SEBI registered.
NAM INDIA – Breakout Setup in ActionStock has been respecting a horizontal channel for a long time, with clear:
✔ Support zone near 780–800
✔ Resistance zone around 990–1000
After multiple rejections from the resistance (lower highs visible), price finally gave a strong breakout above 995 with momentum 🔥
What stands out:
✔ Multiple touches confirm strong base formation
✔ Sharp pullback followed by higher low near support
✔ Strong bullish candles leading into breakout
✔ Retest + hold near breakout zone (healthy sign)
Current View:
Price sustaining above 1000 zone = strength continues
This is a classic range breakout → trend continuation setup
Possible Scenario:
➡ Above 1000–1020: Momentum can push towards 1150–1200 zone
➡ Breakdown below 990: Weakness, possible retest of range
Trading Insight:
This is how strong moves begin —
👉 Long consolidation
👉 Clean breakout
👉 Retest
👉 Expansion p
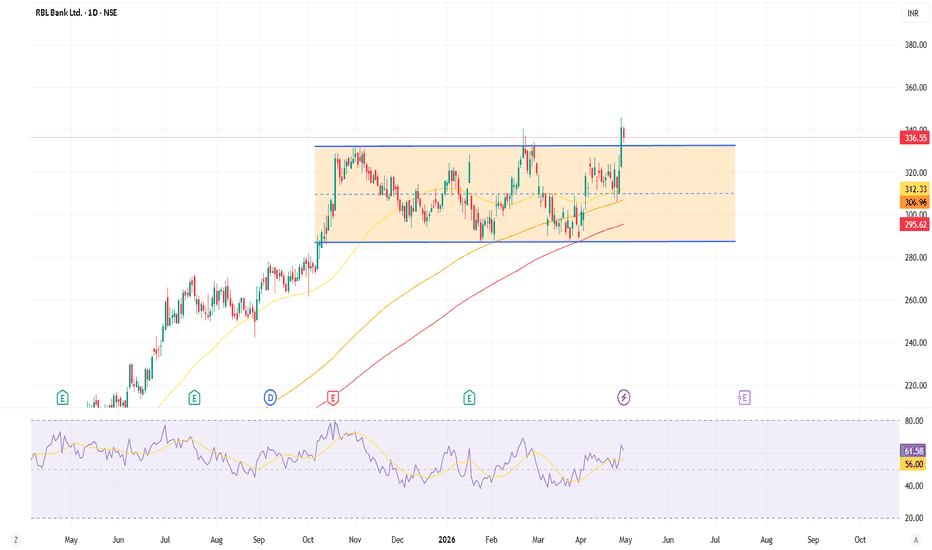
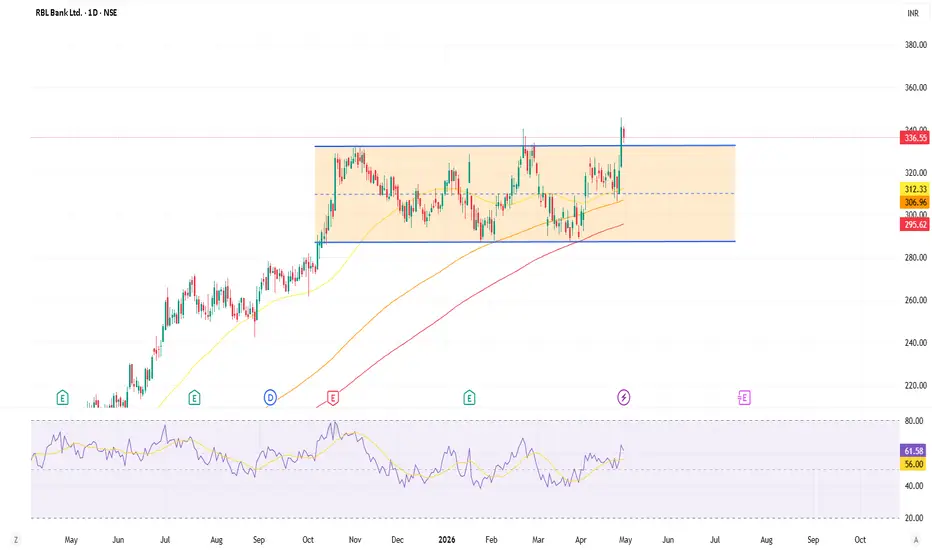
RBLBANKThe chart is self-explanatory and is shared for educational purposes.
RBLBANK has recently delivered a strong breakout from a long-term consolidation range (rectangle pattern). The stock is consistently trading above its key moving averages, with the 50, 150, and 200-period lines showing a positive slope.
Following the breakout above the resistance zone, the price action suggests that previous resistance is now acting as a floor. With the RSI maintaining positive momentum, the upward trend appears likely to continue as long as it holds above the breakout level.
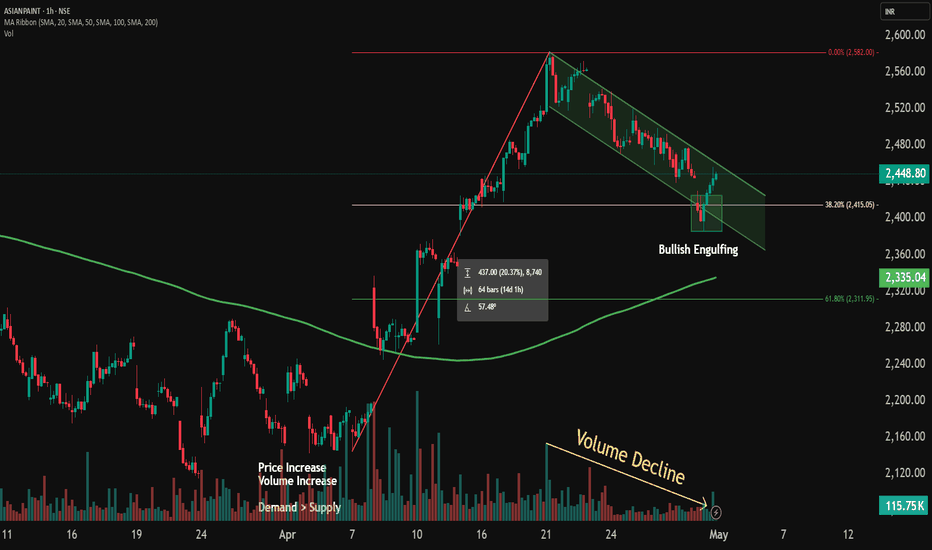
Asian Paints Ltd – Bullish Flag Setup (Hourly Timeframe)Stock: Asian Paints Ltd
Timeframe: 1 Hour
Setup Type: Bullish Flag with Pole
Technical Observation
Asian Paints is currently forming a Bullish Flag pattern on the hourly chart.
A strong bullish pole was created with large green candles supported by rising volume, indicating strong demand.
After the impulsive move, price entered a flag consolidation phase starting from 21st April.
The correction retraced approximately 38.2% Fibonacci level, which is a healthy pullback in an uptrend.
At this key level, a bullish engulfing candle appeared, suggesting buyers are stepping back into the market.
During the flag formation, volume declined gradually, indicating that the move is likely profit booking rather than trend reversal.
📈 Trend Confirmation
Price is trading above the 200 Moving Average, confirming the overall trend remains bullish.
Market structure supports continuation after consolidation.
🎯 Trade Plan
Entry: On breakout of the Bullish Flag (confirmation candle close)
Stop Loss: Below the flag low
Target: Measured move based on pole length projected from breakout point
⚠️ Expectation
If price sustains momentum and breaks above the flag resistance, we can expect a continuation of the uptrend with strong upside potential.
🧠 Conclusion
This setup reflects a classic institutional accumulation and continuation pattern.
Patience is key — wait for a confirmed breakout before initiating the trade.
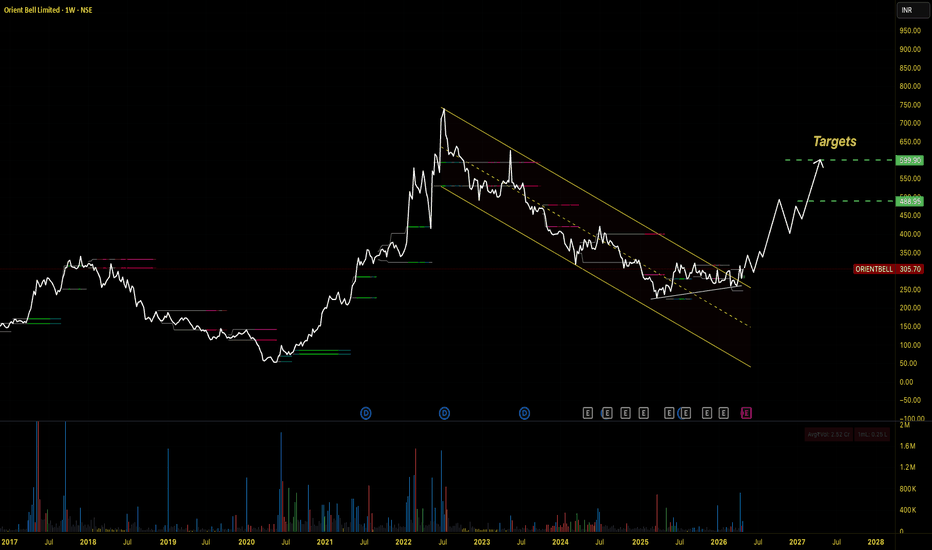
Orient Bell — Descending Wedge Breakout After 3-Year Downtrend Orient Bell has spent roughly 3 years (mid-2022 to early 2025) inside a well-defined descending wedge — a classically bullish compression pattern after a steep corrective decline from ~750 highs.
What's changed: Price is now breaking above the upper trendline of the wedge with expanding volume and weekly momentum turning. This week's +9% candle is the clearest structural confirmation since the downtrend began.
Targets:
T1: ₹488.95 (prior consolidation zone + wedge measured move)
T2: ₹599.90 (pre-breakdown supply zone)
T3: ₹700 (prior cycle highs)
Invalidation: Weekly close back below ₹250–240 (back inside the wedge) negates the breakout thesis.
Fundamental context: Orient Bell operates in the tiles segment, a cyclical play on real estate and housing demand. Kajaria Ceramics posted a good set of Q4FY26 results breaking a 4-quarter streak of volume stagnation, Mr. Ashok Kajaria mentioned that they saw recovery in demand and expect it to continue this financial year. Many players in Morbi have shut down operations due to high gas prices, labor issues and poor cash flows. He mentioned this would be beneficial for branded tile companies with multiple plant location. Orient Bell should also benefit from this tailwind, valuation is also dirt cheap as it's trading at 0.6x Mcap to Sales.
This is a technical setup note. Not investment advice. Do your own due diligence.
Reliance Date 01.05.2026
Reliance
Timeframe : Weekly
Cmp 1430
Target :- Looks like 20% upside from here
(Technical + Fundamental)
(1) Free Cash Flow (FCF) Positive: For the first time in decades, all major verticals—Energy, Retail, and Telecom—are projected to turn FCF positive simultaneously in 2026
(2) Reliance's Jamnagar refinery is one of the few in the world with a high enough Nelson Complexity Index (21.1) to process "hard sour" (heavy, high-sulfur, and acidic) crude like Venezuela's Merey grade.
(3) Because this oil is difficult to refine, it typically trades at a $6.50 – $8.00 discount per barrel compared to Brent crude. Therefore, this could add $3–$4 per barrel to RIL's Gross Refining Margins (GRMs).
(4) India's Venezuelan oil imports reached a six-year high. India received between 10 million and 12.5 million barrels of Venezuelan crude in April 2026. This is the highest monthly volume since February 2020
(5) Expected tariff hikes (approx. 15%) and the migration of users to higher ARPU (Average Revenue Per User) plans are set to drive 18%+ EBITDA growth in Jio.
(6) The retail arm is currently being optimized through store consolidations and a push into high-margin FMCG and Quick Commerce (JioMart), followed by IPO soon.
(7) India's retail market is set to cross $1.4 trillion by 2027. RIL is the primary proxy for this growth, with its retail EBITDA projected to nearly double.
Regards,
Ankur Singh
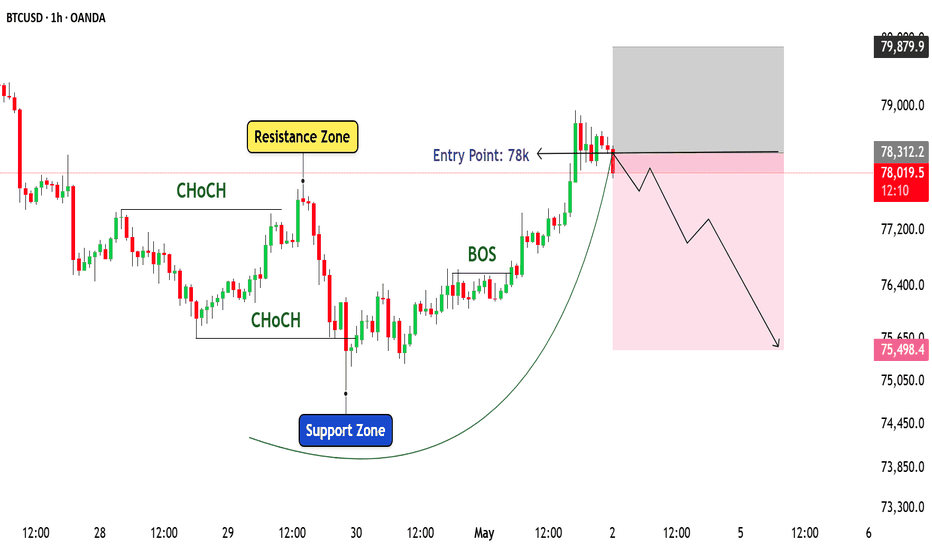
Bitcoin Range View: 78K to 75K Move ExpectedHi Traders, I hope you are doing well.
As today is Saturday, Bitcoin usually moves in a small range because market activity is low. Right now, price is near a strong resistance around 78K after a good upward move.
At this level, price is slowing down, which means sellers can enter here. If Bitcoin is not able to stay above 78K, then we may see a downward move.
As per simple view, price can fall towards the 75K area, which is a previous support zone. So, 78K is acting like a selling area, and 75K is a buying area.
If price stays above 78K and moves sideways, then the range can continue instead of falling. So, it is better to wait for clear confirmation before taking any trade.
This is only for learning purpose. Always manage your risk and avoid trading without proper plan.
Trendline Breakout After Healthy Correction | MCXStrong bullish trend followed by a healthy correction and consolidation phase.
After the pullback, price gave:
* Trendline breakout
* Resistance breakout near 2893
* Bullish higher timeframe candle close
Entry was considered only after confirmation candle close instead of anticipating the breakout early.
SL was planned below the breakout candle/structure to avoid reacting to intraday noise and targets were projected using trend momentum and risk-reward continuation setup.
The idea was based on:
- strong trend continuation,
- breakout confirmation,
- and structured risk management with fixed capital risk per trade.
Sharing this as a chart-study and learning perspective.
#PriceAction #Breakout #SwingTrading #TrendFollowing #TradingView
Bandhan Bank Analysis📊 *Bandhan Bank Analysis*
🔥 *The Setup:*
Bandhan Bank is showing a *Breakout with high volumes* , signaling potential Institutional Participation.
*Remember* : Breakouts + Volume = A much higher probability move! 📈💹
🎯 Key Levels to Watch:
🚀 *Bullish Zone* : If it sustains above 200, we could see targets of 220 / 260+ levels! 🚀💰
🛡️ *Support/Retest* : Keep an eye on the 170 levels—this is a possible retest zone. 📉🔄
⚠️ *Caution* : The structure turns weak if it slips below 140. 🚩🛑
💎 _*High conviction comes when price action meets volume!*_ 💎
NIFTY : Market Outlook & Trading Plan for 01-May-2026
Date: 01-May-2026 | Focus: Technical Levels & Price Action
⏮️ Previous Day Recap (30-Apr-2026)
The market on April 30th was a classic example of "Volatility at Support." As planned, Nifty opened with a significant gap down, breaking the immediate support levels. However, it found aggressive buying interest at the lower structural base (Buyer's Support). The index staged a sharp recovery of over 200 points from the lows, ending the day at 24,043.70. This recovery has placed the index right back into a crucial decision-making zone.
🚀 Scenario 1: Gap Up Opening (Above 24,150)
🟢 The Setup: A gap up of 100+ points would place Nifty above the current "No Trade Zone" and near the 24,219 (Last Intraday Resistance) level.
🟢 Plan of Action:
🔸 Wait for Validation: If the price sustains above 24,219 for the first 15-30 minutes, it confirms that the previous day's recovery has shifted the momentum to the bulls.
🔸 Target Levels: Look for a move toward the major red resistance line at 24,434.
🔸 Rejection Play: If the price hits 24,219 but fails to cross it (forming a bearish candle), expect a retest of the 24,065 level to fill the morning gap.
🟢 Educational Logic: In a gap-up scenario after a strong recovery, the "trapped bears" from the previous day will scramble to cover their positions, which can lead to a fast "short-covering" rally toward 24,434.
⚖️ Scenario 2: Flat Opening (Range 24,000 – 24,080)
🟡 The Setup: A flat opening keeps the index inside the orange "NO TRADE ZONE" highlighted in image_e5aff4.png (between 24,065 and 23,942).
🟡 Plan of Action:
🔸 Patience is Key: Do not initiate trades while the price is oscillating between 24,065 and 23,942. This is a zone of consolidation where decay is high.
🔸 Upside Break: Buy only if a 15-minute candle closes strongly above 24,065. Target: 24,219.
🔸 Downside Break: Sell if the price breaks and sustains below 23,942. Target: 23,858.
🟡 Educational Logic: Market participants often lose capital in "sideways" zones by over-trading. We wait for the "range breakout" to ensure we are riding the momentum rather than getting caught in a whip-saw.
🔴 Scenario 3: Gap Down Opening (Below 23,940)
🔥 The Setup: A gap down of 100+ points would mean an opening near or below the 23,942 support.
🔥 Plan of Action:
🔸 Initial Support: Monitor the 23,858 level (Opening Support for Gap Down Case). If the market holds this, we might see another recovery attempt.
🔸 Bearish Confirmation: If 23,858 fails to hold, the next major stop is the "Last Intraday Support" zone between 23,690 – 23,736.
🔸 Extreme Target: In a heavy sell-off, keep an eye on the final support line at 23,554.
🔥 Educational Logic: A gap down indicates that the previous day's recovery was just a "dead cat bounce." Breaking below 23,858 confirms bearish dominance, making the 23,700 area the next logical target for profit-taking by shorts.
🛡️ Risk Management Tips for Options Trading
🔸 Capital Protection: Never allocate more than 10-15% of your total trading capital to a single options trade.
🔸 Avoid "Hope" Trading: If a level is breached and your SL (Stop Loss) is hit, exit immediately. The market doesn't care about your "feeling" that it will bounce back.
🔸 Time Decay (Theta): Be mindful that on Fridays, premiums can be expensive. If the market stays flat (Scenario 2), avoid buying OTM (Out of the Money) options as they lose value quickly.
🔸 Volume Check: Ensure that the breakout from the levels (like 24,065 or 23,942) is supported by a spike in volume to avoid "fakeouts."
📝 Summary & Conclusion
The Nifty is currently balanced between the recovery bulls and the structural bears. The levels 24,219 (Resistance) and 23,858 (Support) are the two most critical points for May 1st. Use the "NO TRADE ZONE" to stay disciplined and only enter when the price action provides a clear directional signal.
⚠️ Disclaimer: I am not a SEBI registered analyst. This trading plan is shared strictly for educational purposes based on the technical analysis of the provided charts. Trading in the stock market involves significant risk. Please consult your certified financial advisor before taking any positions.
Gold Sees Moderate RecoveryGold (XAU/USD) prices showed a moderate recovery to around $4,615 (+0.50%) in today's session, attempting to break a three-day downtrend.
Despite rebounding from a monthly low, the precious metal still faces a major storm from the strengthening US dollar, driven by the Fed's hawkish shift and the complete diplomatic deadlock in the Middle East.
------------------------------------------------------------------------------------------------
✅ FOMC: Largest Split Since 1992
The Fed's decision last night left a scar on expectations of monetary easing:
- ⚡Surprising Dissent: Although interest rates remained at 3.50%-3.75%, three Fed officials dissented from the accommodative tone in the policy statement. This is the largest internal split in 34 years.
- ⚡Interest Hike Hints: Markets responded sharply by reducing bets on a rate cut. Conversely, the probability of a rate hike by the end of 2026 has now crept above 10% due to stubborn energy inflation.
- ⚡Powell's Farewell: Jerome Powell attempted to balance the tone of the debate by stating that his focus was on "neutrality," but the market preferred to focus on the hawkish faction that was beginning to dominate ahead of Kevin Warsh's arrival.
✅ Geopolitics: Trump Closes the Door Unconditionally on Nuclear
Hopes for peace in Islamabad were officially dashed after the latest statement from the White House:
- ⚡Proposal Rejection: President Donald Trump officially rejected Iran's proposal. He asserted that there would be no peace deal or lifting of the naval blockade until Iran completely halted its nuclear program.
- ⚡Hormuz Crisis: Trump confirmed that the maritime blockade would continue, guaranteeing continued energy supply disruptions. This strengthened the greenback as a primary safe haven amid the risk of global energy inflation.
-----------------------------------------------------------------------------------------------
✅ XAU/USD Technical Analysis (Intraday)
Technically, gold is making a healthy correction amidst a still-strong downtrend:
- ⚡Critical Support ($4,520 - $4,535): The recently tested monthly low. As long as the price remains above this level, the opportunity for a short-term technical rebound remains.
- ⚡Immediate Resistance ($4,650): A psychological level that is now a major barrier. Gold needs to break through this level to convince the market that today's recovery is not just a dead cat bounce.
- ⚡PCE & GDP Pivot: The next major move will be triggered by the release of Q1 GDP and the PCE Price Index data tonight. A hotter-than-expected PCE inflation figure could quickly end today's gold recovery.
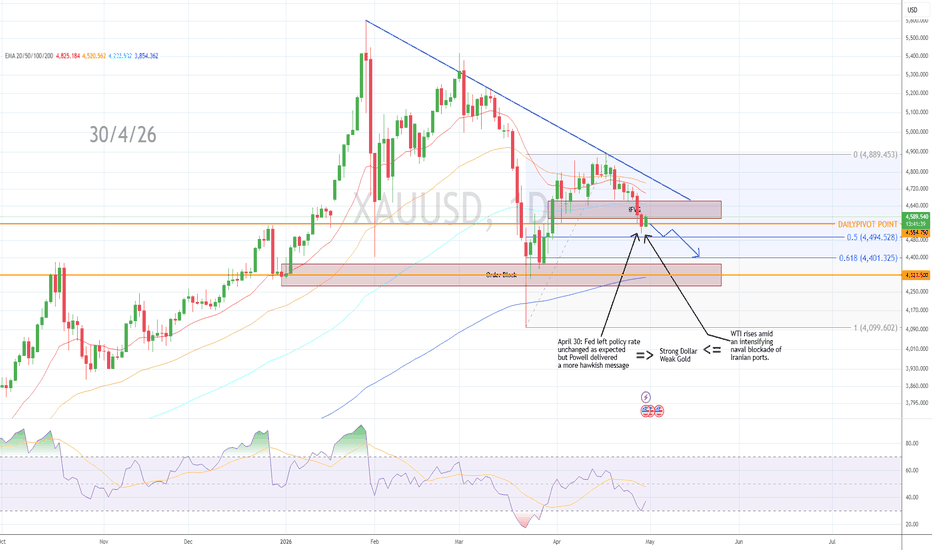
GOLD ANALYSIS (DAILY CHART)Multiple factors signaling further BEARISHNESS:
A. Technical Factors
1. Yesterday, the prices closed below the daily pivot and marked iFVG and are still trending lower
2. Prices are trending below 20/50 & 100 EMA & might fall to test 200 EMA (3854)
3. The prices might fall lower to test the golden fib zone between 4500 & 4400, or lower towards the 4325 level (demand order block)
4. Minor pullbacks (till 4600-4640 zone) cannot be rejected as RSI is testing the oversold zone
-----------------------------------------------------------------
B. Fundamental/ Geopolitical Factors
1. The US Fed left its policy rate unchanged as expected - NO CUTS
2. The bank (POWELL) in fact delivered a more hawkish message amid rising inflation concerns.
3. Four policymakers argued that the Fed should no longer signal any bias toward easing rates
A strong hawkish stance
4. On the other hand, the oil prices tested record highs
5. WTI advances above $105.50 as Iranian ports' blockade deepens
6. President Trump said Wednesday that the naval blockade on Iran will continue until Tehran agrees to a nuclear deal.
Overall:
1. Hawkish Fed = Strong Dollar = Weak Gold
2. High Oil prices = High inflation = Rise in Interest Rates = Strong Dollar = Weak Gold
3. Oil is traded in petro-dollars. Significant increases in oil prices create demand for the US dollar, making Gold weaker
Gold (2H) Bears Flex Muscle With Kijun Reclaim FailureGold continues to show clear bearish intent on the 2H timeframe, with price failing to reclaim the Kijun Sen, reinforcing downside pressure.
Key Observations:
• Price already trading below the cloud indicating bearishness
• Kijun Reclaim Failure → Strong sign of bearish trend continuation
• Bearish Future Kumo → Confirms forward weakness
• Free Chikou Span → No immediate support, allowing downside expansion
As long as price action stays below the 150923 invalidation level on 2H closing basis,
it can continue to interact with the lower reference levels at 148,350 -> 147,550 -> 146,750
RBL Bank: Strong Breakout from Multi-Month ConsolidationRBL Bank (RBLBANK) has just delivered a high-conviction breakout on the daily timeframe, clearing a significant resistance zone that has capped gains since late 2025. With price action supported by volume and rising relative strength, the stock looks poised for a new leg higher.
Technical Observations
The Breakout: After a prolonged period of consolidation (forming what looks like a broad flat base/cup-with-handle / Mark Minervini Cheat breakout), the price has surged past the critical 335 "BUY Point."
Volume Confirmation: The breakout is backed by a noticeable spike in volume, suggesting strong institutional participation and interest at these levels.
Moving Averages: The stock is trading well above its key moving averages. The alignment of the short-term averages above the long-term 200-EMA (black line) confirms a healthy uptrend.
Relative Strength (RS): The green RS line at the bottom of the chart is trending upward, indicating that RBL Bank is currently outperforming the broader market index.
Conclusion
The combination of a price breakout, volume surge, and strong RS makes this a high-probability setup. As long as the price sustains above the 335 level on a closing basis, the bias remains strongly bullish.
Disclaimer: This is for educational purposes only and not financial advice. Please do your own due diligence before entering any trade.
crude rally lifts OIL: will 501 ceiling finally shatter?The chart shows a decisive recovery from the April lows, with the stock now hovering near the 501.2 resistance level. This level has historically acted as a "supply ceiling," and a clean breach here would signal a shift in market structure.
Scenario A: Bullish Breakout (Buy Above 501)
If the price sustains above 501, it confirms a breakout from the recent consolidation phase.
Trigger: 501.20
Target: 522.00 (Previous 52-week swing high area)
Scenario B: Bearish Rejection (Sell Below 492.50)
Failure to hold the current momentum could see the stock retreat into the previous value area. A breach of the support line at 492.50 would invalidate the recent rally.
Trigger: 492.50
Target: 478.50 (Structural support/EMA zone)
NIFTY 50 Price Structure Analysis [29/04/2026: Wednesday]Probable Scenario Analysis:
(1) BULLISH SCENARIO:
There is no observable bullish set-up. The first criterion of bullish sentiment to activate is when the price forms a higher highs and lower lows structure above the level 24125. After that, the price must offer a sustainable breakout above the level 24250. If the price sustains above the level 24250, then the probable bullish targets would be 24375 and 24500.
(2) BEARISH SCENARIO:
There is a higher probability for the price to sustain in the bearish phase. Price must form a lower lows and lower highs structure below the level 24000. Then the price must break down below the level 23875. If the price sustains below the level 23875, then the probable bearish targets would be - 23750, 23625, and 23500.
(3) No Trading Zone (NTZ): (24250 - 23875).
(4) Range of Consolidation (ROC): (24250 - 23875).
Strong resistance zone is (24250 - 24125). Strong support zone is (24000 - 23875).
(5) Establish intraday bias with respect to the opening price.
(6) Event: No high-impact event.
(7) All the analyses would fail in the case of a major gap up, gap down, or price structure anomaly. Therefore, practice PRAGMATISM during the live session.
NOTE:
(i) Trade only if there is a set-up. Remember, not trading is an extension of the trading activity. Always PRACTICE RISK MANAGEMENT . Always PROTECT your CAPITAL . Be RESPONSIBLE.
(ii) Mark your points. Trade your points. Price is GOD . Plan your trade. Trade your plan. Anything can happen in the markets. Therefore, trade what you see, not what you believe.
(iii) Be Strategic. Be Courageous. Be Patient. Be Wise.
(iv) Every day is a new day. Therefore, do not carry the baggage of past successes or failures. Always trade from a new perspective. Believe in Possibilities.
Happy Trading!
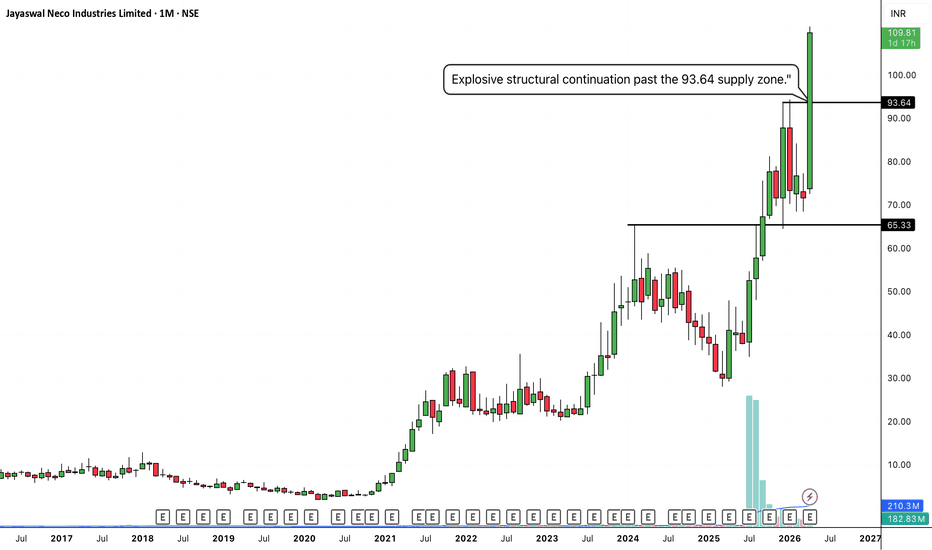
JAYNECOIND: Explosive Monthly Breakout and Macro ContinuationThe Setup (Bias): I am taking a LONG bias on Jayaswal Neco Industries Limited (JAYNECOIND) on the macro monthly (1M) timeframe.
The "Why" (Technical Reasons): 1. Historic Structural Breakout: Zooming out to the monthly timeframe reveals the true magnitude of this move. The price has forcefully broken out of a multi-month consolidation base, cleanly slicing through the heavy macro resistance ceiling at 93.64.
2. Macro Stair-Step Confirmation: This confirms a beautifully structured long-term uptrend. We can clearly see the historic 65.33 resistance level acting as a perfect launchpad floor, proving that institutional buyers are aggressively accumulating and controlling the macro trend. The current monthly candle is massive and full-bodied, showing zero seller pushback.
Trade Plan (Entry & Exits): * Entry: Momentum and position traders can look for entries near the current extended market price of 109.81 to capture the aggressive phase transition. A safer, lower-risk approach would be waiting for the momentum to cool and placing limit orders to catch a potential monthly pullback to retest the 93.64 to 95.00 breakout zone, letting that old macro ceiling prove itself as a new floor.
Take Profit (Target): With the stock breaking out into fresh territory with this much monthly momentum, the momentum can carry it significantly higher. The next major psychological targets are the 130.00 milestone, followed by 150.00.
Stop Loss: Placed safely below the recent monthly consolidation block, around the 80.00 level. A monthly close back below the 93.64 structural level would be an early warning sign of a failed macro breakout.
Duration: Because this analysis is built on a massive 1-Month chart capturing a macro trend continuation, this is a long-term position trade designed to play out over the coming months to years.
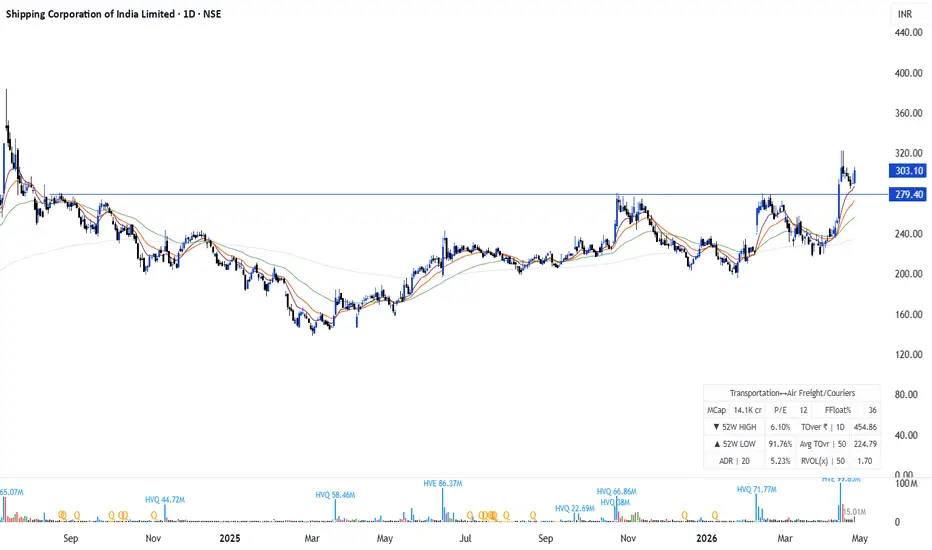
Shipping Corporation of india: Massive multi month breakoutShipping Corporation of India Limited (SCI) has just delivered a powerful structural breakout on the daily timeframe. After trading in a wide consolidation range for nearly a year, the stock has decisively surged past a major resistance level, signaling the start of a potential multi-month uptrend.
Key Technical Observations:
Major Horizontal Breakout: The stock has cleared the critical ₹279.40 resistance zone. This level had acted as a ceiling during multiple attempts since late 2025; flipping this into support is a highly bullish structural shift.
52-Week High Momentum: By trading at ₹303.10, the stock is at new 52-week highs, indicating a lack of immediate overhead supply and strong institutional interest.
Volume Confirmation: The breakout is supported by a massive volume spike of 15.01M, which is significantly higher than the average daily volume. This confirms that the move is backed by strong accumulation.
Moving Average Power Trend: The price is trending well above its 20, 50, and 100-day EMAs. The shorter-term averages are angling upward sharply, providing a dynamic "wind at the back" for this momentum move.
Trade Setup:
Entry: Current Market Price (₹303.10) or on a minor "throwback" toward the breakout level of ₹285 - ₹290.
Stop Loss (SL): ₹265 (Placed below the breakout candle low and the immediate horizontal support).
Targets:
Target 1: ₹340 (Immediate psychological resistance)
Target 2: ₹385+ (Based on the measured move from the 1-year consolidation base)
Disclaimer:
This analysis is for educational and informational purposes only. Trading in the stock market involves significant risk. Please perform your own research or consult with a SEBI-registered financial advisor before making any investment decisions. I am not a SEBI-registered advisor.