Solar Industries Exit
Solar Industries completed cycle degree Wave (III) on 1 july 2025.
Stock has formed a corrective structure similar to a flat as follows :-
Flat is a 3-3-5 structure in the form of ABC of primary degree (i.e. Wave A being 3-sub waves, Wave B being 3 sub waves and Wave C being 5-sub waves). Wave A is a corrective Wave, Wave B is a counter wave and Wave C is again corrective wave with C/A ratio being >= 1.
Wave A (primary degree) consisting of two corrective impulses in the form sub-wave A, su
Elliott Wave
Nifty Ready for another fall before Bumper riseNifty appears to be trading inside a larger corrective structure after completing a sharp decline from the recent highs. The current price action suggests that the market may be forming a contracting triangle / complex corrective wave before the next impulsive move.
The chart indicates that the index is respecting the descending blue trendline resistance while repeatedly reacting around important Fibonacci retracement levels.
Current Structure:
Larger degree correction appears to be unfolding
Nifty 18-05-2026 & 19-05-2026 scenarioCurrent fall is internal wave 3 fall, which is usual in gaps. Now wave 4 will correct (will do timepass) probably till this afternoon. Then internal wave 5 selling can possibly happen in the range of 23430-23501.
Target possibly as per count, in blue box zone. There is gap also at 23150. So everything will be fulfill at once.
Stop loss is above 23501 for 15-30 mins sustain then chances of upmove again till 23834 minimum.
Also remember, if 22980 crossed below much higher and bigger target is d
Apollo Hospitals - Exit / Sell Wave C of flat formation
Apollo Hospitals has completed Wave 3 / Wave (III) of primary degree on 23 Oct 2025 and ever since has been forming Wave 4 as a flat structure which is a 3-3-5 structure.
Wave A of Flat got completed on 23 Jan 2026, Wave B of Flat got completed on 14 May 2026 (or will complete shortly).
Wave C will take the stock lower than Wave A (23 Jan 2026 lows).
Exit / Sell stock with a target of 6696 (minimum).
The view will be negated if the stock moves above 1.414 x of Wave A length.
Sell / Exit Amber Wave C of Flat formation
Amber - Weekly Chart
The stock completed Wave 5 of primary degree on 29 Oct 2025 as a W5 extension @ 2X of primary wave length 1-3. This completes one impulse wave of Cycle degree.
The subsequent correction has taken the form of a Flat which is a 3-3-5 structure. Wave A of the Flat got completed on 27 Jan 2026. Wave B of the Flat most likely got completed on 7 May 2026 or will get completed shortly.
Exit / Sell the stock as Wave C will make a lower low than Wave A, i.e. 27 Jan 26 lows which
KNR Construction ready for double ??Disclaimer : This view is only for educational purpose and it's not buying or selling recommendation. Consult your financial advisor for stock market related investment. Stock market gains are subject to market risk's, hence invest with accepting stock market risk's.
I am not responsible for your profits and losses.
1] KNR construction has completed one major Elliot Wave Cycle :
a] Impulse Wave took time of 8 years (1-2-3-4-5) and 5th wave extended.
b] Corrective wave has taken time of 54-55
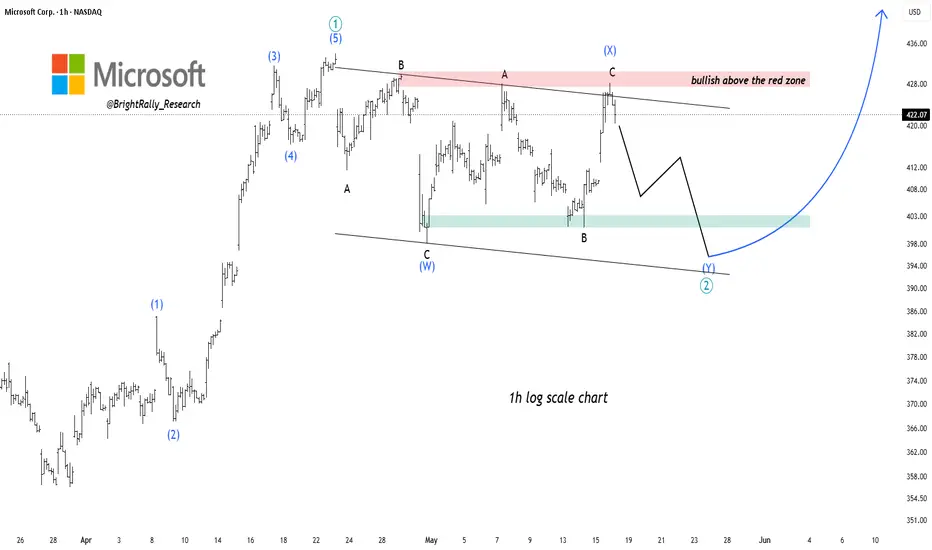
Microsoft Testing a Critical Zone Before Next Major MoveMicrosoft continues to trade within a broader corrective structure after failing to sustain momentum above the recent highs. Price action remains capped below the descending resistance trendline, indicating that the current recovery phase still lacks confirmation of a larger bullish continuation.
The recent rejection from the upper resistance zone near 430 suggests that sellers remain active at higher levels. At the same time, the structure appears to be developing as a complex corrective wav
Netweb technoloiges - Exit - Wave C of flat formation / W4
Net web technologies has completed W3 of intermediary degree and is forming Wave 4 of intermediary degree as a flat formation.
Flat formation is a 3-3-5 structure. Wave A and Wave B of Flat is complete as given in the charts.
Wave C in formation. Stock likely to fall about 25-35% to complete Wave C.
Exit on W2 formation of Wave C and re-enter after Wave C completion expected to be around 2822 levels.
Gold Approaches Key Support Within Corrective StructureGold continues to trade within a broader corrective structure following the rejection from the recent swing high near 4,890 . Price action remains confined below the descending resistance trendline, indicating that the market is still undergoing a short-term consolidation phase rather than immediately resuming the primary uptrend.
The current decline appears to be developing as the final leg of a corrective wave sequence, with price now approaching the lower boundary of the channel near the 4,
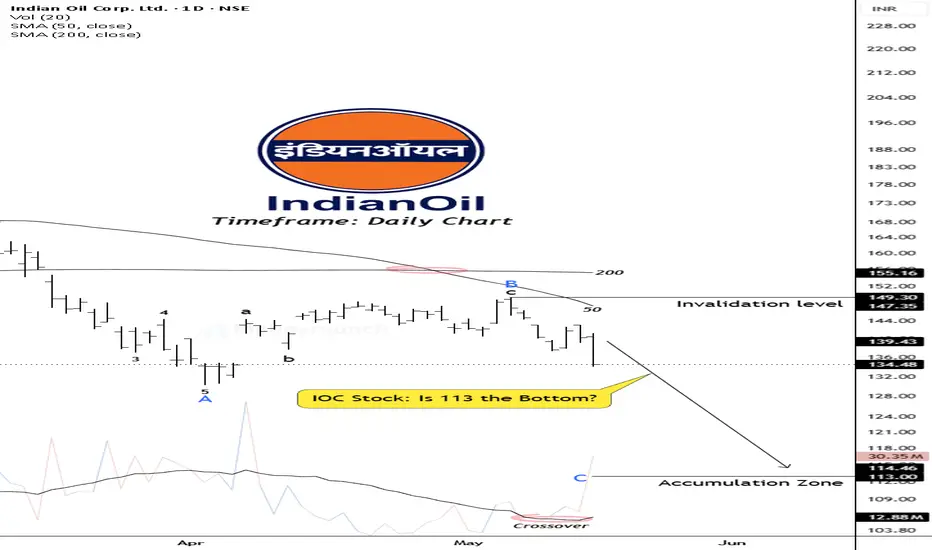
Indian Oil Corporation (IOC) — Elliott Wave Research PerspectiveIndian Oil Corporation appears to be trading within a broader bearish structure on the daily timeframe, with price action continuing below both the 50-day and 200-day moving averages — indicating sustained medium-term weakness.
Wave C appears to have resumed downward momentum after rejection from the resistance band.
From an Elliott Wave perspective, IOC currently lacks bullish impulsive confirmation. Unless price reclaims and sustains above the invalidation level, rallies may continue t
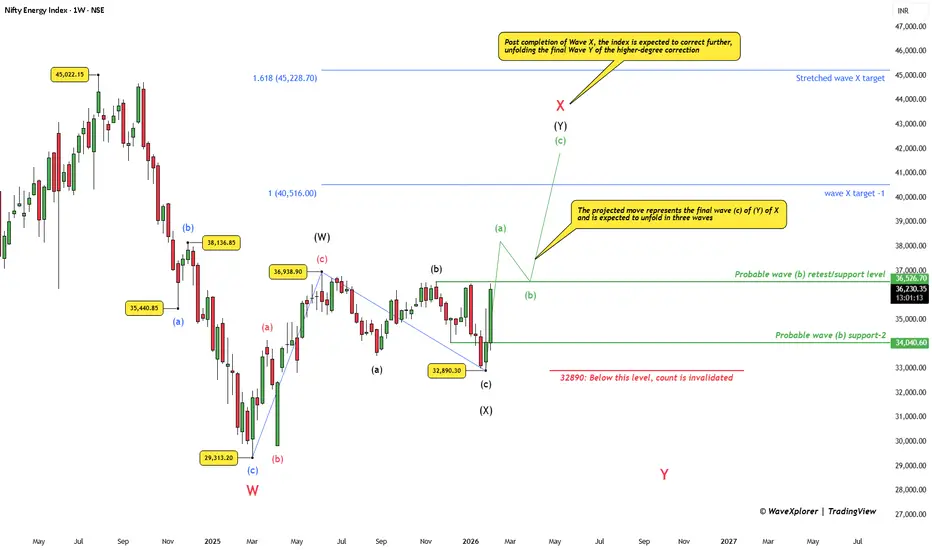
Nifty Energy: Final Bounce Before the Deeper CorrectionThe Nifty Energy Index continues to trade within a higher-degree corrective structure rather than a fresh impulsive uptrend.
The decline from the highs appears to have completed Wave W, followed by an ongoing recovery in Wave X.
In the near term, the structure allows for one more upside phase . After a probable dip in wave (b), the index may attempt a final advance via wave (c) of (Y) of X, which is expected to unfold in three waves.
This move is likely to be selective and constituent-drive
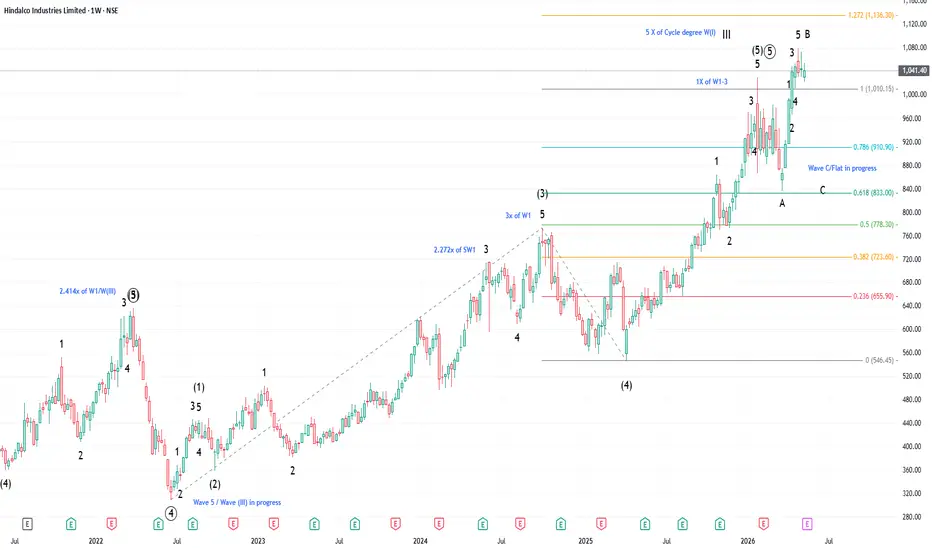
Hindalco Exit / Potential Wave 5 of primary degree completion
Weekly chart
Wave (III) of cycle degree has been in progress since Feb 2016.
Wave 1 (primary degree)/Wave (III) was completed in Jan 2018
Wave 2 (primary degree)/Wave (III) was completed in Mar 2020 (Zigzag)
Wave 3 (primary degree)/Wave (III) was completed in Mar 2022
Wave 3 formed at 2.414 X of Wave 1 (extended wave)
Wave 4 (primary degree)/Wave (III) was completed on 20 Jun 2022 (Zigzag)
Wave 5 (primary degree)/Wave (III) has been in progress since. The chart shows Wave 5 formation.
Detai
NIFTY 50 : 24400 level again ??1] If tomorrow (i.e 14th May 2026) nifty open flat to positive, we can see nifty starting upside journey till 24400 levels again.
2] If Nifty opens gap-down, kindly ignore this view.
3] Follow Stop-loss very strictly. This view is only for equity segment and not for option buying or option selling.
4] This is high risky view as currently global economic conditions are not in favor of bullish market. Crude oil price are surging and rupee getting depreciated, hence this is view is highly risky.
nifty ( alternate )The weekly chart suggests that each decline is unfolding in a complex three-wave corrective structure, forming a W-X-Y-X-Z pattern. Based on this alternate Elliott Wave count, the market currently appears to be in Wave C of the final Wave Z. If this interpretation is correct, Wave Z could produce the strongest phase of fear and capitulation, leading to maximum panic before the larger correction is fully completed.
niftyThe reason I continue to push this idea is because market breadth remains extremely weak and overall sentiment is deeply negative — conditions that are typically observed during a Wave 2 correction in Elliott Wave structure. Breadth indicators and sentiment analysis help reveal the underlying mood of the market, and historically, they have proven to be reliable tools in identifying these corrective phases
Nifty - where is it heading - Most probable view / EWPRefer to my earlier post on Nifty dated 23 March 2015 titled “Nifty – Where is it heading”.
As conveyed in the said note, Nifty completed :-
- Wave 1 (Primary degree)/Wave (III) during Oct 2021 and Wave 2 (primary degree)/Wave III during June 2022.
- Wave 3 (Primary degree)/Wave (III) during Sep 24 at equality to Wave 1. Then came the correction from Sep 24 to Apr 25.
What was the earlier view?
The correction during the period Sep 24 – Apr 25 was considered as a Zigzag and hence the complet
NIFTY 50 : Final fall before next bull runNifty 50 is consolidating in last 18 months in the form of Flat Pattern.
Flat Pattern Wave-A and Wave-B completed and final Leg C (wave-C) is in progress.
In Wave-C, last wave 5 is pending which should be the final fall for Nifty 50
Note : This view is only for Learning and Education purpose.
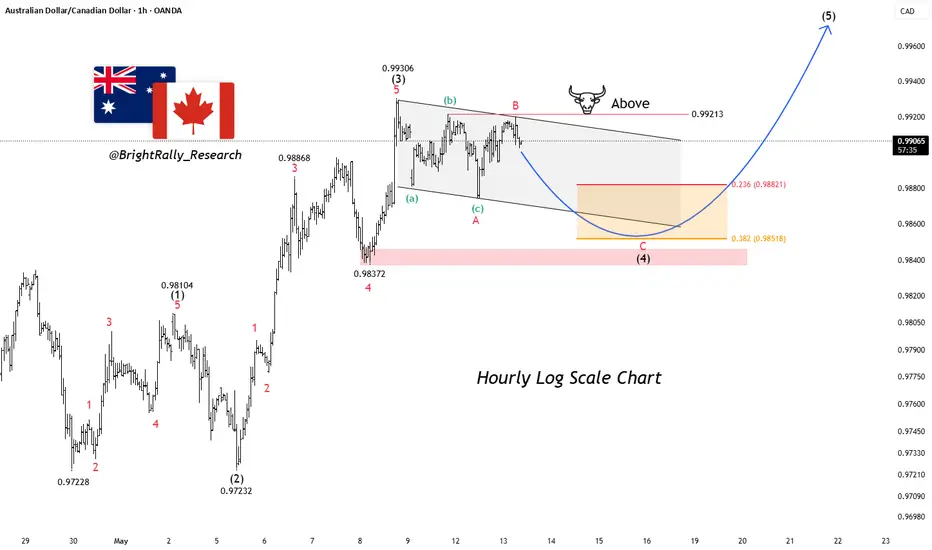
AUDCAD: Corrective Dip May Fuel Next Rally
AUDCAD on the 1H chart is still trading within a corrective structure after the strong rally to the 0.9930 high. Instead of continuing higher immediately, the price began moving within a falling channel, indicating that momentum has slowed in the short term. The current structure looks more like a controlled pullback rather than aggressive selling.
At the moment, price is struggling to reclaim the upper boundary of the channel, while sellers continue defending the resistance zone near 0.992
NZDJPY - Consolidation May Be Fueling the Next RallyNZDJPY on the daily chart still looks structurally bullish despite the recent consolidation near the highs. After the strong rally from the 85.35 low, the price pushed into the resistance area and has since been moving sideways inside a tightening structure. Instead of seeing a sharp rejection, the pair continues to hold higher lows, which usually signals that buyers are still active in the bigger trend.
The current consolidation also looks like a potential contracting pattern before continua
XAUUSD - CPI Surge & Ascending Channel SupportXAUUSD - CPI Storm & Ascending Channel Support – Buying the FVG Dip
Today promises to be an explosive trading session for Gold as the market holds its breath for the most crucial inflation data of the month. Below is the trading plan breaking down the intersection of the macro backdrop and technical price action.
Macro Context: The CPI Storm
Today's focal point is undoubtedly the U.S. Consumer Price Index report. With y/y CPI forecast to jump to 3.7 percent and Core CPI m/m expected at 0.3 p
NIFTY-Seems Correction Wave C initiated-More fall in cards?NIFTY:Trading below all its critical moving averages viz 10/20/50/100 even in weekly charts,indicates correction wave C has been initiated and shall witness ell on rise till it reclaims 240000+ Critical Wave C and its sub waves i,ii,iii,iv,v are projected below:
WAVE A-B-C Levels
Wave A: ~26,200 → ~22,800
Wave B: ~24,500–24,600
Wave C now starting from ~24,500 likely traget 21300
Sub-Waves of Wave C -i/ii/iii/iv/v Levels
Sub-Wave i:23,200 – 22,800
Sub-Wave ii-Bounce back :From 23000 to 23,700 –
Updated Nifty Analysis for the week 11 May to 15 May, 2026Wrap up:-
As mentioned earlier, we are in wave y of x of 4 of major wave 3.
In wave y, a lower degree impulse (i.e. wave a) is forming in which wave 1 was completed at 22782, wave 2 at 22719, wave 3 is completed at 24400, wave 4 is completed at 23796. Now, wave 5 is treated as completed at 24601 as Nifty breaks 38.2% level i.e. 23677. Therefore, wave a of y is now completed with a impulse and wave b is in progress which will now makes complex structure.
In wave b, it is forming a 3-3-5 irreg
BNBUSD Could Be Setting Up for Another Heavy FlushBNB is still trading inside a broad range on the daily chart, but the overall structure continues to look weak. Price has been struggling to break above the 100 EMA, and every recovery attempt is getting sold into before a real breakout can happen. The recent bounce from the $570 area was decent, but buyers still failed to build strong momentum above resistance.
Right now, BNB is sitting near the top of the local range, which makes this area important. If the price gets rejected here again an
XAUUSD H1 Technical AnalysisHead and Shoulders & Elliott Wave Convergence
Gold is currently exhibiting a definitive trend reversal signal following a sustained bullish run. This analysis combines classical chart patterns with Elliott Wave theory to outline the high-probability path forward.
Head and Shoulders Pattern (H&S)
The H&S structure is clearly visible on the current timeframe, signaling buyer exhaustion:
Left Shoulder: Formed around the 4,730 level.
Head: Peaked at 4,760, where significant selling pressure was en