Elliott Wave
XAUUSD (H4) – Liam PlanMacro tailwinds remain, but price is extended | Trade reactions, not emotions
Quick summary
Gold remains supported by a strong macro backdrop:
📌 Fed hold probability in January: 95% → USD/yields capped.
📌 Geopolitical tension (Kremlin praising Trump over Greenland, NATO cracks) adds safe-haven demand.
Technically, price has pushed aggressively into upper expansion territory. At this stage, the edge is reaction trading at key levels, not chasing strength.
Macro context (why volatility stays e
Buy Dixon, W4 of Primary degree completionDixon completed W3 of Primary degree on 17 Dec 24 and ever since has been undergoing correction / forming W4 of Primary degree. The original thought was it was forming zigzag.
It completed Wave A on 7 Apr 25 and had a very good retracement of over 90% for Wave B (hence a flat) and completed same on 25 Sep 25 and started forming Wave C.
As per wave markings given in the chart, it is likely that stock has completed W5/Wave C at 50% of the overall length of W1-3 and took support at subwave iv of
Kalyan Jewellers: Wave Y Still at Play?Disclaimer: This analysis is for educational purposes only and does not constitute investment advice. Please do your own research (DYOR) before making any trading decisions.
Bigger Picture
Kalyan Jewellers topped near 795.40 and has been in a prolonged corrective phase. The structure since then is not impulsive but rather corrective — pointing toward a Double Combo (W–X–Y) correction.
Wave Structure Breakdown
Wave W: A clean zigzag down into 399.40 , completing the first corrective
Tata Consumer Products Ltd – Rising Wedge: Trap or Topping?Price is grinding higher inside a rising wedge , marked by converging trendlines and overlapping structure. This is not impulsive behavior — it fits better as a corrective Wave X , typically seen before the next leg of decline.
Rising wedges often signal distribution, not accumulation. As long as price stays inside the wedge, upside is suspect and slow, not a trend resumption.
The only actionable trigger here is a decisive break below the lower trendline . Until that happens, this remains a
Avenue Supermarts(1-H): Structure Over NoiseToday’s price action was rough across Nifty and the broader market. But beneath the volatility, some charts are quietly holding their structure — and that’s worth paying attention to.
In Avenue Supermarts Ltd , price has unfolded a clean 5-wave advance on the 1-hour timeframe from the 3605.10 low to 3918.60 , allowing the move to be labeled as Wave 1 / A .
The subsequent decline shows a corrective ABC structure , with overlapping price action and weakening momentum — characteristics ty
Very Short Term View for NiftyWrap up:-
Currently, Nifty is in final wave 5 which was started from 24337 on 08.08.2025. In the pattern of wave 5, Nifty is forming a wxy pattern. Wave w has been completed at 25448 and wave x at 25318 and wave y is expected to be completed in the range of 26630-26868.
In wave y, wave a is completed at 26325 and b is expected to be completed in the range of 25740- 25591; once Nifty breaks and sustains above 25909. Thereafter, Nifty will head towards wave c.
What I’m Watching for 🔍
Buy Ni
Nifty Analysis for Jan 13-16, 2026Wrap up:-
Wave b of y has been treated as completed at 25473 once Nifty breaks and sustains above 25817. Thereafter, Nifty will head towards wave c of y.
What I’m Watching for 13th to 16th Jan, 2026 🔍
Buy Nifty if it sustains above @25817 sl 25473 for a target of 26029-26103-26263-26373.
Disclaimer: Sharing my personal market view — only for educational purpose not financial advice.
"Don't predict the market. Decode them."
Nifty Analysis for Jan 14 and 16, 2026Wrap up:-
Today, Nifty after breakout above 38.2% level i.e. 25817 retested the breakout and take support at 25636-25601 level and buying is activated in this support zone.
Nifty is currently heading towards wave c of y of 5. In wave C, Wave 1 of c was completed at 25899 and wave 2 at 25603 and now, wave 3 is in progress.
What I’m Watching for Jan 14 and 16, 2026 🔍
Buy Nifty 25636-25601 sl 25473 for a target of 26029-26103-26293.
Disclaimer: Sharing my personal market view — only for ed
Nifty Analysis for Jan 19, 20 and 21, 2026Wrap up:-
Nifty after breakout above 38.2% level i.e. 25817 consolidating in the range 25500-25800. Nifty is currently heading towards wave c of y of 5. In wave C, Wave 1 of c was completed at 25899 and wave 2 at 25494 and now, wave 3 is in progress.
What I’m Watching for Jan 19, 20 and 21, 2026 🔍
Buy Nifty 25507-25577 sl 25473 for a target of 26029-26184-26293.
Disclaimer: Sharing my personal market view — only for educational purpose not financial advice.
"Don't predict the market.
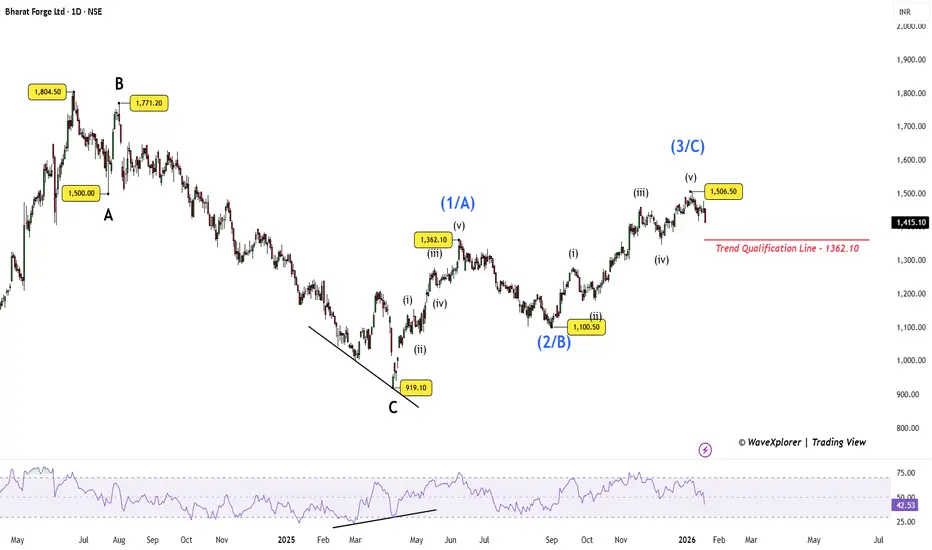
Impulse or Correction? One Line DecidesOne of the most common challenges in Elliott Wave analysis is deciding whether a strong rally is an impulse or just a corrective move . This chart of Bharat Forge serves as a practical example of how Elliott Wave rules help remove that ambiguity.
From the ₹919.10 low, price staged a sharp rally that appears to be unfolding as five waves advance. At first glance, this can easily be mistaken for the start of a new impulsive trend. However, Elliott Wave analysis is not based on appearances
CG Power: A 5% Jump Inside a Bigger CorrectionThe recent 5% move on a positive order win looks encouraging, but the price structure remains corrective . From an Elliott Wave perspective, this is not the time to chase strength .
From the ₹874.70 high , CG Power entered a complex correction . The first leg down, Wave (W) , unfolded as an ABC zigzag and ended near ₹517.75 . From there, price rallied into Wave (X) as an ABC flat (3–3–5) , topping around ₹797.55 .
Although the rise from ₹517.70 to ₹797.55 unfolded in five waves ,
Gold Trapped in Liquidity Range – Expansion PendingGold is currently trading in a post-impulse environment after completing a clear Elliott Wave advance. With the higher-timeframe impulse exhausted, price action has transitioned into a controlled consolidation driven by liquidity, rather than trend continuation.
At this stage, the market is not trending — it is preparing.
Market Structure & Liquidity Context
Price is now boxed between a well-defined Equal High and Equal Low, forming a classic liquidity range. This structure suggests that Smart
Short term Analysis of RelianceWrap up:-
Reliance is making a wxy pattern in wave c and has completed its wave w at 1581 and wave x is expected to be completed near 1450. Thereafter, Reliance will head towards wave y.
What I’m Watching for 🔍
Buy Reliance in the range of 1460-1480 sl 1440 for a target of 1578-1687.
Disclaimer: Sharing my personal view — only for educational purpose not financial advice.
"Don't predict the market. Decode them."
Angel One: Big Move Coming SoonAngel One is moving inside a big sideways range for a long time, with price making ups and downs between support and resistance. Recently, the stock formed a triangle pattern, where highs are getting lower and lows are getting higher. This shows pressure building before a big move. Price is currently near the lower side of the triangle, which acts as support around 2,300 – 2,200. As long as this support holds, the stock can move up. A break above the upper trendline will confirm strength and can
Bullish Flag Brewing in Bandhan BankBandhan Bank is consolidating after a sharp decline, forming what appears to be a potential bullish flag on the chart. The ongoing pullback is overlapping and corrective , suggesting digestion rather than a fresh impulsive sell-off.
As long as price holds above the 141 support zone , the bullish flag structure remains valid. A decisive breakout above the upper channel boundary would confirm continuation and open the door for higher levels.
Until then, this remains a wait-for-confirmatio
MCX Silver: Healthy Dip Before Next RallyMCX Silver is in a strong long-term uptrend on the daily chart. The market has already completed wave 1, 2, and a strong wave 3 upward. After this big rise, price is now expected to make a normal correction (wave 4). This pullback can come toward the 236,000 area, which is an important support zone. As long as price stays above this support, the overall trend remains bullish. After wave 4 is completed, Silver is expected to start wave 5, which can push prices to new highs. In short, the trend
Dr Reddy’s Labs:Oversold Bounce Likely, But Structure Still WeakPrice has now reached a key demand / support zone , while RSI has slipped into oversold territory , a setup that often precedes a technical bounce . From a pure momentum perspective, a short-term relief rally looks likely .
However, the broader structure remains corrective . The stock continues to trade below two declining trendline resistances , and the 50-DMA is hovering near a bearish crossover with the 200-DMA , keeping the higher-timeframe bias under pressure.
The recent price acti
L&T: Wave 5 Exhaustion Signals a Corrective PhaseA clear 5-wave impulse has played out, with Wave 3 showing classic overbought RSI behavior while still respecting Elliott Wave rules.
Wave 5 ended with RSI divergence , signaling exhaustion near the highs.
Price has now slipped below the 100-DMA , reinforcing the view that the advance has likely stalled and a corrective phase is underway. The decline should unfold in at least a 3-wave structure . Importantly, Wave (a) may not be complete yet . Despite RSI reaching oversold levels, there
ICICI Bank: Stable Results, Critical Technical TestICICI Bank Limited announced its Q3 FY26 results after market hours, delivering a quarter marked by stable core performance but profits below market expectations . While the balance sheet remains healthy, the earnings profile does not materially alter the broader technical structure visible on the chart.
This makes it important to assess earnings and price action independently , and then align them within a broader market structure.
Earnings Snapshot — Key Metrics Explained
Profit Aft
Completion of 5 wavesPower India has completed 5 waves where wave 1 is the longest . It is in the form of a diagonal. The correction is still unfolding and should end i the vicinity of wave 2 , preferably near it low around 10000-11000. It is still making red candles . Correction will be over then we get a good green candle who top should be traded by another green candle or appearance of 3 white soldier in the vicinity of wave 2.
Angel One: Power Bounce or Wave 4 Noise?Since its inception low near ₹222 , Angel One Limited has delivered a strong multi-year advance. The initial rally into ₹1,689 is best viewed as Wave 1 , followed by a deep yet corrective decline toward ₹990.50, forming Wave 2 . This laid the foundation for an extended Wave 3 , which accelerated sharply and culminated near ₹3,896 .
Following the Wave 3 peak, price action transitioned into a sideways and overlapping phase , characteristic of a complex Wave 4 correction rather than the st
The next multibagger in the making - WAAREE RENEWABLE TECHConsider only for long term investment , given the current financial and technical position of this company right now , its about to gain traction in the coming months. Let's see how it performs in the years to come! , looks good for long term investors.
Short term Analysis of GoldWrap up:-
Gold has almost completed a impulse of major wave 3 and also making a wxy pattern in wave 5 of wave 3. Buying Gold at these levels may lead to regret over time. Now, correction in Gold is about to start in coming 1-2 months.
What I’m Watching for 🔍
Short Gold once it breaks 38.2% level of wave y (i.e. from $3998 to a current high or if a new high is made then upto that level) for a target of $3702-$3577-$3446.
Disclaimer: Sharing my personal view — only for educational purpose