Elliott Wave
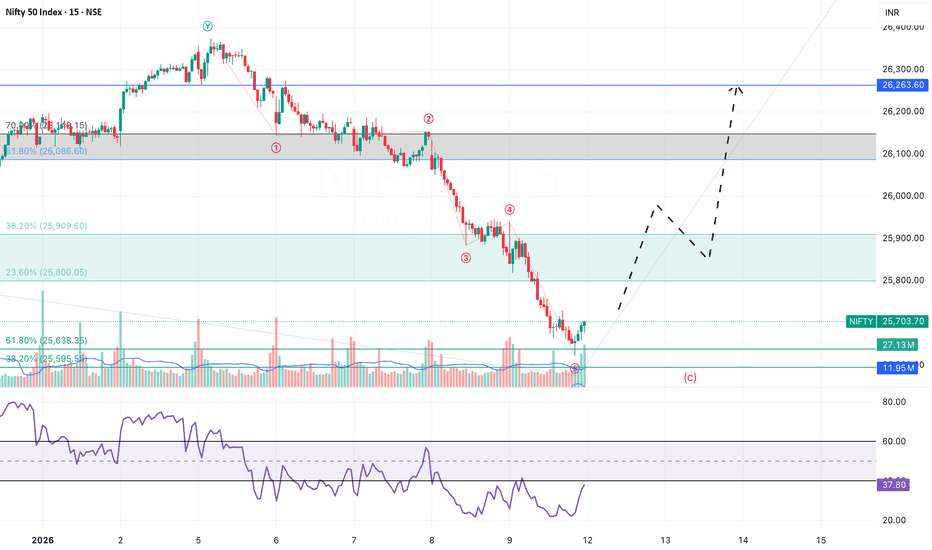
Nifty Analysis for Jan 12-13, 2026Wrap up:-
As mentioned earlier, due to break of 25693, whole of the counts of wave y of 5 have been changed and wave a of y has been completed at 26325 and wave b of y is expected to be completed in the range of 25638-25595. Thereafter, Nifty will head towards wave c of y.
What I’m Watching for 12th to 16th Jan, 2026 🔍
Buy Nifty if it sustains above @25909 sl 25595 (15 min. candle closing basis) for a target of 26086-26148-26263.
Disclaimer: Sharing my personal market view — only for edu
BHEL – Approaching a Key Reversal Zone on the Weekly ChartBHEL has been in a broader W–X–Y corrective structure since topping out near ₹335 on the weekly timeframe. The first leg down (Wave W) completed around ₹176, followed by a steady recovery that is now pushing into a major resistance zone.
The current bounce looks like the tail end of Wave X , with price entering the 100% extension area of (a) near ₹301. This is a natural place where counter-trend rallies often slow down or fully exhaust.
Momentum remains strong — weekly RSI is pushing into t
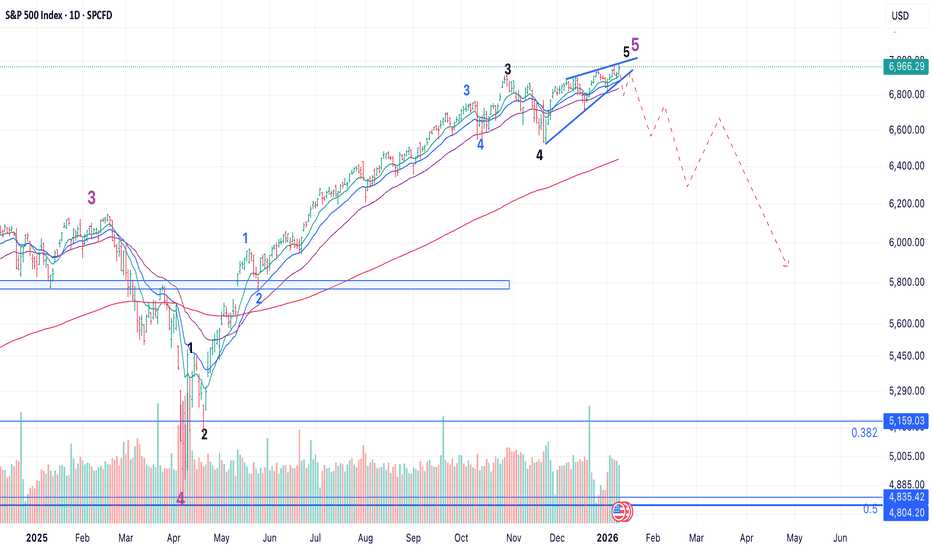
SPY - Hope it tops this time :)US markets have been super resilient, sucking capital from across the world.
We have a good pattern in place, as the triggers for pushing the market up have been reducing with time, with everything running quite thin.
The rally has been quite low on breadth and is supported on weak pillars - but still has been resilient and all selling have been bought into.
Let's see if it breaks and sustains this time.
We need a 10-15% (ideally + 20%) fall in US for money to flow into emerging markets :)
It i
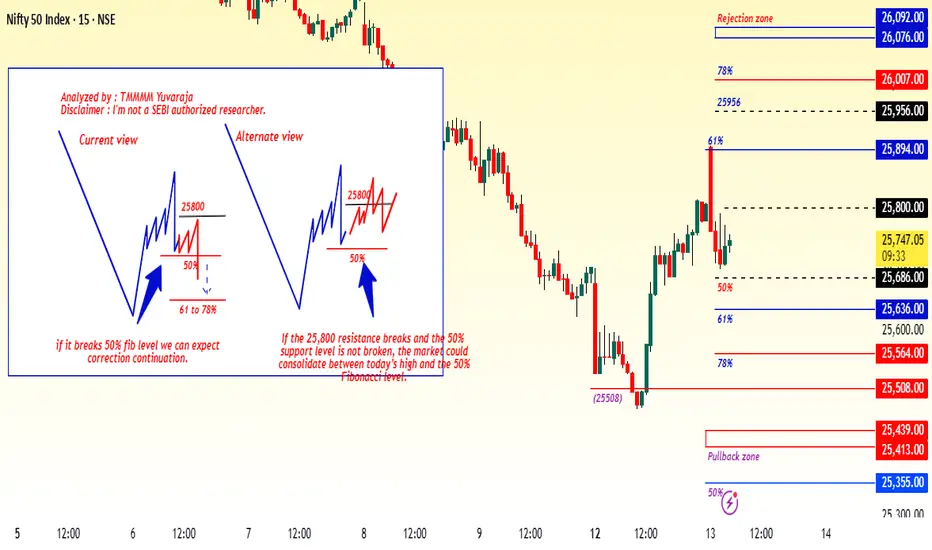
#Nifty Directions and Levels for Jan 12thGood morning, friends! 🌞
Market Directions and Levels for Jan 12th
Global remains positive, though Indian markets show a bearish bias. Today, the market may open neutral to slightly gap down, as GIFT Nifty trades about 20 points lower.
Current View
> If the market declines initially, the immediate support zone is expected to act as a strong support.
> If price gets rejected from this zone, structurally this could be a 5th sub-wave. In that case, the 5th sub-wave correction may complete here
#Banknifty Directions and Levels for Jan 12thCurrent View
> If the market declines initially, the immediate support zone is expected to act as a strong support.
> If price gets rejected from this zone, structurally this could be a 5th sub-wave. In that case, the 5th sub-wave correction may complete here, followed by a bounce of around 38%–61% of the minor swing.
> This is the base structure. However, if price does not reject around the pullback zone, the 5th sub-wave could extend toward 58,737.
Alternate View
> The alternate scenario
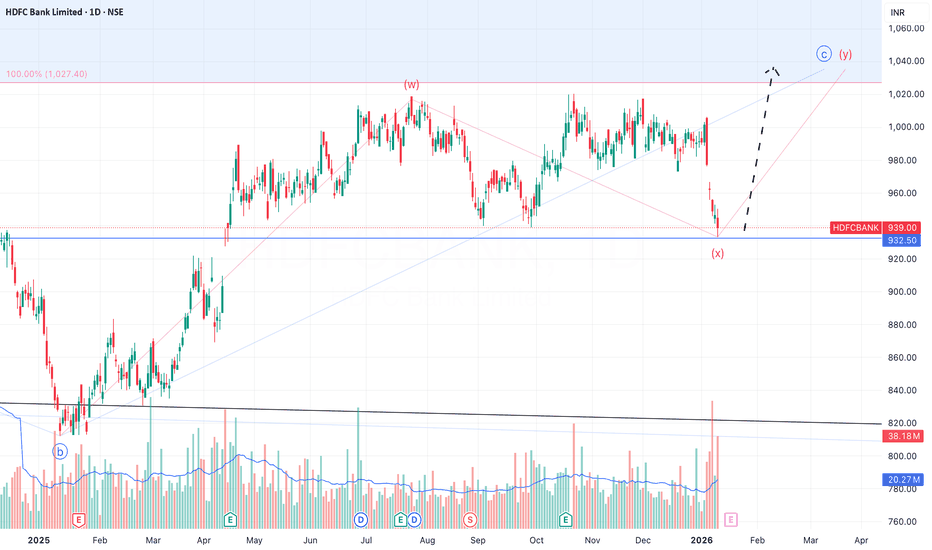
Short term Analysis of HDFC BankWrap up:-
HDFC Bank is making a wxy pattern in wave c and has completed its wave w at 1018 and wave x is completed at 933. Thereafter, HDFC Bank will head towards wave y.
What I’m Watching for 🔍
Buy HDFC Bank @933 sl 927 for a target of 1027-1078.
Disclaimer: Sharing my personal view — only for educational purpose not financial advice.
"Don't predict the market. Decode them."
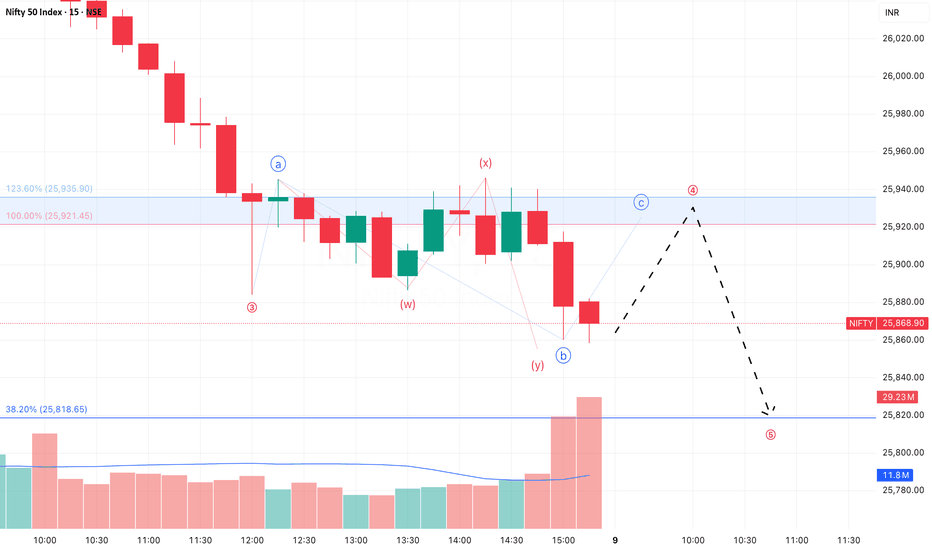
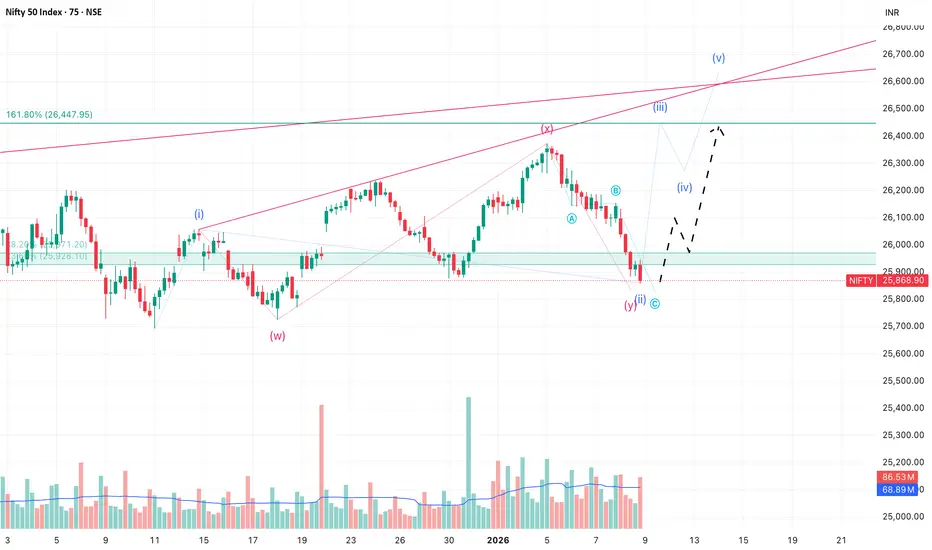
Updated Nifty Analysis for Jan 09, 2026Wrap up:-
As updated earlier, wave 1 was completed at 26057 but wave 2 counts have now been changed due to a sudden fall and is expected to be completed in the range of 25800-25850. Thereafter, nifty will head towards wave 3.
What I’m Watching for Jan 09, 2026 🔍
Buy Nifty only above @25971 sl 25858 (15 min. candle closing basis) for a target of 26447-26630.
Short Nifty in the range @25935-25921 sl 25971 (15 min. candle closing basis) for a target of 25818.
Disclaimer: Sharing my personal
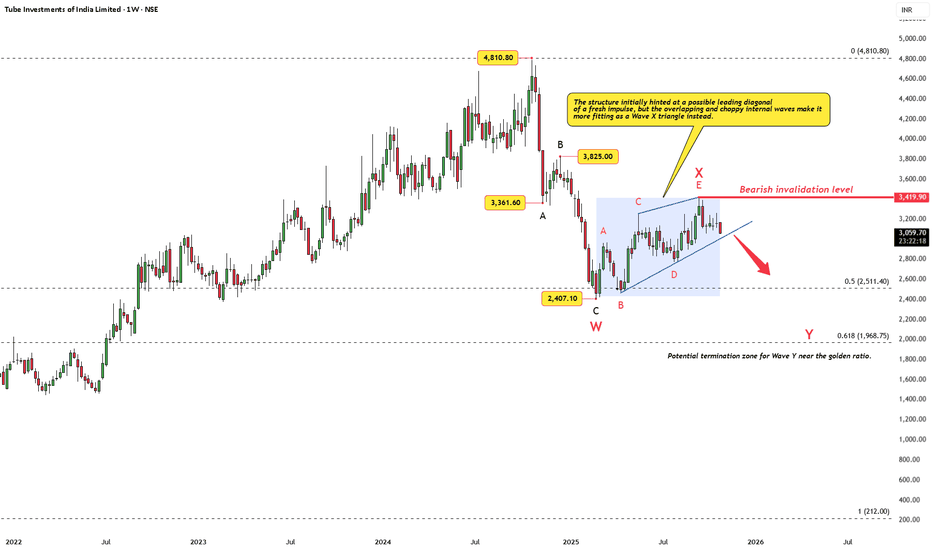
Tube Investments of India Ltd — Wave X Triangle in PlayAfter the sharp decline from ₹4,810, the recent advance initially looked like a potential leading diagonal of a new impulse. However, the internal overlaps and choppy rhythm point instead to a Wave X triangle, likely part of a larger corrective sequence (W–X–Y).
As long as price holds below ₹3,419.90, the bearish outlook remains intact, with the next leg — Wave Y — possibly aiming toward the 0.5–0.618 retracement zone (₹2,511–₹1,968). That region, close to the golden ratio, may act as a potenti
Nifty Analysis for Jan 09, 2026Wrap up:-
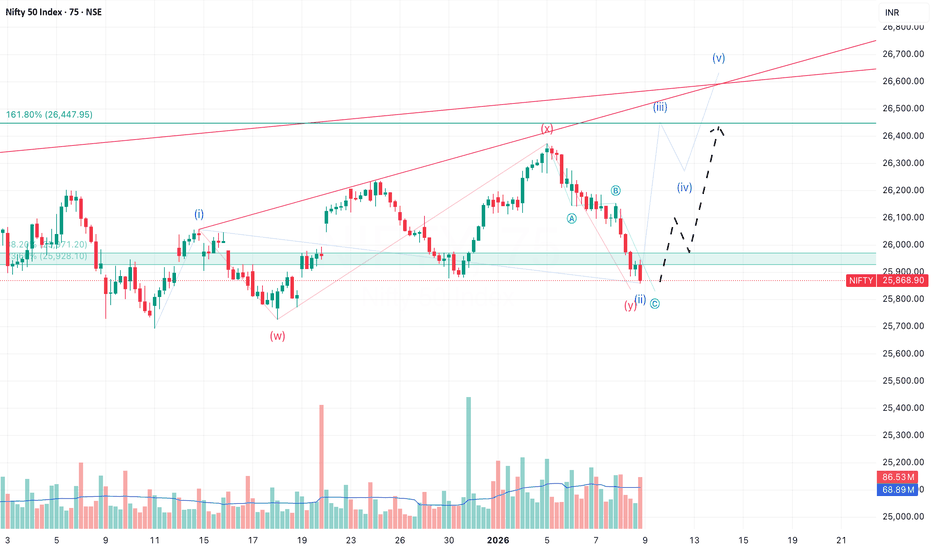
As updated earlier, wave 1 was completed at 26057 but wave 2 counts have now been changed due to a sudden fall and is expected to be completed at 25858 if nifty breaks and sustains above 25971. Thereafter, nifty will head towards wave 3.
What I’m Watching for Jan 09, 2026 🔍
Buy Nifty above @25971 sl 25858 (15 min. candle closing basis) for a target of 26447-26630.
Disclaimer: Sharing my personal market view — only for educational purpose not financial advice.
"Don't predict th
Nifty Analysis for Jan 08, 2026Wrap up:-
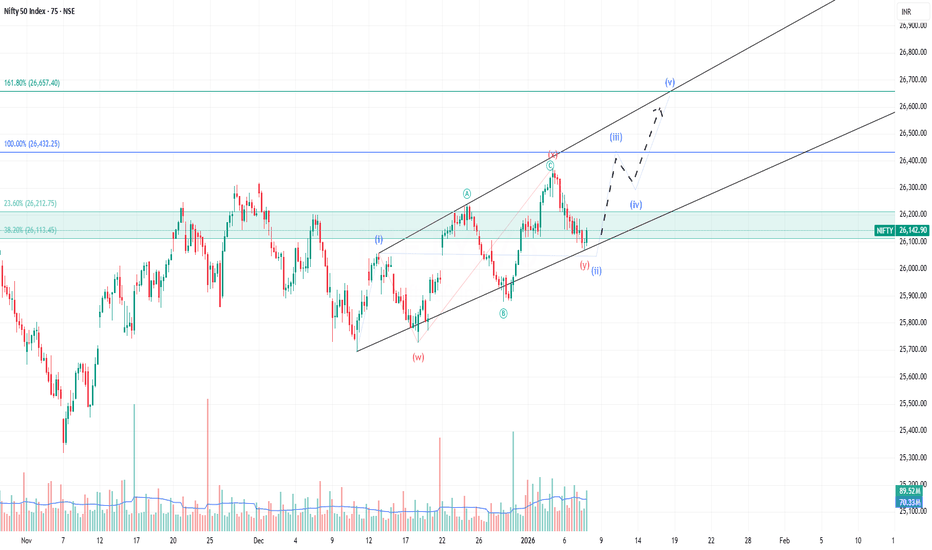
As updated earlier, wave c is an impulse wave. But, now the counts have been changed with wave 1 at 26057, wave 2 at 26067 and now, nifty heading towards wave 3.
Buy Nifty @26140 sl 26008 (15 min. candle closing basis) for a target of 26432.
Disclaimer: Sharing my personal market view — only for educational purpose not financial advice.
"Don't predict the market. Decode them."
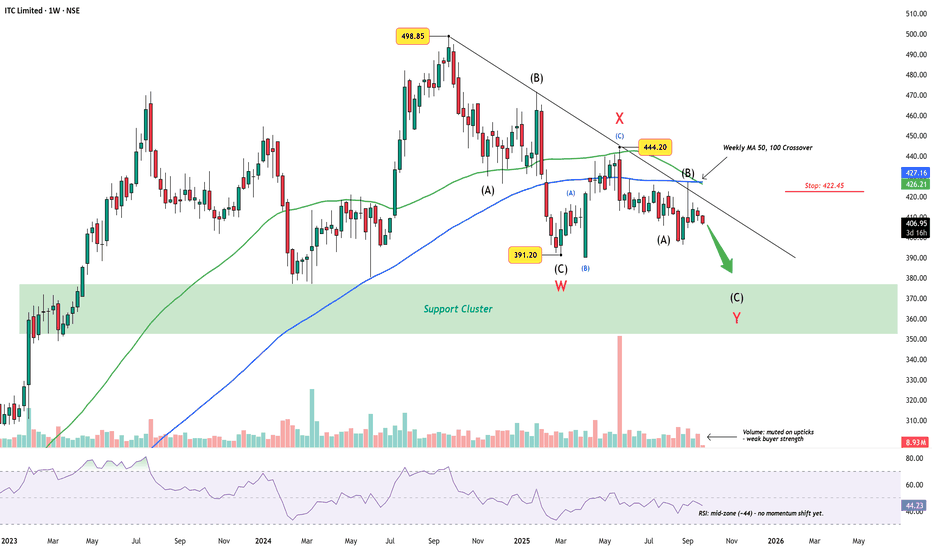
ITC Limited Weekly Chart – Wave Y Targets Support ClusterITC has been trending lower since the ₹498.85 peak, carving out what appears to be a complex W-X-Y correction. The first leg (W) found support near ₹391.20, followed by a corrective bounce into X at ₹444.20. The decline since then has kept price under a descending trendline, respecting the larger corrective rhythm.
Wave Count
Wave W: Completed into the ₹391.20 low.
Wave X: Counter-trend rally capped at 444.20.
Wave Y: Now unfolding, with sub-wave (C) still incomplete.
The broader stru
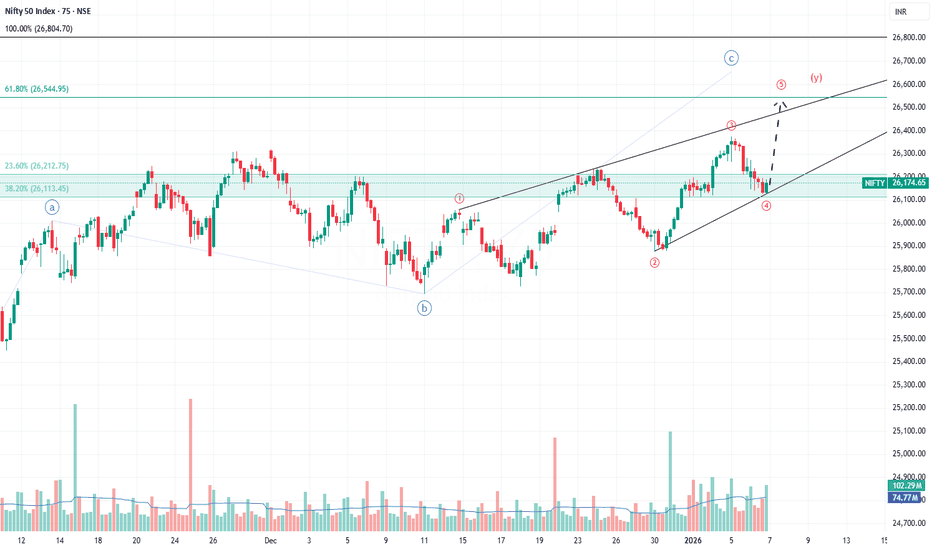
Nifty Analysis for Jan 07, 2026Wrap up:-
As updated earlier, wave c is an impulse wave with wave 1 at 26057, wave 2 at 25878, wave 3 at 26373 and wave 4 is expected to be completed in the range of 26212-26113. Thereafter, heading towards wave 5.
Now, wave 4 is completed at 26124 and heading towards final wave 5.
Buy Nifty @26124 sl 26113 (75 min. candle closing basis) for a target of 26544-26804.
Disclaimer: Sharing my personal market view — only for educational purpose not financial advice.
"Don't predict the market
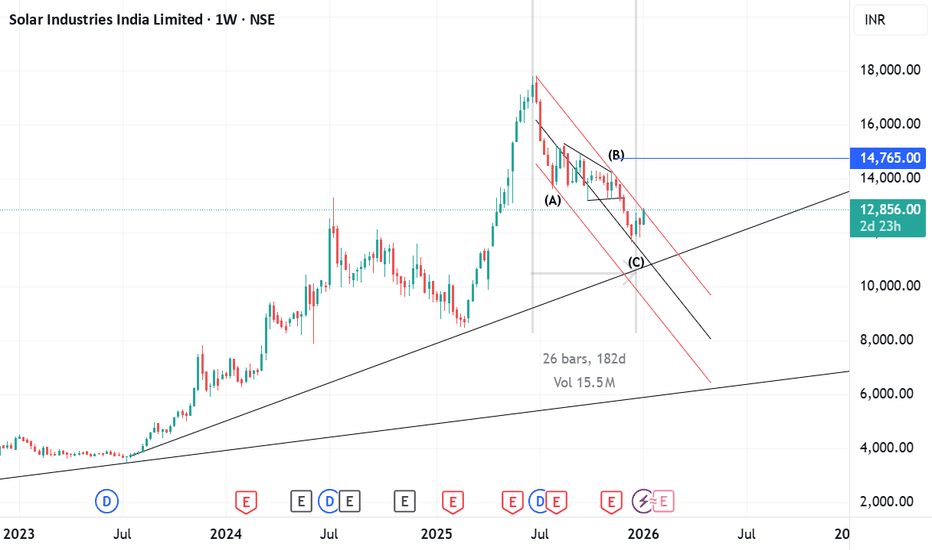
End of ABC correction - Only for long term investorsThe correction in Solar Industries is complete
1) A(impulse) - B (triangle) - C (Impulse)
2) Wave C is exactly 0.618% of wave A extended from the end of wave B.
3) The entire correction has lasted for 26 weeks , which is an Ichimoku Time (Actual time is 27, but +1/1 is permissible)
4) Wave C rests exactly at the middle line for the ABC channel.
5) Wave C ends exactly at 0,618 of the impulse it is correcting
Buy a pullback for a target of 14765 and a SL of 11616.
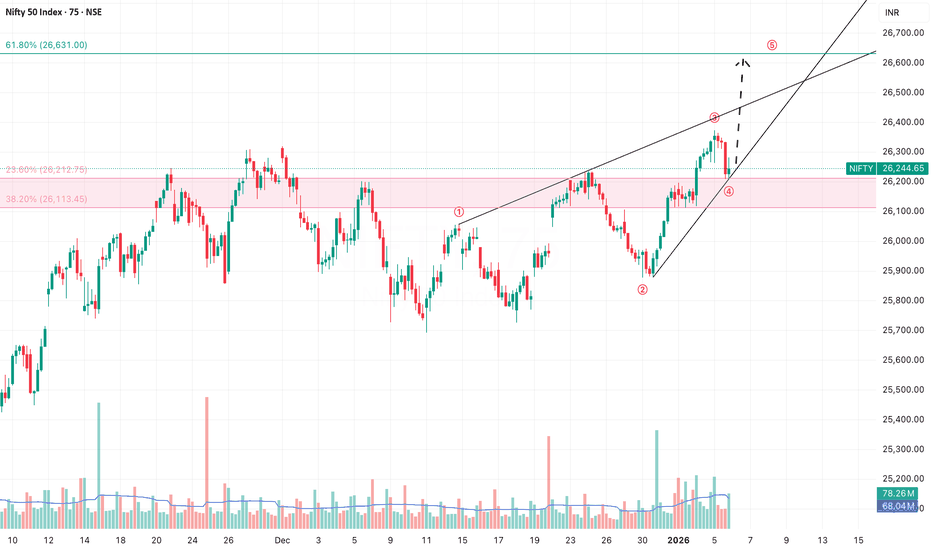
Nifty Analysis for Jan 06, 2026Wrap up:-
As updated earlier, Nifty has fallen before achieving 26421 so it is not a Ending diagonal formation in wave c. It is an impulse wave with wave 1 at 26057, wave 2 at 25878, wave 3 at 26373 and wave 4 is expected to be completed in the range of 26212-26113. Thereafter, heading towards wave 5.
Buy Nifty @26212-26113 sl 26113 (75 min./1 hr candle closing basis) for a target of 26630-26890.
Disclaimer: Sharing my personal market view — only for educational purpose not financial advice
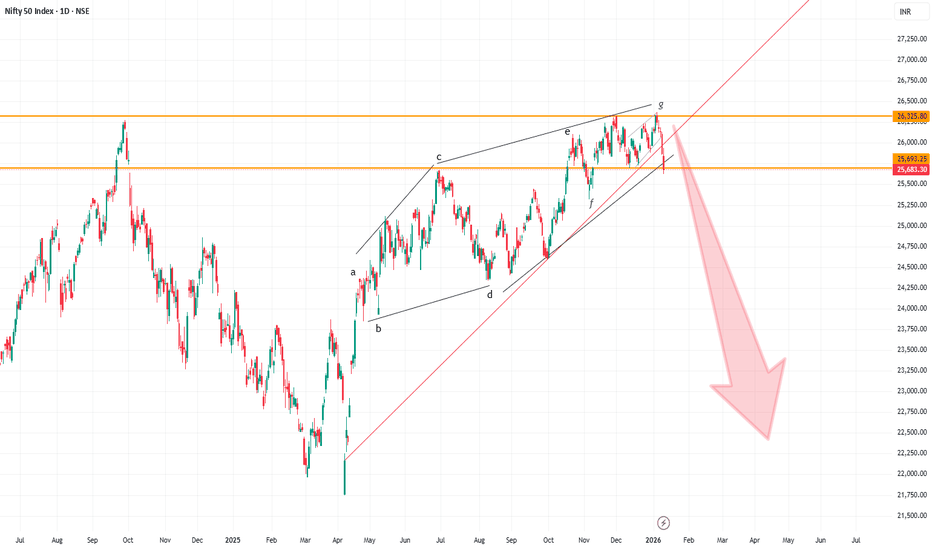
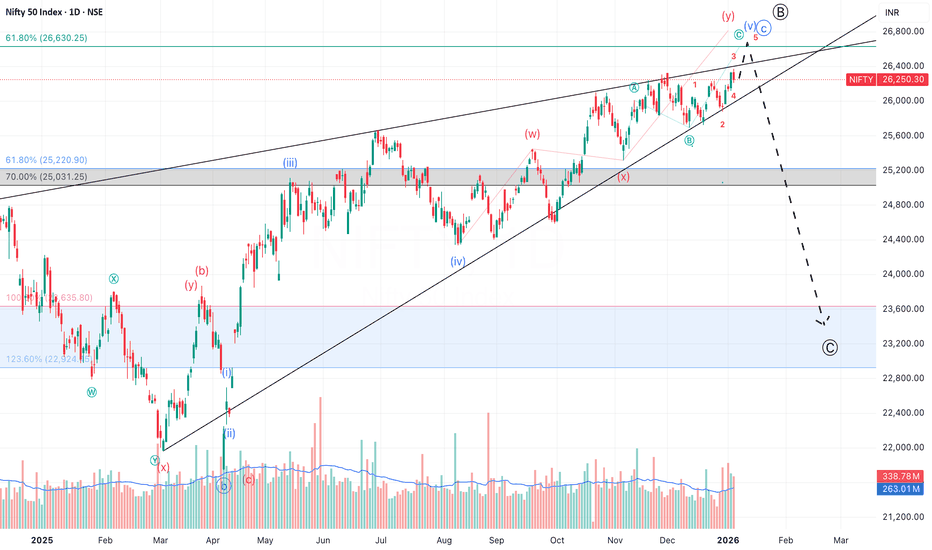
Updated Positional View for Nifty from January to March, 2026Wrap up:-
After breaking ATH of 26277 dated 27.09.2024, Major wave X has been shifted further and pattern counts has been changed at major level. Now, wave w of major wave x has been completed at 26277 and wave x is in progress.
In wave x, a is completed at 23263 and b is expected to be completed in the range of 26630-26890. Thereafter, Nifty will head towards wave c for a min. target of 23635.
Now, we have to check internal pattern of Nifty which is currently in progress i.e. wave 5 from 24
Nifty Analysis for Jan 05, 2026Wrap up:-
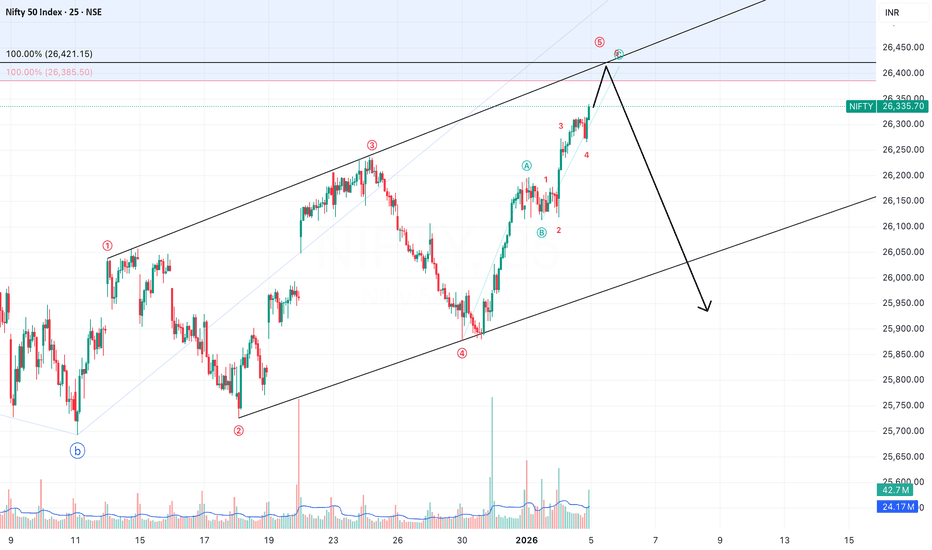
Nifty forming a Ending Diagonal pattern in wave c.
In wave c of y of 5, wave 1 is completed at 26057, wave 2 at 25726, wave 3 at 26236, wave 4 at 25878 and now, nifty is in final wave 5 of wave c.
In wave 5 of c of y of 5, nifty forming abc pattern. In wave c, nifty is in 5th wave.
Short Nifty @26421 sl 26450 (daily closing basis) for a target of 26300-26135.
Disclaimer: Sharing my personal market view — only for educational purpose not financial advice.
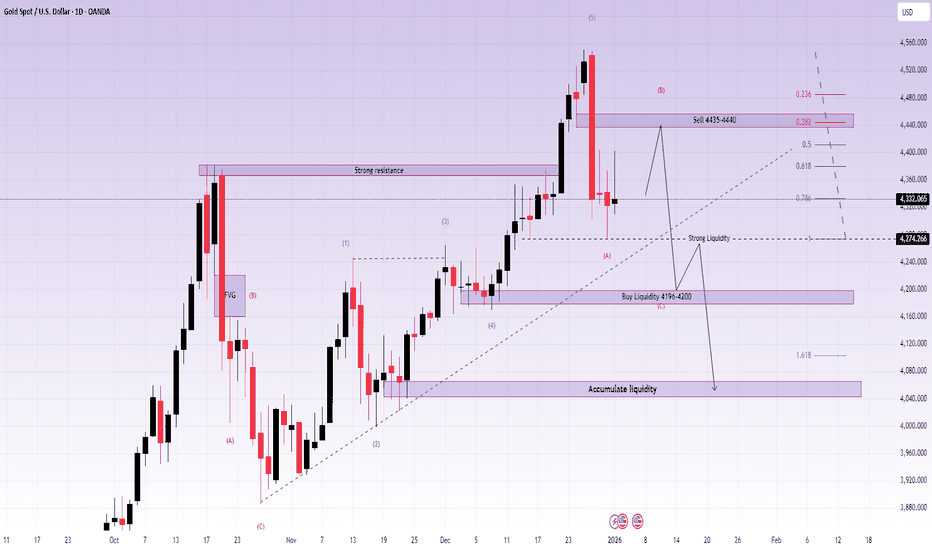
XAUUSD (D1) – Elliott ABC pattern activeLana sells the pullback, waits to buy at major liquidity 💛
Quick summary
Timeframe: Daily (D1)
Elliott view: Price is likely developing an ABC corrective structure after a strong rally
Strategy: Sell the B-wave pullback into supply, buy only when price returns to strong liquidity
Context: Precious metals started 2026 strong, but short-term volatility and re-accumulation swings are still expected
Fundamental backdrop (supports the bigger trend)
Gold and silver opened 2026 with strong momen
Updated Positional View for Nifty from January to March, 2026Wrap up:-
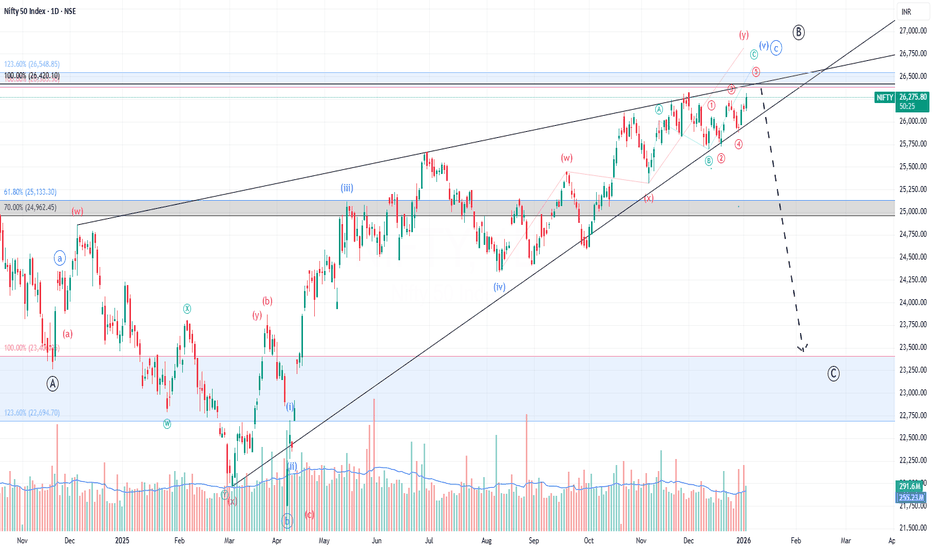
After breaking ATH of 26277 dated 27.09.2024, Major wave X has been shifted further and pattern counts has been changed at major level. Now, wave w of major wave x has been completed at 26277 and wave x is in progress.
In wave x, a is completed at 23263 and b is expected to be completed at 26420 and thereafter nifty breaks and sustains below 24633 (which is 38.2% of 21743 to 26420). Thereafter, Nifty will head towards wave c for a min. target of 23406.
But, the range is very large
Positional View for Nifty from January to March, 2026Wrap up:-
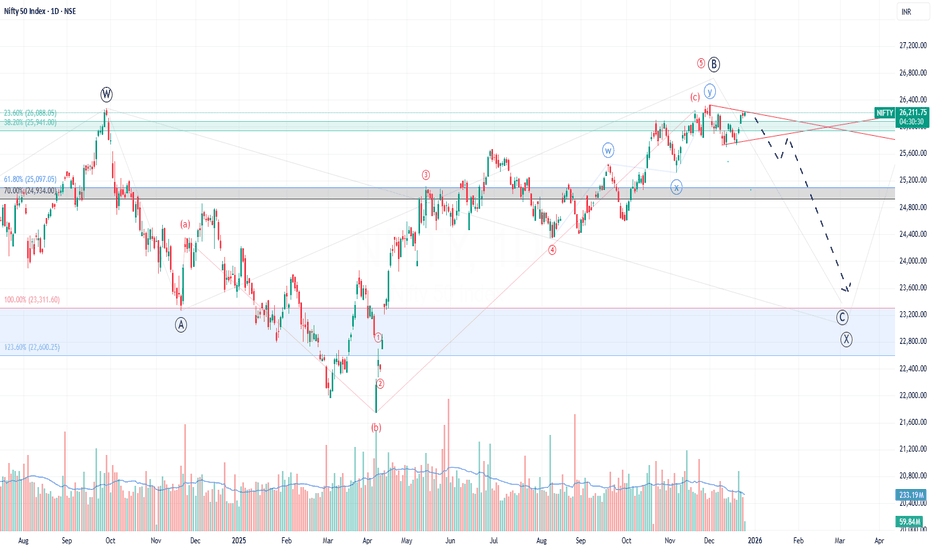
After breaking ATH of 26277 dated 27.09.2024, Major wave X has been shifted further and pattern counts has been changed at major level. Now, wave w of major wave x has been completed at 26277 and wave x is in progress.
In wave x, a is completed at 23263 and b is treated as completed at 26325 once nifty breaks and sustains below 24581 (which is 38.2% of 21743 to 26325). Thereafter, Nifty will head towards wave c for a min. target of 23311.
But, the range is very large in between 26