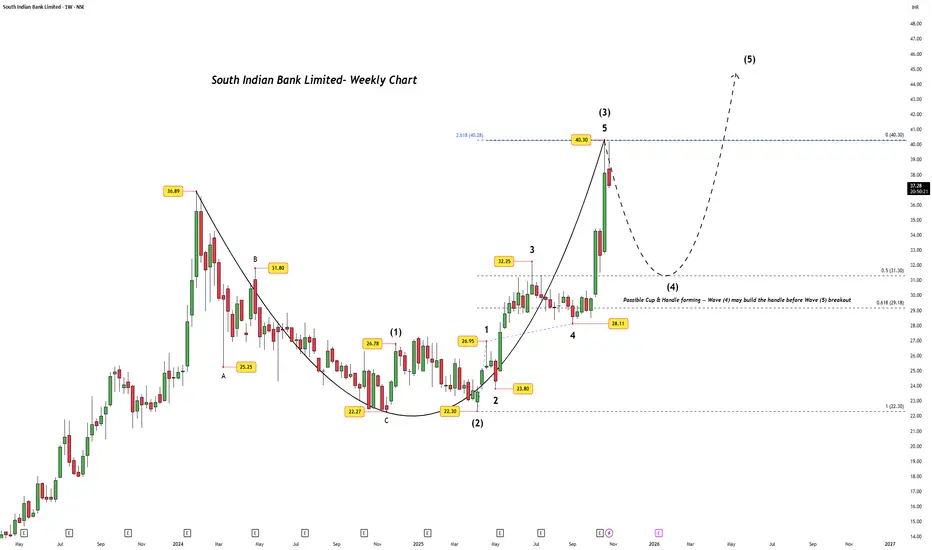
South Indian Bank Ltd — Going South Before It Heads North?After a stellar impulsive rise, South Indian Bank seems to be taking a short trip south — just to refuel for its next northern journey.
The weekly chart unfolds a beautiful Elliott Wave sequence, where Wave 5 of (3) topped precisely at ₹40.30 , aligning exactly with the 2.618 Fibonacci extension of Wave 1 (₹22.30–₹26.95) projected from Wave 4 (₹28.11).
Such precision often signals wave exhaustion — and that’s what we’re seeing now, as prices cool off from the climax of Wave (3). The retra
Elliott Wave
ABREL - Completion of WXYXZ Pattern - Go long
Aditya Birla Real Estate Limited completed W5 of primary degree on 21 Oct 24 and has been undergoing correction.
The stock completed triple zigzag in the form of WXYXZ correction on 6 Oct 2025 and is forming a new impulse.
Trend is confirmed as stock is forming HH, HL with increasing volumes.
One may consider going long on the stock with a medium to long-term perspective.
MCD Bulls Loading: Major Wave (3) Move ComingMcDonald’s has completed a clean 5-wave push to the upside, finishing Wave (1)/(A) near the recent high. After that, price entered a corrective channel forming an A-B-C pullback, which now looks close to completing as Wave (2)/(B). The drop is losing momentum near support, suggesting sellers are running out of strength. Once this correction finishes, the chart expects a sharp bullish move into Wave (3)/(C), targeting higher levels above recent highs. In simple terms: correction almost done → str
GBP/USD Correction Almost Done: Bulls LoadingGBP/USD has already completed a big corrective structure from the previous high and is now moving inside a complex W-X-Y pattern. The current drop is forming the final C-wave of Wave Y, which suggests the bearish move is close to finishing. Price is likely to dip slightly lower near the support zone before finding buyers again. Once this final leg completes, the chart expects a strong bullish reversal to the upside. In simple terms, one more small drop to finish the correction, then GBP/USD shou
Gujarat Gas Ltd – A Major Correction Nears CompletionAfter a volatile two-year decline, Gujarat Gas Ltd (NSE: GUJGASLTD) may be approaching the final leg of a prolonged corrective structure — a setup that aligns beautifully across both monthly and daily timeframes.
The Bigger Picture – Monthly View
From the 2016 lows near ₹94 , Gujarat Gas advanced in an impressive impulsive manner , peaking around ₹786.
What followed has been a deep and time-consuming correction that unfolded as a double zigzag (W–X–Y) structure.
Wave W bottomed at ₹40
GLong
XAU/USD Completing Wave Y: Final Dip Before RallyGold has completed its major 5-wave rise and is now finishing a corrective W-X-Y pattern. The recent drop looks like the final leg of this correction, meaning sellers are getting weaker. Price may show a small bounce up and then one last dip to complete the correction. After that final drop, a strong new uptrend is expected to start again. In short: correction ending soon, last dip big bullish move ahead.
Netflix: Wave Z or a Surprise Truncation Ahead?After a textbook W–X–Y–X structure, Netflix now appears to be sketching the final leg “Z” inside a well-defined descending channel. Each corrective wave has respected the parallel boundaries — a sign of structural discipline rather than chaos.
The latest drop to $1,087.30 tagged the channel’s lower rail and the Major Pivot near $1,064.50, precisely where the RSI has also reached its long-term support zone. This alignment hints that the market may be nearing exhaustion — but whether it’s the end
Is GOLD headed to ~2500 as part of correction ?Gold had a good run up from ~1600 levels to ~3500 level.
It seems to have completed Wave3 and has ended week with Shooting start candle.
Invalidation :
This view of correction is invalidated if Gold closes above 3500 as part of weekly close.
The correction time period may be around 6~8 months.,
Is Wave 5 About to Lift Indian Bond Yields Higher?After a strong impulsive rise from 6.13% to 6.65%, the India 10-Year Government Bond Yield appears to be consolidating in a textbook Wave 4 contracting triangle . Each leg within the pattern—(a) through (e)—shows the typical compression seen before the final thrust in yields.
If this interpretation holds, a Wave 5 breakout may soon lift yields higher toward or beyond the 6.7% region, completing the larger five-wave structure.
Market Implication:
A rise in bond yields usually reflects tigh
Larsen & Toubro: Wave 3 Heating Up — Eye on the Final 5After a clean impulse from ₹2,965 to ₹3,708 (Wave 1) and a extended flat correction to ₹3,405 (Wave 2), Larsen & Toubro has resumed its upward journey in what appears to be an extending Wave 3 .
Structure in Focus
Wave 3 reached the 1.618 × Wave 1 projection near ₹3,969 — an ideal zone for minor profit-taking.
A short-term Wave 4 pullback could unfold toward ₹3,860 – ₹3,795 (Fib 0.236–0.382 retrace).
As long as price holds above ₹3,727 (invalidation) , the structure stays firmly im
Federal Bank: Wave 4 Triangle Near Completion, Wave 5 AheadAfter a clean five-wave impulse from the 2020 low near ₹35.70 to the 2024 peak at ₹220, Federal Bank appears to be transitioning into a larger corrective phase.
Weekly Outlook
The broader structure suggests the start of a 5-3-5 zigzag correction , marked as A–B–C .
Wave A is still unfolding — only Wave 4 of A appears complete, with Wave 5 expected next to finish the first leg of the correction.
Once Wave 5 concludes, price could rebound toward the lower channel trendline to form Wave B
Cummins India – Wave 4 Expanded Flat Before New ATHFrom the 2580 low , Cummins India has likely started a new impulse sequence .
Wave 1 unfolded as a Leading Diagonal , confirmed by messy overlaps and volume spikes.
A sharp Wave 2 retracement was followed by a powerful Wave 3 rally to 3900.
RSI has held a rising trendline throughout, supporting momentum.
Now, price action suggests a Wave 4 Expanded Flat :
Wave A dipped from 3900.
Wave B exceeded the high.
Wave C is projected to retrace into the 3737–3637 Fib zone , offering an
State Bank of India – Breakout, but With CheckpointsWeekly Chart View
State Bank of India has staged a strong breakout above the consolidation zone near ₹835, with weekly RSI showing healthy momentum and no bearish divergence yet. This breakout suggests that Wave 3/C is in progress , keeping the short-term outlook bullish.
Key Observations:
Wave 2/B: The recent sideways move looks like a triangle. While triangles are unusual for Wave 2, they are common in Wave B — raising the possibility that this could be part of a larger corrective flat.
City Union Bank – Tight Stop, Wave 3 Setup in PlayDisclaimer: This analysis is for educational purposes only and does not constitute investment advice. Please do your own research (DYOR) before making any trading decisions.
Elliott Wave Setup
City Union Bank has completed a W–X–Y double zigzag correction into 193.50, with Wave Y equaling Wave W — a classic case of corrective symmetry. From that low:
Wave 1 unfolded as a leading diagonal.
Wave 2 corrected as a running flat, showing underlying strength.
Price is now attempting a break
Is the SPX500 Correction OVER ?Analysed 1Hr chart:
SPX 500 is correcting from around FEB 25th
It has has been correcting in complex ABC pattern
Within last Leg that is C, it has been doing W-X-Y correction.
Will it have one more Z leg ?
YES : If it retraces/does not cross previous high
When this structure will be invalid ?
When a hourly close is below 5096.
What is the road map if the current structure holds good ?
Wave-3 ~6000
Wave-4 Correction , back to 5500 ??
Wave-5 ~6200
Assumption: It follows plotted channel
Tim
Short Term SPX to hit a target of ~6800 post current correctionSPX is in a small time correction phase.
Is the correction ended ?
May not be, for it to prove correction has ended, price should show break out above current short term range.,
What are possibilities ?
a) Price does a break out of current range and flows blue line to ~6800 target
b) Price carries out ABC (RED ABC as marked) and bottom out around ~6200, then rise in impulse to hit a target of ~6800.
When ?
The view is time agnostic, so it may take weeks to months time.
Nifty - Elliot WavesNifty showed some strong recovery today and seems to be headed higher.
There are two possibilities - We just recover part of the fall in B and then head to 24k in C down or we make a new high till 25800 and then head down to 23800.
My favored count is the latter, why? Because I expect BNF to make a new swing high.
Also, why am I looking and a new low? - Bank Nifty did a 5 wave down, so at least one new low has to come in another 5 waves down till 50-51k (I am expecting a deeper cut till 45-46k
Gold – At a Historic CrossroadGold’s price history in trading view traces back to January 1833, with the lowest price at $20.54 per ounce (Jan 1905).
The yellow metal completed its first Super Cycle Wave (I) in Jan 1980, peaking at $875 — a 42x rise from its lowest value — followed by a 20-year correction ending in Aug 1999 - Super Cycle Wave (II).
Since then, gold has been unfolding Super Cycle Degree Wave (III) as a 5-wave structure as given below:-
Sub-wave I peaked in Mar 2008 ($1032.35)
Sub-wave II completed in Oct 2
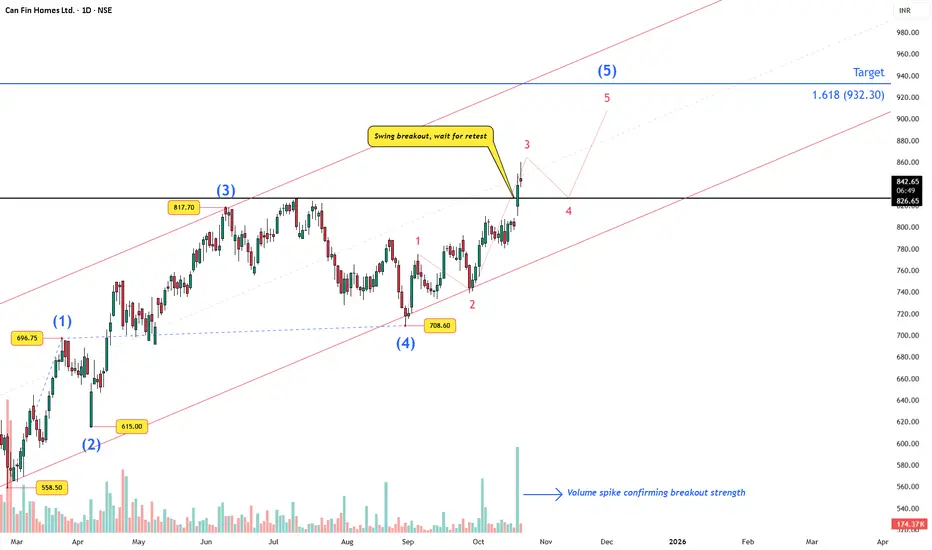
Can Fin Homes: Fifth Wave Ignites with Volume BoostAfter completing the third wave advance up to ₹817 and a corrective Wave (4) near ₹708, Can Fin Homes has broken past the prior swing high with a clean volume expansion.
Wave Structure
Impulse sequence from ₹615 (Wave 2) to ₹817 (Wave 3), followed by a deep yet proportional Wave 4.
The current move looks like Wave (5) unfolding with minor waves 1-2-3 already visible.
Price has cleared the swing barrier at ₹826 — watch for a healthy retest near ₹826–₹830 before Wave 4 of (5) and a final p
HDFC Bank: Expanded Flat Unfolding Near Double-Top ZoneAfter a clean five-wave advance from ₹681.80 to ₹1,018.85, HDFC Bank appears to be tracing a textbook expanded flat correction.
Wave Structure
Wave 4 unfolded as a triangle, setting the stage for a channeled Wave 5 that topped at ₹1,018.85.
The subsequent decline to ₹940 formed Wave A, and the sharp rebound to ₹1,020 marks a classic B-wave retest of the prior high — effectively a double-top zone.
Wave C could now stretch toward the 0.5–0.618 retracement cluster (₹850–₹810) — an area also
USOIL Near Final Leg USOIL is forming a clear corrective pattern inside a falling channel. Price is currently in the final leg of wave (5) of (C), suggesting one more dip is likely before reversal.
The downside target lies near 5,000–5,200 , where support from the channel base aligns. Once this level holds, a strong bullish reversal is expected, marking the end of the correction and the start of a new upward trend.
Stay Tuned!
@Money_Dictators :)