XAUUSD: ABC Correction Following Wave 5Gold has reached the upper Elliott wave 5 area after a strong bullish recovery. From Kelly’s view, the main trend is still strong, but price may need an ABC correction before the next clean bullish setup appears.
⟡ Market structure
The chart shows gold pushed sharply from the lower base and is now reacting near 4,600.
This area is close to the End wave 5 zone around 4,640–4,670, so short-term hesitation or rejection is normal.
If gold cannot break higher directly, price may start an ABC correction. The first support to watch is the Buy zone around 4,380–4,410. A deeper correction may bring price towards the End wave C / Buy zone around 4,200–4,230.
➤ Key levels
◌ 4,600: current reaction area
◌ 4,640–4,670: End wave 5 / resistance zone
◌ 4,500: first support checkpoint
◌ 4,380–4,410: main buy zone
◌ 4,200–4,230: End wave C / deeper buy zone
◌ Above 4,670: bullish extension zone
⌁ Elliott Wave view
Gold may have completed or is close to completing wave 5.
After wave 5, the market usually needs an ABC correction:
Wave A: first pullback from the high
Wave B: rebound from support
Wave C: deeper correction into the main buy zone
If wave C ends around 4,200–4,230 and buyers defend it, gold may prepare for the next bullish recovery.
▸ Trading scenario
Preferred scenario: wait for gold to complete the ABC correction before buying.
Sell reaction zone: 4,640–4,670 if rejection appears
Take profit 1: 4,500
Take profit 2: 4,380–4,410
Buy zone 1: 4,380–4,410 if bullish confirmation appears
Buy zone 2: 4,200–4,230 if wave C extends deeper
Stop loss: below the confirmed wave C low
Take profit 1: 4,500
Take profit 2: 4,600
Take profit 3: 4,640–4,670
◌ Invalidation
If gold breaks above 4,670 and holds strongly, the ABC correction may be delayed and wave 5 can extend higher.
⌁ Kelly’s view
For Kelly, gold is still in a bullish macro structure, but the current area is not ideal for chasing buys.
The cleaner plan is to wait for the ABC correction.
If the buy zone holds, gold may build the next bullish structure again.
Share your view below.  Short
Short
XAUUSD: Retracement before Wave 5 RallyGold is still holding a bullish Elliott structure after a strong recovery from the lower zone. From Kelly’s view, the current move suggests that XAUUSD may be preparing for wave 5 continuation, but price may need a correction first before the next upside leg becomes cleaner.
⟡ Market structure
The chart shows gold pushed strongly from the 4,320 area and broke higher into the 4,500 region. Price is now reacting near 4,488 after slowing below the short-term resistance around 4,515–4,525.
This does not break the bullish view. It looks more like a wave 4 correction before the market attempts another move higher.
The key area to watch is the Buy zone wave 5 around 4,440–4,460. If gold pulls back into this zone and buyers defend it, the next bullish wave may continue towards the upper Fibonacci target around 4,640–4,660.
➤ Key levels
◌ 4,440–4,460: Buy zone wave 5
◌ 4,488: current price reaction area
◌ 4,515–4,525: short-term resistance
◌ 4,640–4,660: End wave 5 / Fibonacci target
◌ Below 4,430: bullish setup starts to weaken
⌁ Elliott Wave view
Gold appears to be building a bullish 5-wave structure.
Wave 1 started the recovery from the lower base.
Wave 2 corrected and held above support.
Wave 3 pushed strongly into resistance.
Wave 4 may now pull back towards 4,440–4,460.
If this zone holds, wave 5 may extend towards 4,640–4,660.
▸ Trading scenario
Preferred scenario: wait for gold to correct into the buy zone and show bullish confirmation.
Entry zone: 4,440–4,460
Stop loss: below 4,430 or below the confirmed wave 4 low
Take profit 1: 4,515–4,525
Take profit 2: 4,580
Take profit 3: 4,640–4,660
Alternative scenario: if gold breaks below 4,430 with strong bearish pressure, the wave 5 bullish setup becomes weaker and price may need to rebuild support first.
⌁ Kelly’s view
For Kelly, the main structure remains bullish, but buying after a pullback is cleaner than chasing near resistance.
If 4,440–4,460 holds, gold may continue wave 5 towards the Fibonacci target above.
Share your view below. Long 
XAUUSD – ABC Rebound Before Selling RotationGold is holding a short-term recovery structure after bouncing from the 4,320 area, but this move still looks more like an A-B-C rebound than a full buying reversal. From Kelly’s view, price may continue pushing higher first into resistance, then face renewed selling pressure once the corrective structure is completed.
⟡ Market structure
The chart shows a completed selloff into the 4,320–4,330 region, followed by a rebound forming an A-B-C pattern. Wave A has already pushed price back above 4,350, while wave B created a shallow pullback. If buyers stay in control in the short term, wave C can extend toward the resistance band around 4,370 first, and possibly into the higher sell zone near 4,392–4,398.
That upper zone is important because it aligns with the projected end of the corrective wave and the 1.618 extension area marked on the chart. If price reaches that zone and loses momentum, the market may rotate lower again.
➤ Key levels
◌ Current price area: 4,360
◌ Near resistance: 4,368–4,372
◌ Main sell zone: 4,392–4,398
◌ Short-term support: 4,345–4,350
◌ Lower downside target: 4,330–4,333
⌁ Trading scenario
Kelly’s preferred path is a bullish push first, with price trying to complete wave C into 4,370 and then 4,392–4,398. If gold reacts bearishly from that zone, sellers may take control again and drive price back toward 4,345, then deeper into 4,330.
◌ Invalidation
If price breaks cleanly above 4,398 and holds, the bearish follow-up scenario becomes weaker and gold may extend higher.
▸ Do you think gold will complete wave C into the sell zone first, or reject earlier from 4,370? Short 
XAUUSD: Intraday Bearish SetupGold is showing short-term bearish pressure after failing to hold the previous bullish recovery structure. From Kelly’s view, the chart suggests that XAUUSD may be forming an intraday Elliott bearish sequence, with sellers still active below the 4,390–4,400 resistance area.
The key idea is simple: gold may rebound first, but the main intraday structure favors downside continuation while price stays below the sell zone.
⟡ Market structure
The chart shows gold completed a short-term bullish move near the 4,430–4,440 area, then price rejected and broke below the rising trendline. This is an important shift because buyers lost control after wave 5 finished.
Current price is around 4,388, directly below the Sell zone wave 3. If gold retests this area and fails to break higher, the next bearish move may continue towards the strong support around 4,377 first.
Below 4,377, the next key reaction area is the Buy scalping zone around 4,358–4,365. If selling pressure remains strong, gold may continue deeper towards the liquidity zone near 4,320–4,325.
➤ Key levels
◌ 4,390–4,400: Sell zone wave 3 and main resistance
◌ 4,388: current price reaction area
◌ 4,377: strong support and first bearish checkpoint
◌ 4,358–4,365: buy scalping / short-term reaction zone
◌ 4,320–4,325: liquidity target and possible wave 5 completion
◌ Above 4,405: area where the bearish setup starts to weaken
⌁ Elliott Wave view
From an Elliott Wave perspective, gold may have completed a bullish wave 5 near the upper area, then started a new bearish sequence.
Wave 1 formed after the first rejection from the high.
Wave 2 may be the current rebound into the 4,390–4,400 sell zone.
If sellers defend this zone, wave 3 may push price lower towards 4,358–4,365.
Wave 4 may create a small rebound from support.
Wave 5 may then continue towards the liquidity target around 4,320–4,325.
This is why Kelly is watching the sell zone carefully. The market does not need to drop immediately, but if price rejects below resistance, the bearish intraday structure remains valid.
▸ Trading scenario
Preferred scenario: wait for gold to retest the sell zone and show bearish confirmation.
Sell zone: 4,390–4,400 if rejection appears
Stop loss: above the confirmed rejection high or above 4,405
Take profit 1: 4,377
Take profit 2: 4,358–4,365
Take profit 3: 4,320–4,325
Alternative scenario: if gold breaks above 4,405 and holds with strong bullish candles, the intraday bearish setup weakens. In that case, price may return to a larger recovery structure before the next sell setup becomes clear.
⌁ Kelly’s view
For Kelly, the intraday structure is leaning bearish after price lost the rising trendline and rejected from the upper wave area.
The cleanest plan is to wait for a reaction around 4,390–4,400. If sellers defend this zone, gold may continue the next Elliott wave lower towards 4,358 and 4,320.
Gold is under intraday bearish pressure.
If the sell zone holds, wave 5 may continue lower.
Share your view below. Short 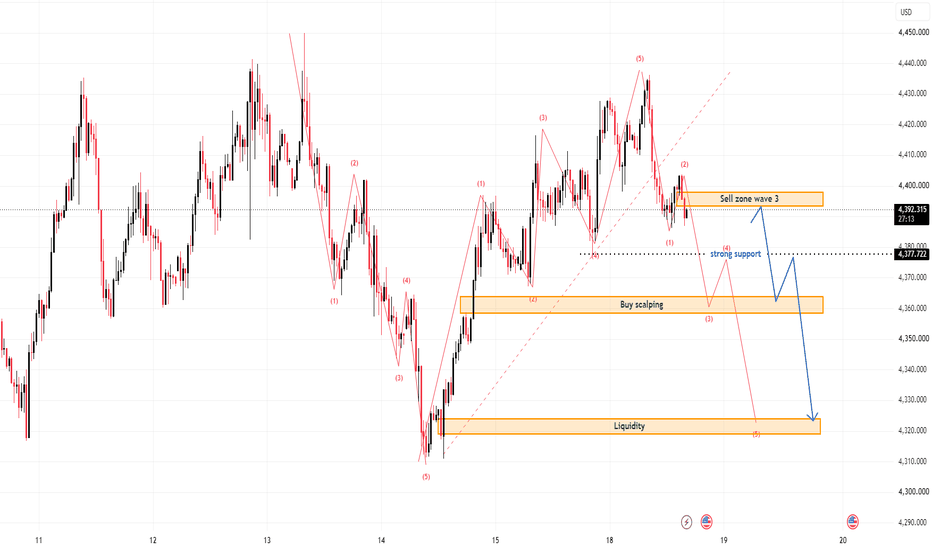
XAUUSD: Bullish Elliott Wave Target 4,500Gold is still holding a constructive bullish structure after reacting from the lower support area. From Kelly’s view, the chart suggests that XAUUSD may be preparing for the next bullish Elliott wave, as long as price continues to hold above the current buy zone.
The key idea is simple: gold may still move with short-term corrections, but the main scenario remains bullish while buyers defend the 4,390–4,405 area.
⟡ Market structure
The chart shows gold recovered strongly from the 4,300 area and built a new bullish sequence. After forming a higher low, price pushed back above 4,400 and is now consolidating near the Buy zone.
Current price is around 4,402. This is an important reaction area because it sits close to the short-term support zone and below the nearest breakout level around 4,416.
If gold holds above the Buy zone and breaks 4,416 with strength, the next upside target is the resistance area around 4,435–4,445. A clean breakout above that resistance may open the path towards the Elliott wave completion zone around 4,500–4,510.
➤ Key levels
◌ 4,390–4,405: Buy zone and short-term support
◌ 4,402: current price reaction area
◌ 4,416: bullish confirmation checkpoint
◌ 4,435–4,445: main resistance zone
◌ 4,500–4,510: End Elliott wave / Fibonacci 1.618 target
◌ Below 4,380: area where the bullish setup starts to weaken
⌁ Elliott Wave view
From an Elliott Wave perspective, gold may be forming a bullish 5-wave structure after the previous correction ended near 4,300.
Wave 1 created the first recovery move from the lower base.
Wave 2 corrected but held above the main low.
Wave 3 may develop if price breaks above 4,416 and pushes into 4,435–4,445.
Wave 4 may later form as a controlled pullback near resistance.
Wave 5 may then continue towards 4,500–4,510, where the chart marks the Elliott wave completion zone.
This means Kelly is still watching for bullish continuation, but confirmation is important. The stronger setup is not to chase price randomly, but to wait for the Buy zone to hold and for price to confirm above the nearest resistance.
▸ Trading scenario
Preferred scenario: wait for gold to hold the Buy zone and show bullish confirmation.
Entry zone: 4,390–4,405 if bullish confirmation appears
Stop loss: below the confirmed pullback low or below 4,380
Take profit 1: 4,416
Take profit 2: 4,435–4,445
Take profit 3: 4,500–4,510
Alternative scenario: if gold breaks below 4,380 with strong bearish pressure, the bullish Elliott setup weakens. In that case, price may need to retest the lower support area before building a new bullish structure.
⌁ Kelly’s view
For Kelly, the main structure still favours the bullish scenario. Gold is holding above the buy zone, the recovery structure is improving, and the next Elliott wave may continue if buyers protect support.
The key zone to watch is 4,390–4,405. If this area holds, gold may continue higher towards 4,435 first, then the 4,500 Elliott target.
Gold is building bullish momentum.
If the buy zone holds, wave 5 may extend higher.
Share your view below. Long 
XAUUSD Weekly: ABC pullback to Fib zoneGold is still holding a strong recovery structure after the aggressive bullish move from the lower base. However, from Kelly’s view, the market is now trading near a short-term selling reaction zone, which means the next weekly move may not be a straight continuation higher.
The key idea is simple: gold may correct through an ABC structure first, then look for a new bullish reaction around the Fibonacci buy zone.
⟡ Market structure
The chart shows gold created a powerful upside move from the 4,000 area and reached the 4,430–4,450 region before slowing down. After such a strong move, the current reaction near 4,376 suggests buyers are no longer pushing with the same momentum.
Price is now sitting close to the selling wave C zone around 4,380–4,400. This is an important area because if gold fails to break above it, sellers may create a corrective move lower.
The first support to watch is 4,317. If this level breaks, gold may continue the ABC correction towards the 4,220–4,240 area, where the chart marks the end of wave ABC / buy zone.
➤ Key levels
◌ 4,380–4,400: selling wave C and short-term resistance zone
◌ 4,376: current price reaction area
◌ 4,317: key support and first bearish checkpoint
◌ 4,220–4,240: end of wave ABC / Fibonacci buy zone
◌ 4,440–4,460: recent high resistance area
◌ Below 4,220: area where the bullish recovery setup weakens
⌁ Elliott Wave view
From an Elliott Wave perspective, gold appears to have completed a strong bullish impulse from the lower structure. After that, the current movement may develop into an ABC correction.
Wave A may start from the current selling reaction area.
Wave B may create a short rebound around 4,317.
Wave C may continue lower towards 4,220–4,240, where the Fibonacci buy zone is located.
If wave C completes around this zone and buyers defend it, gold may prepare for another bullish recovery phase later in the week.
This means Kelly will not chase buy positions near the current high. The better setup is to wait for the correction to finish and watch the reaction around the Fibonacci support zone.
▸ Trading scenario
Preferred scenario: wait for gold to reject from the selling wave C zone and correct lower into support.
Selling reaction zone: 4,380–4,400 if bearish confirmation appears
Stop loss: above the confirmed rejection high or above 4,420
Take profit 1: 4,317
Take profit 2: 4,220–4,240
Buy scenario after correction: wait for price to reach the end of wave ABC / buy zone and show bullish confirmation.
Buy zone: 4,220–4,240 if bullish confirmation appears
Stop loss: below the confirmed wave C low
Take profit 1: 4,317
Take profit 2: 4,380–4,400
Take profit 3: 4,440–4,460 if bullish momentum returns
Alternative scenario: if gold breaks above 4,400 and holds strongly, the ABC correction may be delayed. In that case, price may retest the recent high zone first before any deeper pullback appears.
⌁ Kelly’s view
For Kelly, the weekly structure is still bullish in the bigger picture, but the short-term setup is showing correction risk. Gold is near resistance after a strong rally, so patience is important.
The cleaner plan is to wait for the ABC pullback. If gold reaches 4,220–4,240 and buyers defend the zone, the next bullish recovery may become much stronger.
Gold may correct first.
If the Fibonacci buy zone holds, the next recovery wave can continue.
Share your view below. Short 
Elliottt Wave Principle : Understanding ZIGZAGChartTheWave IPO Watch (IV) : Understanding Zigzag – Groww
"An initial 5-wave downward movement is not the end of the correction, it is only a part of the larger one".
Under the Elliott Wave Principle, after a 5-wave impulse movement, a stock will undergo a corrective movement, generally labelled A-B-C. There are three primary forms of correction:
(1) Zigzag, (2) Flat and (3) Triangle. These primary corrective structures can also combine to form more complex corrections, known as Double Threes (WXY) and Triple Threes (WXYXZ), which we have covered in earlier educational posts. Today, let us understand a basic Zigzag correction using the example of Groww.
Groww – From Impulse to Correction
After its debut on the stock exchange on 12 November 2025, Groww completed a five-wave impulse on 29 April 2026. Interestingly, the primary impulse itself provides another practical example of the Wave 1 Extension variation discussed in our recent educational post:
Wave 1 was an extended wave.
Wave 3 was also extended.
Wave 3 terminated at approximately 1× the length of Wave 1.
Wave 5 also terminated at approximately 1× the length of Wave 1.
The stock then entered a corrective phase from 29 April 2026. This gives us an opportunity to understand one of the three primary corrective structures — the Zigzag.
What is a Zigzag?
A Zigzag is a 5-3-5 sequence, labelled A-B-C.
Wave A develops as a 5-wave impulse.
Wave B develops as a 3-wave corrective structure.
Wave C develops as another 5-wave impulse. This is the reason why an initial 5-wave downward movement is never end of the correction, but only part of the larger one.
Zigzags generally produce a deep correction . Wave A and Wave B can be different in size, although they may also be approximately equal.
Key Takeaway
The most important structural principle in a Zigzag is: Wave C must make a lower low than Wave A, or at least an equal low. It cannot terminate above the end of Wave A.
This principle helps an analyst determine the minimum level Wave C must reach before the Zigzag can be considered complete.
In the case of Groww, Wave A ended around ₹180. Therefore, Wave C must reach ₹180 or below before the correction can be considered complete.
What does the internal structure tell us?
Interestingly, Wave C itself is developing as a Wave 1 Extension . Based on the Wave 1 Extension behaviour discussed in our earlier educational post, Wave C could potentially terminate around:
61.8% TBFE – approximately ₹179
78.6% TBFE – approximately ₹174
Therefore, ₹180 is an important structural level to watch, while the ₹174 area represents a possible deeper Fibonacci projection if the extension continues.
ChartTheWave Learning
This example demonstrates how Elliott Wave analysis can be built progressively:
Completed impulse → Correction begins → Identify the corrective structure → Confirm Zigzag → Analyse Wave C → Apply Fibonacci relationships.
And once again, a concept we studied earlier—the Wave 1 Extension variation—appears naturally within the new structure.
Educational purpose only. This is not a buy or sell recommendation.  Education
XAUUSD: ABC Recovery Strengthens Above 4,330Gold is showing a corrective recovery after the previous bearish wave completed near the lower area. From Kelly’s view, the current chart suggests that XAUUSD may be forming an ABC rebound structure, with buyers trying to defend the 4,330–4,340 zone before pushing price higher.
The key idea is simple: gold is recovering, but this still looks like an ABC correction, not a full bullish reversal yet.
⟡ Market structure
The chart shows gold completed a sharp bearish 5-wave decline from the upper area, then reacted strongly from around 4,310. After that, price started to build a recovery structure and is now trading around 4,350.
The nearest important support is the Buy wave B zone around 4,330–4,340. If gold pulls back into this area and buyers continue to defend it, the market may form wave B and prepare for wave C higher.
The next resistance is around 4,360–4,370, marked as the sell scalping area. If price breaks above this zone with strength, the recovery may continue towards 4,395–4,405, where the chart marks the possible End wave ABC area.
➤ Key levels
◌ 4,330–4,340: Buy wave B zone and key support
◌ 4,350: current price reaction area
◌ 4,360–4,370: sell scalping / short-term resistance
◌ 4,395–4,405: End wave ABC target zone
◌ 4,310: recent wave 5 low and structure protection
◌ Below 4,310: area where the recovery setup weakens
⌁ Elliott Wave view
From an Elliott Wave perspective, gold appears to have completed a bearish 5-wave sequence before starting the current recovery.
Wave A is forming from the 4,310 low into the current reaction area. Wave B may pull back into the 4,330–4,340 buy zone. If wave B holds, wave C may continue higher towards 4,360–4,370 first, then 4,395–4,405.
This is why Kelly is watching the current recovery as an ABC correction. The move can still rise, but buyers need to protect the wave B support before the next bullish leg becomes cleaner.
▸ Trading scenario
Preferred scenario: wait for gold to pull back into the Buy wave B zone and show bullish confirmation.
Entry zone: 4,330–4,340 if bullish confirmation appears Stop loss: below the confirmed wave B low or below 4,310 Take profit 1: 4,360–4,370 Take profit 2: 4,395–4,405 Take profit 3: higher only if price breaks the ABC target with strong momentum
Alternative scenario: if gold breaks below 4,310 with strong bearish pressure, the ABC recovery setup weakens. In that case, price may return to a deeper bearish continuation before building a new support base.
⌁ Kelly’s view
For Kelly, gold is currently in a recovery phase after a bearish wave. The short-term structure supports an ABC rebound, but the clean setup is still to wait for price to confirm support around 4,330–4,340.
Gold may continue its corrective rise. If Buy wave B holds, wave C may target the 4,395–4,405 area.
Share your view below. Long 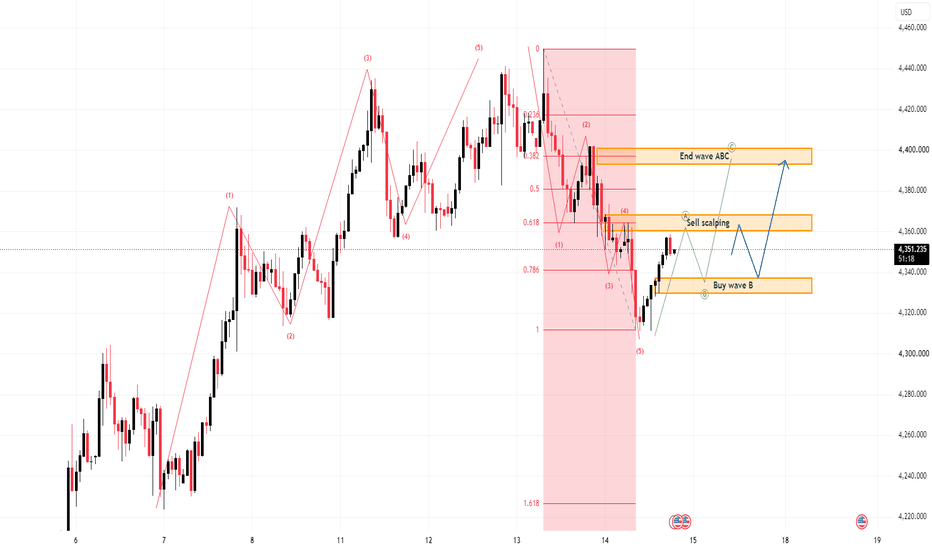
NIFTY – Wave 4 Triangle | D-Wave Liquidity Sweep & Wave ENIFTY is currently in Wave 4, where a potential triangle formation appears to be developing.
In Elliott Wave theory, a triangle consists of five waves:
A → B → C → D → E
At present, my interpretation is that Wave D is in progress.
The key level I am watching is the previous high at 26,373.20.
If price breaks above 26,373.20, takes the liquidity resting above this high, and subsequently shows rejection/weakness, I will consider this as a potential buy-side liquidity sweep completing Wave D.
Following the completion of Wave D, the next expected phase would be Wave E.
Based on the current structure, I am watching the 23,070.15 area as an important potential Wave-E zone.
If the A-B-C-D-E triangle structure completes as anticipated, the larger structure could then transition toward Wave 5.
Key Levels
🔴 26,373.20 — Previous high / Buy-side liquidity
🟡 23,070.15 — Potential Wave-E zone
🔵 After A-B-C-D-E completion → Potential Wave 5
My approach is based on:
Elliott Wave + Liquidity Sweep + Key Levels + Price Confirmation
I am not trying to predict every move. I am interested in how price reacts when it reaches important liquidity and structural levels.
Level → Liquidity → Confirmation
Disclosure
I am not a SEBI-registered Investment Adviser or Research Analyst. This post represents my personal technical/chart analysis for educational and informational purposes only and should not be considered personalized investment advice, a recommendation to buy or sell securities, or a guarantee of future price movement. Please conduct your own research and make independent decisions according to your risk profile.
#NIFTY #ElliottWave #LiquiditySweep #TechnicalAnalysis #MarketStructure  Long
Long
Nilkamal: Will Alternation Lead to the Next Trend Expansion?Nilkamal has been one of the stronger trending stocks over the past few weeks, with price advancing in a well-defined impulsive structure while respecting its rising trend channel.
One aspect of this chart that caught my attention is the contrast between Wave (ii) and the current Wave (iv).
Wave (ii) was relatively sideways and time-consuming, allowing the market to consolidate before the trend resumed. In contrast, the current Wave (iv) has been a sharp price correction, retracing quickly after the strong momentum seen in Wave (iii). This is a good illustration of Guideline of Alternation , which suggests consecutive corrective waves often differ in both form and character.
From a price structure perspective, the stock is now approaching an important confluence of support:
1. 38.2% Fibonacci retracement of the previous impulse
2. Upper/Middle boundary of the short-term rising channel
This is the zone where I would expect buyers to defend the prevailing trend if the bullish structure remains intact.
The strongest participation occurred during the impulsive advance into Wave (iii), while the current pullback has not shown the same level of aggressive selling. In healthy trends, corrections often develop with relatively lighter participation compared to impulsive advances.
If price stabilises around the highlighted support zone and regains momentum, the broader trend structure could remain constructive. On the other hand, a decisive breakdown below this confluence would weaken the current wave count and require a fresh assessment.
The objective is not to predict every move but to identify areas where market structure, trend, and risk are aligned.
Educational analysis only. Not investment advice.  Long
Long
XAUUSD: Bearish Elliott Setup Below 4,410Gold is showing signs of short-term weakness after failing to extend cleanly above the upper reaction area. From Kelly’s view, the current chart suggests that XAUUSD may be forming a bearish Elliott structure, with price now preparing for a possible continuation lower if the Sell wave 3 zone continues to hold.
The key idea is simple: gold may still rebound slightly, but the structure favours downside continuation while price remains below resistance.
⟡ Market structure
The chart shows gold reacted strongly from the previous bullish move, but buyers are now losing momentum near the 4,380–4,400 area. Price is currently trading around 4,380, directly under the marked Sell wave 3 zone.
This area is important because it may act as the next bearish reaction point. If gold retests 4,395–4,410 and sellers defend that zone, the market may continue lower towards the 4,330–4,345 buy zone first.
If bearish pressure expands, the next deeper target is around 4,270–4,285, where the chart marks the possible End wave 5 area.
➤ Key levels
◌ 4,395–4,410: Sell wave 3 zone and main resistance
◌ 4,380: current price reaction area
◌ 4,360–4,365: short-term support / first bearish checkpoint
◌ 4,330–4,345: buy zone and wave 3 target area
◌ 4,270–4,285: End wave 5 target zone
◌ Above 4,420: area where the bearish setup starts to weaken
⌁ Elliott Wave view
From an Elliott Wave perspective, gold may be starting a new bearish 5-wave sequence after the recent bullish recovery slowed down.
Wave 1 may be forming from the current rejection area.
Wave 2 may create a small rebound back into the 4,395–4,410 sell zone.
Wave 3 could then push price lower towards the 4,330–4,345 buy zone.
Wave 4 may create a short corrective rebound from that support.
Wave 5 may continue towards 4,270–4,285 if sellers keep control.
This is why Kelly is not treating the current rebound as a strong bullish continuation yet. The market is still below a key resistance zone, and the Elliott structure is leaning bearish.
▸ Trading scenario
Preferred scenario: wait for gold to retest the Sell wave 3 zone and show bearish confirmation.
Sell zone: 4,395–4,410 if rejection appears
Stop loss: above the confirmed rejection high or above 4,420
Take profit 1: 4,360
Take profit 2: 4,330–4,345
Take profit 3: 4,270–4,285
Alternative scenario: if gold breaks above 4,420 and holds strongly, the bearish Elliott setup weakens. In that case, price may continue a larger bullish recovery before a new sell structure becomes clear.
⌁ Kelly’s view
For Kelly, gold is now in a bearish reaction structure. The current price is below the main sell zone, and the next clean setup is to wait for rejection before following the downside wave.
Gold may still bounce first.
But if 4,395–4,410 holds as resistance, the next Elliott move may continue lower towards 4,330 and 4,280.
Share your view below. Short 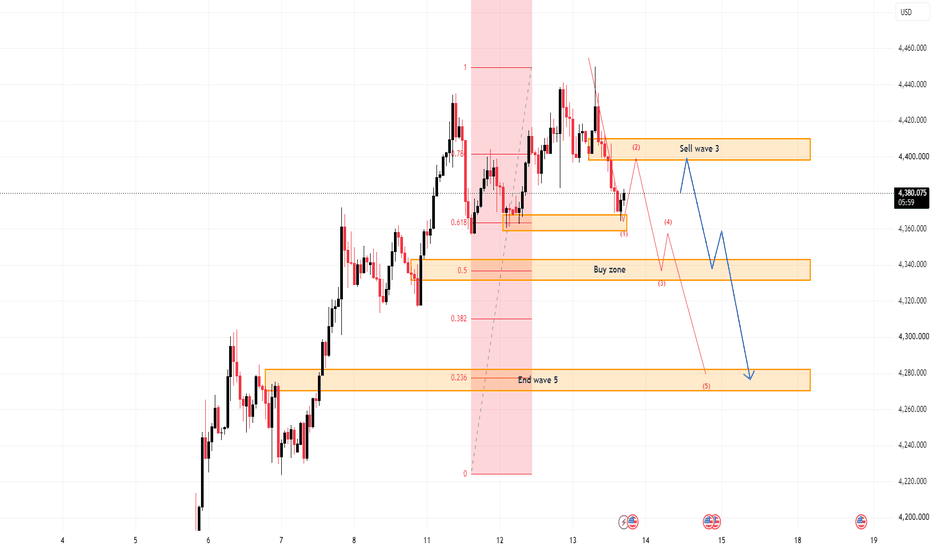
XAUUSD: Bullish trend above 4,280 remains.Gold is still holding a strong bullish structure after the sharp recovery from the lower accumulation base. From Kelly’s view, the current chart suggests that XAUUSD may be moving through a short-term ABC correction before continuing higher towards the Fibonacci resistance target.
The key idea is simple: gold remains bullish overall, but price may need a healthy pullback before the next upside wave becomes cleaner.
⟡ Market structure
The chart shows gold made a strong impulsive move from the lower area and reached the 4,390–4,430 region. After that, price started to slow down near the Sell wave B zone, which is normal after a strong rally.
Current price is trading around 4,394. This area is close to short-term resistance, so Kelly would not chase buys directly here. A controlled correction into support would create a better setup.
The first reaction zone is around 4,340–4,360, marked as the Buy scalping area. If the correction becomes deeper, the stronger support is around 4,270–4,290, where the chart marks the Fibonacci buy zone and possible end of wave C.
➤ Key levels
◌ 4,390–4,410: Sell wave B / current resistance reaction area
◌ 4,340–4,360: Buy scalping zone
◌ 4,270–4,290: Fibonacci buy zone / possible end wave C
◌ 4,520–4,540: Fibonacci 2.618 target resistance
◌ Below 4,270: area where the bullish setup starts to weaken
◌ Above 4,410: stronger bullish continuation confirmation
⌁ Elliott Wave view
From an Elliott Wave perspective, gold appears to have completed a strong bullish impulse and may now be forming a corrective ABC structure.
Wave A may be the first pullback from the recent high.
Wave B is reacting near the 4,390–4,410 resistance area.
Wave C may still pull price lower towards 4,340–4,360 or deeper into 4,270–4,290.
If wave C ends inside the Fibonacci buy zone and buyers defend it, gold may continue into the next bullish wave towards the 4,520–4,540 Fibonacci resistance target.
▸ Trading scenario
Preferred scenario: wait for gold to correct into support and show bullish confirmation.
Entry zone 1: 4,340–4,360 if bullish reaction appears
Entry zone 2: 4,270–4,290 if deeper ABC correction happens
Stop loss: below the confirmed wave C low or below 4,250
Take profit 1: 4,410
Take profit 2: 4,450
Take profit 3: 4,520–4,540
Alternative scenario: if gold breaks below 4,270 with strong bearish pressure, the bullish ABC setup weakens. In that case, price may need more time to rebuild support before the next upward continuation.
⌁ Kelly’s view
For Kelly, the main trend is still bullish, but the market is now near a resistance zone after a strong rally. The better plan is patience.
If gold corrects into 4,340–4,360 or 4,270–4,290 and buyers defend the zone, the next bullish wave may continue towards the Fibonacci 2.618 target.
Gold remains in a bullish structure.
A clean ABC pullback may prepare the next move higher.
Share your view below. Long 
 Long
Long
XAUUSD: Uptrend Continues After BreakoutGold is showing a strong bullish continuation after breaking away from the previous downtrend structure. From Kelly’s view, the chart suggests that XAUUSD has already formed a clean 5-wave recovery pattern on the H4 timeframe, and the market may continue higher if the next correction stays controlled.
The key idea is simple: gold is bullish, but after a strong rally, a short-term ABC pullback may create a cleaner continuation setup.
⟡ Market structure
The chart shows gold broke above the downtrend line and pushed strongly into the 4,346 area. This breakout is important because it confirms that sellers are no longer controlling the short-term structure.
Price is now trading near the end point of the bullish wave structure around 4,358. This area may create short-term hesitation, so a correction from here would be normal.
The main support to watch is 4,235. This is marked as the short-term ABC correction zone. If gold pulls back into this area and buyers defend it, the next bullish wave may continue towards the weekly liquidity resistance around 4,455.
➤ Key levels
◌ 4,346: current price reaction area
◌ 4,358: end point of current bullish wave structure
◌ 4,235: short-term ABC correction / main buy reaction zone
◌ 4,162: contested price acceptance zone
◌ 4,455: weekly resistance and liquidity target
◌ Below 4,162: area where the bullish setup starts to weaken
⌁ Elliott Wave view
From an Elliott Wave perspective, gold appears to have completed a strong bullish 5-wave move after breaking the old downtrend.
Wave 1 started the first recovery from the lower base.
Wave 2 created a controlled correction.
Wave 3 pushed strongly higher and confirmed bullish momentum.
Wave 4 held structure before the next expansion.
Wave 5 is now reaching the 4,346–4,358 area.
After wave 5, an ABC correction is normal. If wave C finishes around 4,235 and buyers protect this area, gold may prepare for another bullish continuation towards 4,455.
▸ Trading scenario
Preferred scenario: wait for gold to correct into support and show bullish confirmation.
Entry zone: 4,235–4,250 if bullish confirmation appears
Stop loss: below the confirmed ABC low or below 4,162
Take profit 1: 4,346–4,358
Take profit 2: 4,400
Take profit 3: 4,455
Alternative scenario: if gold breaks above 4,358 without a deep pullback and holds strongly, price may continue directly towards 4,455. In that case, waiting for a retest of 4,358 as support would be the cleaner continuation setup.
⌁ Kelly’s view
For Kelly, the main trend is still bullish after the downtrend breakout. Gold has already shown strong buying pressure, but the market is now near an important reaction zone.
The best plan is patience. If gold corrects into 4,235 and buyers defend the zone, the next bullish move may continue towards the weekly liquidity target.
Gold remains in a bullish continuation structure.
If the ABC correction holds, the next upside target is 4,455. Long 
 Long
Long
Pine Labs Ltd. – Has the Corrective Phase Come to an End?ChartTheWave IPO Watch (III)
Pine Labs Limited is a leading fintech company providing point-of-sale hardware, software and digital payment solutions across India and several Asian markets.
Following its listing on 14 November 2025, the stock entered a prolonged corrective phase rather than forming an immediate impulse wave. Let's analyse its current structure through the Elliott Wave Principle.
The Larger Correction
The entire decline unfolded as a Zigzag (5-3-5), one of the three primary corrective structures under the Elliott Wave Principle.
Wave A
Simple. Developed as a Wave 1 Extension, with the impulse terminating near 78.6% of the first candle's projected length using the Trend-Based Fibonacci Extension (TBFE). The internal five-wave structure is clearly visible.
Wave B
Corrected as a simple three-wave (ABC) structure.
Wave C
Wave C developed into an elongated impulse, consisting of the following structure:
Wave 1: Advanced to approximately 1.618× the first candle.
Wave 2: Retraced close to 78.6% of Wave 1.
Wave 3: Extended significantly, reaching approximately 2.414× the length of Wave 1 while developing its own five internal sub-waves.
Wave 4: The initial rally exceeded the price territory of Wave 1 and therefore could not be labelled as Wave 4 under the impulse rules. The subsequent swing high provided the valid Wave 4 count.
Wave 5: Completed at approximately 78.6% of the combined length of Waves 1–3, completing the Zigzag correction.
What Is Happening Now?
Following the completion of the larger correction, the stock began developing a new impulse wave. The initial advance encountered resistance near the 50% TBFE level and subsequently corrected as a Flat structure. Based on the current wave count, this Flat correction appears to have completed on 31 July 2026, with the stock beginning to form higher highs and higher lows, suggesting that the next impulse may already be underway.
ChartTheWave View
If this wave interpretation remains valid, the recent completion of the Flat correction could present an opportunity to participate in the developing impulse. 135 is key validation level. Maintain a stop loss below 135.
IPO Watch Learning
One of the biggest mistakes investors make after an IPO is assuming every decline is a buying opportunity. Under the Elliott Wave Principle, patiently waiting for a completed corrective structure often provides a significantly better risk-reward profile than buying into an ongoing correction.
 Long
Long
XAUUSD: Bullish Wave 5 targets upward.Gold is showing a clear bullish recovery after breaking away from the lower accumulation base. From Kelly’s view, the current structure suggests that XAUUSD is no longer only moving sideways; buyers are trying to build a larger Elliott Wave continuation towards the upper Fibonacci target.
The key idea is simple: gold remains bullish, but after a strong push, the better setup is to wait for a controlled pullback before following the next upside wave.
⟡ Market structure
The chart shows gold previously traded under a strong downtrend structure, but the latest recovery has changed the short-term rhythm. Price has pushed above the lower base and is now reacting around 4,341, close to the first important resistance area.
This area is important because price may pause here after a strong impulse move. A pullback from this zone would not automatically break the bullish view. Instead, it may form wave 4 before the market prepares for another upward move.
The main buy zone to watch is 4,180–4,198. If gold corrects into this area and buyers defend it, the next bullish leg may continue towards the higher Fibonacci target zone around 4,520–4,560, where the chart marks the possible end of wave 5.
➤ Key levels
◌ 4,180–4,198: main buy zone and possible wave 4 support
◌ 4,341: current price reaction area
◌ 4,380–4,400: near resistance and breakout checkpoint
◌ 4,520–4,560: target end wave 5 / Fibonacci extension zone
◌ Below 4,180: area where the bullish setup starts to weaken
◌ Below 4,100: deeper invalidation area for the current wave count
⌁ Elliott Wave view
From an Elliott Wave perspective, gold appears to be forming a bullish 5-wave structure after the previous bearish cycle slowed down near the lower base.
Wave 1 created the first strong recovery move.
Wave 2 corrected but held above the structure base.
Wave 3 is now pushing price into the 4,340 resistance region.
Wave 4 may form as a healthy correction back into 4,180–4,198.
If this buy zone holds, wave 5 may continue towards the 4,520–4,560 Fibonacci target area.
This is why Kelly would not chase gold directly after the strong rise. The structure is bullish, but the cleaner entry usually comes after the market retests support and confirms buyers are still active.
▸ Trading scenario
Preferred scenario: wait for gold to correct into the buy zone and show bullish confirmation.
Entry zone: 4,180–4,198 if bullish confirmation appears
Stop loss: below the confirmed wave 4 low or below 4,150
Take profit 1: 4,341–4,380
Take profit 2: 4,400
Take profit 3: 4,520–4,560
Alternative scenario: if gold breaks below 4,180 with strong bearish pressure, the bullish wave 5 setup becomes weaker. In that case, price may need to rebuild a deeper support base before the next bullish continuation becomes reliable.
⌁ Kelly’s view
For Kelly, the main structure is still bullish. Gold has already shown strong buying pressure, and the current move looks like part of a larger Elliott Wave recovery.
The cleanest plan is to wait for the pullback. If 4,180–4,198 holds, gold may continue the next bullish wave towards the upper Fibonacci target.
Gold is in a bullish continuation phase.
If the buy zone holds, wave 5 may extend higher.
Share your view below. Long 
XAUUSD: Bullish Continuation Above 4,285Gold is still showing strong bullish momentum after breaking away from the previous consolidation structure. From Kelly’s view, the market is now building a clearer Elliott Wave recovery, and the current setup suggests that price may continue higher if the pullback holds above the 4,285–4,300 buy zone.
The key idea is simple: gold is bullish, but the better plan is to wait for a healthy correction before following the next upside wave.
Market structure
The chart shows gold has made a strong recovery from the lower base and is now trading around 4,315. The latest impulse pushed price into a higher structure, confirming that buyers are still active.
The nearest support is the 4,285–4,300 buy zone. This area is important because it may become the base for the next bullish continuation. If price pulls back into this zone and buyers defend it, gold may continue towards the 4,327 and 4,380 resistance levels.
The next major resistance sits around 4,409–4,421. If gold breaks above this zone with strong momentum, the larger Elliott Wave target near 4,640–4,670 may become the next area to watch.
Key levels
4,285–4,300: main buy zone and wave support
4,315: current price reaction area
4,327: first resistance checkpoint
4,380: key resistance zone
4,409–4,421: major sell zone / breakout decision area
4,640–4,670: possible Elliott wave 5 completion zone
Below 4,240: area where the bullish setup starts to weaken
Elliott Wave view
From an Elliott Wave perspective, gold appears to be developing a bullish continuation sequence after a strong recovery phase.
Wave 1 created the first push from the lower structure.
Wave 2 corrected but held above the base.
Wave 3 may now be developing towards the 4,380–4,421 resistance area.
Wave 4 may later create a short pullback around resistance.
If momentum remains strong, wave 5 may extend towards the upper Fibonacci target near 4,640–4,670.
This is why Kelly is not looking to sell too early. The structure still favors the buyers unless price loses the key support zone.
Trading scenario
Preferred scenario: wait for gold to pull back into the buy zone and show bullish confirmation.
Entry zone: 4,285–4,300 if bullish confirmation appears
Stop loss: below the confirmed pullback low or below 4,240
Take profit 1: 4,327
Take profit 2: 4,380
Take profit 3: 4,409–4,421
Take profit 4: 4,640–4,670 if wave 5 extends strongly
Alternative scenario: if gold breaks below 4,240 with strong bearish pressure, the bullish Elliott setup weakens. In that case, price may need to build a new support base before the next continuation becomes reliable.
Kelly’s view
For Kelly, gold remains in a bullish continuation structure. The market has already shown strong buying pressure, but after such a sharp move, a pullback into support would make the next buy setup cleaner.
The main zone to watch is 4,285–4,300. If buyers protect this area, gold may continue higher towards 4,380 first, then the larger resistance near 4,409–4,421.
Gold is still showing bullish strength.
If the buy zone holds, the next Elliott wave may continue higher.
Share your view below. Long 
 Long
Long
Elliott Wave Principle - Wave 1 extension variation ChartTheWave Learning Series
A Practical Variation of Wave 1 Extension
This post is a continuation of my earlier lesson on Wave 1 Extensions published on 30 July 2026. In that lesson, we learnt that when Wave 1 is the dominant extended wave, the remaining motive waves often terminate within approximately 78.6% of the length of Wave 1.
During my study of hundreds of market charts, however, I have repeatedly observed another variation that is worth recognising. While a single extended motive wave is the most common occurrence, there are occasions where both Wave 1 and Wave 3 develop as extended waves. In such cases, the overall impulse behaves differently from the typical Wave 1 Extension. Let us understand what happens in such cases as a "variation of Wave 1 extension" .
Why Wave 3 and not Wave 5?
Under the Elliott Wave Principle, Wave 3 can never be the shortest of the three motive waves . Therefore, when a second extension develops after an already extended Wave 1, it is generally Wave 3 that extends, while Wave 5 usually remains comparatively short.
Observation CTW-OBS-001
Primary Extension with Secondary Extension
Through repeated chart studies, I have observed that when both Wave 1 and Wave 3 exhibit extended characteristics, Wave 3 terminate with a maximum length of around 1.272–1.414× the length of Wave 1 (as against 78.6%) . Once this level is achieved, Wave 5 often completes quickly without developing into another significant extension.
This is a practical market observation based on repeated chart analysis and is shared to encourage further study and discussion among Elliott Wave practitioners.
Case Study – Max Healthcare Institute
Following the completion of a larger Zigzag correction on 7 April 2026, Max Healthcare Institute began a fresh impulse wave.
Wave 1
Developed as an extended impulse with five clear internal subdivisions. Sub-wave (i) itself was extended.
Wave 3
Also developed as an extended impulse with its own five internal subdivisions. Sub-wave (i) was again the dominant internal extension. Instead of terminating near 78.6% of Wave 1, as seen in the more common Wave 1 Extension, Wave 3 extended slightly beyond the length of Wave 1 (i.e. > 1x of Wave 1) .
Wave 5
Completed without developing into another significant extension, bringing the impulse to completion within the observed range.
Key Learning
Markets do not always exhibit textbook behaviour. While the rules of the Elliott Wave Principle remain unchanged, market structures often display recurring variations. Recognising these variations through wave proportions, internal subdivisions, and Fibonacci relationships can help maintain a more objective and consistent wave count.
This observation represents a recurring market behaviour identified through extensive chart studies and is intended for educational purposes.
This is for educational purposes only and not a buy or sell recommendation.
 Education
XAUUSD: ABC Pullback Before Next Buying MoveGold has just made a strong upside move and is now showing signs of short-term exhaustion near the upper area. From Kelly’s view, the main trend is still constructive, but price may need a corrective ABC pullback before the next bullish continuation becomes cleaner.
The key idea is simple: gold is still bullish, but buying after a correction is safer than chasing near the top.
⟡ Market structure
The chart shows gold pushed strongly from the 4,150–4,160 area and completed a short-term Elliott wave 5 near the upper zone around 4,290–4,310. After this strong rally, the market is now reacting around 4,272.
This reaction does not mean the bullish trend is over. It may simply be the start of a healthy correction. The first important liquidity zone sits around 4,220–4,230. If price pulls back into this zone and buyers defend it, gold may create wave A and wave B before continuing higher.
If the correction becomes deeper, the stronger zone to watch is 4,155–4,165, marked as the possible End wave ABC area. This level is also close to the rising trendline, making it an important support base for the next bullish setup.
➤ Key levels
◌ 4,272: current price reaction area
◌ 4,290–4,310: recent wave 5 high and short-term resistance
◌ 4,220–4,230: liquidity zone and first pullback support
◌ 4,155–4,165: End wave ABC / major buy reaction zone
◌ 4,320: next bullish extension if price breaks the recent high
◌ Below 4,150: area where the bullish setup starts to weaken
⌁ Elliott Wave view
From an Elliott Wave perspective, gold appears to have completed a bullish 5-wave impulse after the strong breakout.
Wave 1 started the recovery from the lower base.
Wave 2 corrected but respected the bullish structure.
Wave 3 delivered the strong expansion move.
Wave 4 created a small pullback before continuation.
Wave 5 has now pushed gold into the upper area, where price is showing rejection.
After a completed wave 5, an ABC correction is normal. Wave A may pull price back towards the 4,220–4,230 liquidity zone. Wave B may create a small rebound. Wave C may complete near 4,155–4,165 if the market needs a deeper reset.
If that support holds, gold may prepare for the next bullish continuation phase.
▸ Trading scenario
Preferred scenario: wait for gold to correct into support and show bullish confirmation.
Entry zone 1: 4,220–4,230 if bullish reaction appears
Entry zone 2: 4,155–4,165 if deeper ABC correction happens
Stop loss: below the confirmed wave C low or below 4,150
Take profit 1: 4,272
Take profit 2: 4,290–4,310
Take profit 3: 4,320+ if bullish momentum continues
Alternative scenario: if gold breaks below 4,150 with strong bearish pressure, the ABC correction may become deeper. In that case, the bullish continuation setup needs to be reassessed before looking for another buy.
⌁ Kelly’s view
For Kelly, gold remains in a bullish structure, but the market is now too close to the upper reaction area to chase blindly.
The cleaner plan is to wait for the ABC correction. If price pulls back into 4,220–4,230 or deeper into 4,155–4,165 and buyers defend the zone, the next bullish move may continue.
Gold may correct first.
If the support zones hold, the bullish trend can continue again.
Share your view below. Short 


