GOLD: Further levels using Elliott Wave TheoryWe successfully forecasted the path of gold in our post on May 12th.
Now, GOLD is looking like it's entering an impulse wave.
Wave (1) of this impulse was completed on 23rd May. The price then falls between the zone 38.2% and 50% to form wave (2). This was also predicted by us.
Currently, GOLD is in wave (3).
Now, to get the targets of wave (3), we have two possibilities.
1. Wave (3) goes to 100% and then reverses. This case is of the Terminal impulse. And the further path of GOLD can be pr
Elliott Wave
OIL INDIA LTD – Structure Tiring as Crude Starts Firing?What began as a heroic rally from ₹42 to ₹767 in a powerful impulse now finds itself wobbling under its own weight. OIL INDIA LTD’s chart tells a story of exhaustion — both structurally and contextually — just when crude oil is flexing again on the global stage.
Amid rising geopolitical tensions and war-like murmurs pushing crude prices higher, the Indian oil sector may be sailing into headwinds. And this isn’t just a macro hunch — the waves themselves are flashing caution.
After a Wave 1 clim
Gold 4 hour Elliot Wave AnalysisThe current state of the market shows that we are in Wave 3. This is currently at 1.618 of Wave 1 possibly making one alert to near the end of this. This is being confirmed by liquidity sweep on the 1 hour time frame at the top. We can enter Wave 4 which shows a 500 pip decline to near 3380 levels. Post this we will start Wave 5 which can take us to 3515 levels which will be Fibonacci extension of 1 of Wave 3. After this it is possible to see a big fall. Will update when we get there.
#Banknifty directions and levels for June 13th:Current View
The current view suggests that if the market sustains the gap-down and breaks immediate support levels, we can anticipate further continuation of the correction, possibly with some consolidation.
Alternate View
The alternate view suggests that if the gap-down does not sustain and the market experiences a solid pullback, it may re-enter a range-bound scenario. This means that until it breaks the 23% Fibonacci level, the market is likely to maintain its bearish sentiment. However,
#Nifty directions and levels for June 13th:"Good morning, Friends! 🌞
Here are the market directions and levels for June 13th:
Market Overview
Several external factors have led to a significant decline in both global and local markets this morning. Consequently, Gift Nifty is indicating a negative start of 280 points.
So, what can we expect today?
Based on current sentiment, if the market opens with a large gap-down, the overall bias will shift to negative. However, this could be a temporary scenario, and it's difficult to predict ho
The Silent Power of Wave 4: Why You Shouldn’t Ignore TrianglesMarkets often scream during impulse waves but whisper during corrections. Yet it’s in those quiet phases—especially Wave 4 corrections—that the next big move is born. HERO MOTOCORP’s current price action may just be one of those setups that rewards the patient.
Spotting the Triangle in Wave 4
After a strong Wave 3 high at ₹4,454.60, the price began consolidating. Instead of a sharp drop, a sideways grind with overlapping price action began unfolding—classic signs of a triangle possibly formin
#Nifty directions and levels for June 12th:Good morning, Friends! 🌞
Here are the market directions and levels for June 12th:
Market Overview
Today as well, there have been no major changes in either the global or local markets. Both are showing a moderately bullish sentiment. Meanwhile, Gift Nifty indicates a neutral to slightly gap-up start of around 30 points.
So, what can we expect today?
There’s still no change in the market structure—Nifty is showing a moderately bullish bias, while Bank Nifty is showing a bearish bias. This make
#Banknifty directions and levels for June 12th:Current View
The current view suggests that if the market reaches the immediate support level with a gradual movement, we can expect a bounce back, which would mean it may continue to hold a moderately bullish sentiment.
However, if it declines sharply and consolidates or breaks the immediate support level decisively, then it could enter a correction phase.
Alternate View
The alternate view says: if the gap-up sustains structurally, we can expect only a minor rally. However, if a solid bullish
CDSL: Elliott Wave AnalysisThe CDSL daily chart indicates that the stock is in an impulse.
See the counting using Elliott Wave theory where the major wave (2) (shown in red) bounced from the 81.2% level to enter into wave (3).
The subordinate of wave (3) are shown in blue colour, where we can see the subordinate wave (2) of major wave (3) bounced from 61.8%.
To get the possible projection of the subordinate wave (3), I have applied Fibonacci extension to it, and we can see the price is at 200% extension currently. If th
#Banknifty directions and levels for June 11th:Current View
If the market starts with a gap-up and sustains, we can expect consolidation near the previous high. If it then breaks above the previous high, we may see continuation of the rally.
Alternate View
If the gap-up does not sustain and the market breaks below the pullback zone effectively, we can expect the correction to continue. On the other hand, if the market finds support around the minor pullback zone, it may continue to trade in a range-bound structure
#Nifty directions and levels for June 11th:Good morning, Friends! 🌞
Here are the market directions and levels for June 11th:
Market Overview
There have been no major changes in both the global and local markets. They are still showing a moderately bullish sentiment. Meanwhile, Gift Nifty indicates a neutral to slightly gap-up start of around 30 points.
So, what can we expect today?
As per the structure, Nifty continues to hold a bullish bias, but Bank Nifty is showing a slightly negative bias. One more important point to note: today
#Nifty directions and levels for June 10th:Good morning, Friends! 🌞
Here are the market directions and levels for June 10th:
Market Overview
Both the global market and our local market are showing moderately bullish sentiment. Meanwhile, Gift Nifty indicates a gap-up start of around 60 points.
So, what can we expect today?
In the previous session, both Nifty and Bank Nifty opened with a gap-up but didn’t perform much afterward. Today’s structure seems somewhat similar, so my expectation is that the same kind of move might happen again
#Banknifty directions and levels for June 10th:Current View
> The current view suggests that if the market reaches the immediate resistance gradually and faces rejection there, we can expect a minimum retracement of 38% to 61% in the minor swing.
> In this case, if the market declines initially, it may consolidate for a while—similar to yesterday's performance.
Alternate View
> e alternate view says that if the market breaks the immediate resistance with a strong rally or consolidates around that level, we can expect the rally to continue
BUY GOLDIt is possible that there is a Buy opportunity . We should wait for confirmation before entering like 1H or 4H wick rejection in buy zone area and retest trand line . If the confirmation is negative, then we should exit the trade. If the confirmation is positive, then we can enter the trade.
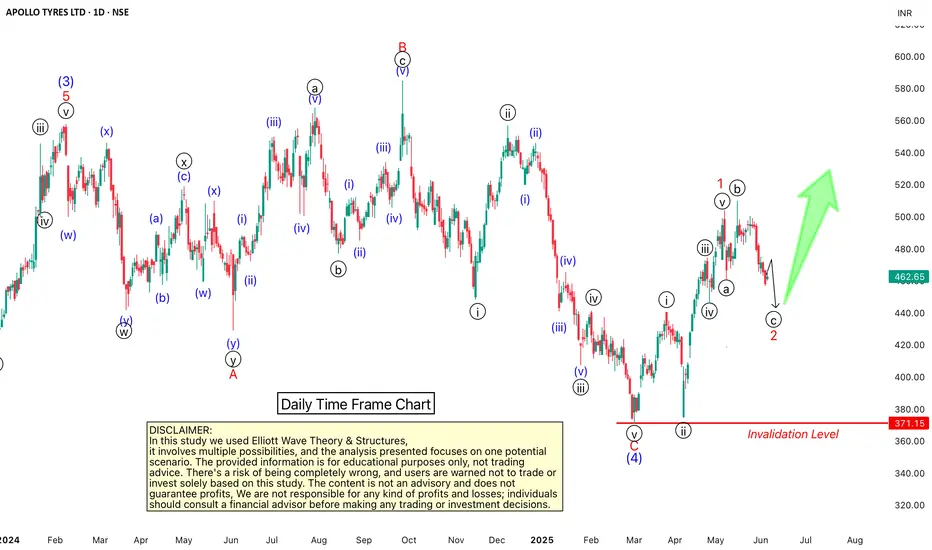
Apollo Tyres: Navigating the WavesWelcome to RK_Chaarts.
Today, we're analysing the daily time frame chart of Apollo Tyres from Elliott waves perspective. Here, we can clearly see that the intermediate-degree Wave (3) (blue) formed a high around ₹555 in February 2024. After that, an A-B-C corrective pattern unfolded in a 3-3-5 expanded flat structure, which is Wave (4) blue intermediate-degree. We can say that Wave (4) possibly ended at the March 2025 low around ₹370.
Now, we're possibly unfolding Wave (5) in blue of the inte
Waves Gone Wild: Understanding Complex CorrectionsUntangling the Mystery of Complex Corrections – A Simple Walkthrough Using CUMMINS INDIA
Ever wondered why the market suddenly becomes messy and confusing after a big rally? Welcome to the land of Elliott Wave corrections, where things aren't always a straight road—but if you know the signs, you won’t get lost.
Let’s break it down using a real chart – CUMMINS INDIA , where we can spot all types of corrections playing out like a drama series.
Step 1: Why Do Corrections Happen?
Corrections
Nifty - Elliot Wave UpdateNifty has been testing patience and not letting anyone take positional trades since mid of May.
24500 has acted as a crucial support - and as we come to re-test it today for the 3rd time, I thought of updating the view after my last post on May 15th, as we have a good RR long trade here.
We had two alternates:
1. We are in 5th up/ which got done, is about to be done. In this case we head down to 23500 or so and then we review if this bounce was corrective or we are going to ATH.
2. We did 1 an
CDSL – Leading Diagonal Kicking Off a Bullish Cycle?A possible new bullish impulse may be forming in CDSL, following a strong corrective downtrend.
From the ATH at ₹1989.80, the stock completed a 5-3-5 Zigzag correction that bottomed out at ₹1047.45. The final leg (Wave C) shows the characteristics of an Ending Diagonal , signaling possible exhaustion and the end of the correction.
From that low, the structure that follows appears to be a Leading Diagonal , possibly acting as Wave 1 of a new motive sequence. Despite its expanding nature,
Zigzag in Play- Can Wave C deliver the goods for ESCORTS KUBOTA?ESCORTS KUBOTA – A Zigzag Taking Shape
Structure Summary:
ESCORTS may be unfolding a classic Zigzag correction (5–3–5) from the low at ₹2,825.20. Wave A formed a clean leading diagonal. Wave B is currently developing and is expected to end near the 0.382–0.5 retracement of Wave A.
If this structure holds, we could soon see a powerful Wave C impulse aiming for the 4,000+ zone.
Elliott Wave View:
Wave A : Leading diagonal from ₹2,825.20 to ₹3,616.60
Wave B : Still developing – may comp
Forecast for Long Term for INJUSDT -- Current Market Overview --
Price (as of May 28, 2025): INJ/USDT is trading at approximately $15.01, with a 24-hour increase of 4.93–10.79% and a weekly gain of 23.1–24.94%.
# Market Sentiment: Recent Wave indicate bullish sentiment, with analysts noting a breakout from a monthly demand zone and support at a weekly fair value gap (iFVG). The price has broken a higher-time-frame (HTF) downtrend, suggesting potential for further upside.
Market Cap and Volume: INJ has a market cap of $1.5B and
Nifty’s Final Shakeout? Ending Diagonal May Be the Exit ClueNifty appears to be unfolding a WXY corrective structure:
Wave W ended at 24,462.40
Wave X bounced up to 25,079.20
The current decline looks like Wave Y, forming a classic ending diagonal
Ending Diagonal Details:
Overlapping waves with a contracting structure
Final Wave 5 of the diagonal may be unfolding now
Invalidation level (for stop-loss logic): 24,864.25
If price moves above this, the wave structure is likely invalid
Target Zone:
Wave 5 projected to complete betwee
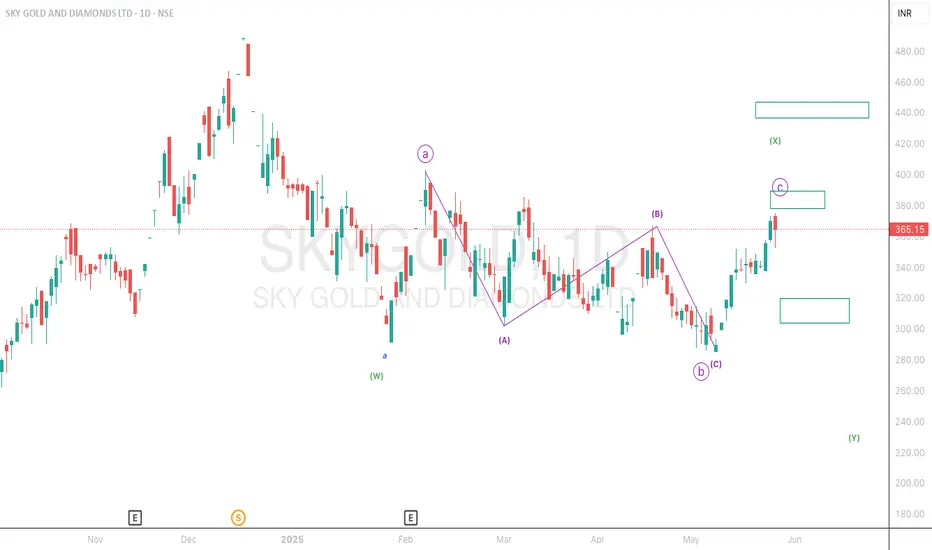
Too cloudy in sky gold and diamond..A consolidation phase is going on. as of now this script having correction or pullback value of 78.6% as its nature.
We need to wait and watch till the clouds disappear..
i am not a SEBI registered advisor. Before taking a trade do your own analysis or consult a financial advisor. I share chart for education purpose only. I share my trade setup.