Long
Long
 Long
Long
Evaluating Trend and Momentum Alignment with EMA & RSI🔎 Intro / Overview
This idea presents an EMA + RSI Alignment Framework designed to help traders understand market conditions rather than chase price movements.
Often, traders feel they have “missed the move”.
In most cases, this happens not because of late entries, but because market context was not clearly defined beforehand.
This framework focuses on evaluating trend direction and momentum quality first, so traders can better understand when conditions were supportive, unclear, or weakening.
⸻
📔 Concept
Indicators are frequently misused when applied in isolation.
This framework assigns clear and specific roles to each tool:
• EMA defines trend bias, not support or resistance.
• RSI measures momentum quality, not overbought or oversold levels.
A market environment is considered valid only when EMA and RSI are aligned.
When alignment is missing, price movement alone is treated as low-quality information.
This shifts focus away from prediction and toward environment assessment.
⸻
📌 How to Use
The framework is applied through three structured steps:
1. Identify Trend Bias (EMA)
• Price holding above EMA → bullish environment
• Price holding below EMA → bearish environment
• Price frequently crossing EMA → unstable environment
2. Assess Momentum Quality (RSI)
• RSI holding above 40 → supportive bullish momentum
• RSI holding below 60 → supportive bearish momentum
• RSI fluctuating around 50 → momentum instability
3. Confirm Alignment
• EMA + RSI aligned → valid market environment
• EMA + RSI misaligned → low-quality environment
This framework is used strictly for evaluation and learning, not execution.
⸻
📊 Chart Explanation
• Bullish Alignment Zone
Price holds above EMA while RSI confirms stable bullish momentum.
• No Alignment Zone
EMA flattens and RSI becomes unstable, indicating a low-quality environment.
• Bearish Alignment Zone
Price holds below EMA while RSI confirms bearish momentum.
The RSI panel is used only for confirmation, never for signal generation.
⸻
👀 Observation
Many traders feel they missed a move only after alignment has already occurred.
This framework helps visualize:
• When alignment was present
• When conditions became unclear
• When momentum weakened
Understanding this sequence helps traders learn from price behavior instead of reacting emotionally to it.
⸻
❗ Why It Matters?
Market movement alone does not equal opportunity.
By learning to recognize alignment vs misalignment, traders can:
• Avoid chasing price after moves are over
• Stay out of choppy or unstable conditions
• Build patience and contextual awareness
Context is often the difference between consistency and frustration.
⸻
🎯 Conclusion
The EMA + RSI Alignment Framework is a context-first approach to understanding market behavior.
It does not attempt to forecast future price moves.
Instead, it explains why certain environments supported movement and why others did not.
This makes it a valuable educational tool for developing disciplined, structured market understanding.
⸻
⚠️ Disclaimer
📘 For educational purposes only.
🙅 Not SEBI registered.
❌ Not a buy/sell recommendation.
🧠 Purely a learning resource.
📊 Not financial advice. Market View & Trade PlanBased on current structure, NIFTY is trading inside a rising channel on both 5-minute and 15-minute timeframes, with short-term price action forming a potential bullish cup-and-handle pattern on the 5-minute chart. Momentum indicators and price behavior suggest a bias toward the upside as long as the index holds above the channel support zone. A buy-on-breakout can be considered above 26,175–26,185, with an initial stop loss below 26,110 (below the handle low and channel support). On confirmation, the upside potential lies toward 26,240 / 26,300, while a failure to hold the channel could open a downside move back toward 26,080–26,040.
Risk Note & Probability View
The bullish scenario remains valid only if price sustains above VWAP and the short-term EMA cluster; rejection from the upper channel or a breakdown below support will invalidate the setup and shift the bias to neutral-to-bearish. This is a probability-based trade, not a prediction — execution discipline and risk control matter more than direction.
Disclaimer: I am not a SEBI-registered research analyst. This view is for educational and informational purposes only and should not be considered investment advice. Please consult a qualified financial advisor before taking any trade decisions.  Long
Long
EMA 50 + RSI Divergence = Gold Reversal Setup!Hello Traders!
Gold often makes sharp one-sided moves, trapping traders who enter too late. But if you know how to combine a simple moving average with a momentum indicator, you can spot high-probability reversal setups.
One such method is using the EMA 50 together with RSI Divergence . Let’s break down how it works.
1. Why EMA 50?
The 50-period EMA acts as a dynamic trend filter.
When gold trades above it, the short-term trend is bullish; below it, bearish.
Price often retests the EMA 50 during pullbacks, making it a key level to watch for reversals.
2. What is RSI Divergence?
Divergence happens when price makes a new high/low, but RSI doesn’t confirm it.
Example: Price makes a higher high, but RSI makes a lower high → bearish divergence.
This signals that momentum is weakening, even if price is still moving strongly.
3. Combining EMA 50 with RSI Divergence
First, check where price is relative to EMA 50.
Next, look for divergence on RSI near that zone.
If both align (price struggling at EMA 50 + RSI divergence), chances of a reversal increase sharply.
4. Entry & Risk Management
Wait for a confirmation candle near EMA 50 (like engulfing or pin bar).
Place stop loss just above recent swing high/low.
Target the next support/resistance zone for exits.
Rahul’s Tip:
Don’t use divergence alone, combine it with EMA 50 for structure and you’ll filter out most false signals. This setup works best on higher timeframes like 1H or 4H for gold.
Conclusion:
EMA 50 gives you the trend filter, and RSI divergence reveals momentum weakness.
Together, they form a reliable reversal setup that helps you enter gold trades at the right time instead of chasing moves.
This Educational Idea By @TraderRahulPal (TradingView Moderator) | More analysis & educational content on my profile
If this post gave you a new setup idea, like it, share your thoughts in comments, and follow for more practical trading strategies!  Education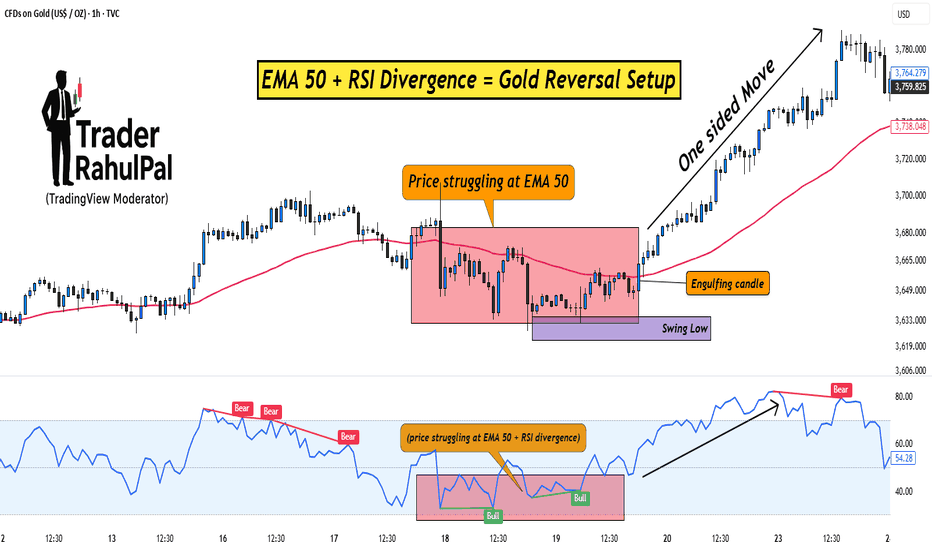
 Long
Long
 Long
Long
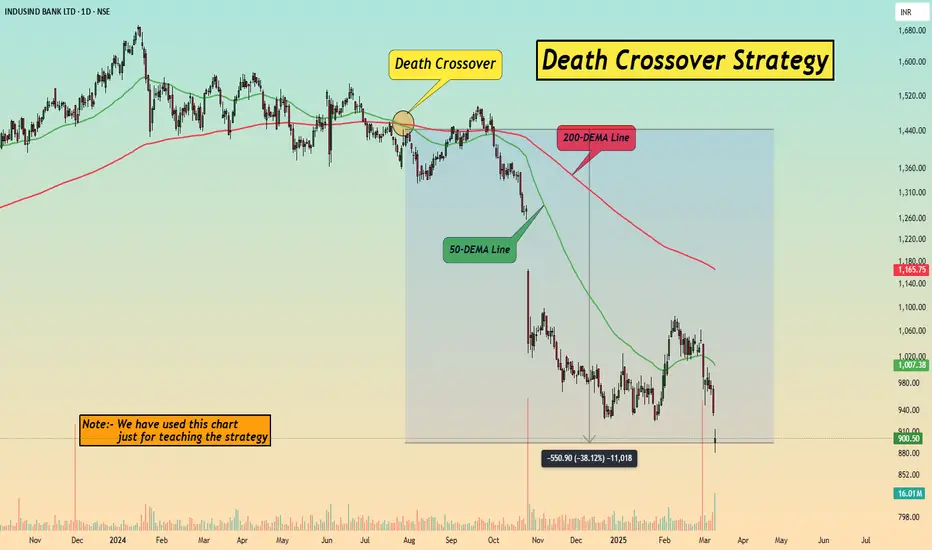
Death Crossover Strategy Explained with 50-EMA & 200-EMA line.Hello Traders! In today's post, we’ll explore the Death Crossover Strategy , a highly effective technique used by traders to identify potential trend reversals. This strategy involves the 50-EMA (Exponential Moving Average) crossing below the 200-EMA , which is considered a bearish signal.
In this chart of IndusInd Bank Ltd., we can clearly see the Death Crossover in action. The 50-EMA (green line) has crossed below the 200-EMA (red line), signaling a potential downtrend.
Key Insights:
Death Crossover : Occurs when the short-term moving average ( 50-EMA ) crosses below the long-term moving average ( 200-EMA ), suggesting the beginning of a downtrend.
Volume Confirmation : A sudden increase in volume after the crossover confirms the strength of the signal. In this case, the volume spike at the crossover indicates a strong bearish momentum.
Target Areas : After a Death Crossover , look for potential support levels to target as the price moves lower. In the chart, we can see how the price retraced and then continued its downward journey.
Price Action Post-Crossover:
In this example, the stock dropped by approximately -38.12% after the Death Crossover , highlighting how powerful this signal can be in catching major trend reversals.
Risk Management :
Stop Loss : To protect your capital, always use a stop-loss order just above the 50-EMA (green line) when entering a short trade after the crossover.
Position Sizing : Keep your position sizes small in trending markets to manage risk and ensure a favorable risk-to-reward ratio.
Note: We have used this chart just for teaching the strategy and its potential impact.
This is a great strategy to catch long-term downtrends, but as always, remember to use it alongside other technical indicators and fundamental analysis to increase your chances of success.
Happy Trading!
 Education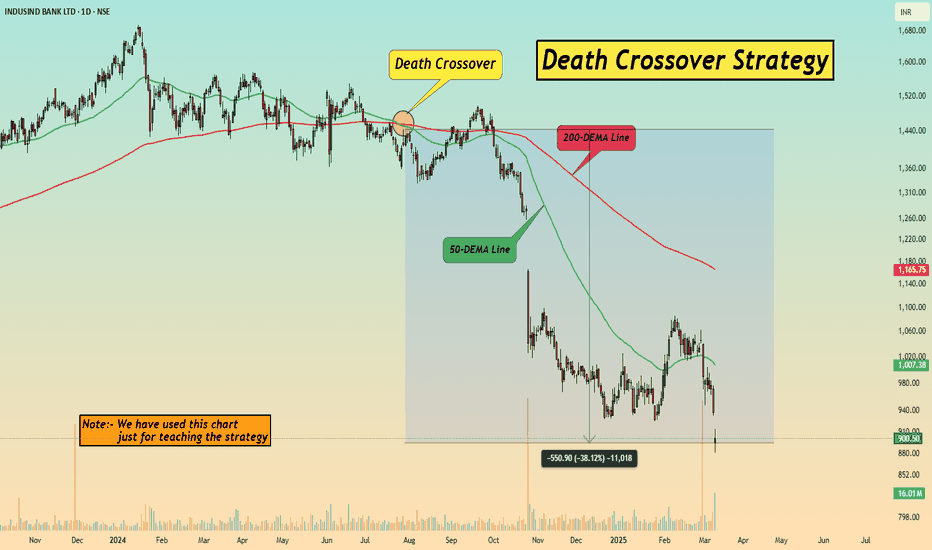
 Long
Long
 Long
Long
 Long
Long
 Long
Long
 Long
Long
 Long
Long
 Long
Long
 Long
Long
 Long
Long
 Long
Long
 Long
Long
 Long
Long