btc finds 200 ema support, whats next?As I have been posting in these "Ideas" for the past few weeks about market direction and where the price for BTC will go. It now has come to pass where the 200 EMA has been tested and support has been found, It however has not generated any relief among buyer sentiment unable to push price above the previous days close leaving the digital asset to continue to bleed out and cause positions from all the 93k Bulls to liquidate.
Its a shame people cannot make the connection that the only way
Exponential Moving Average (EMA)
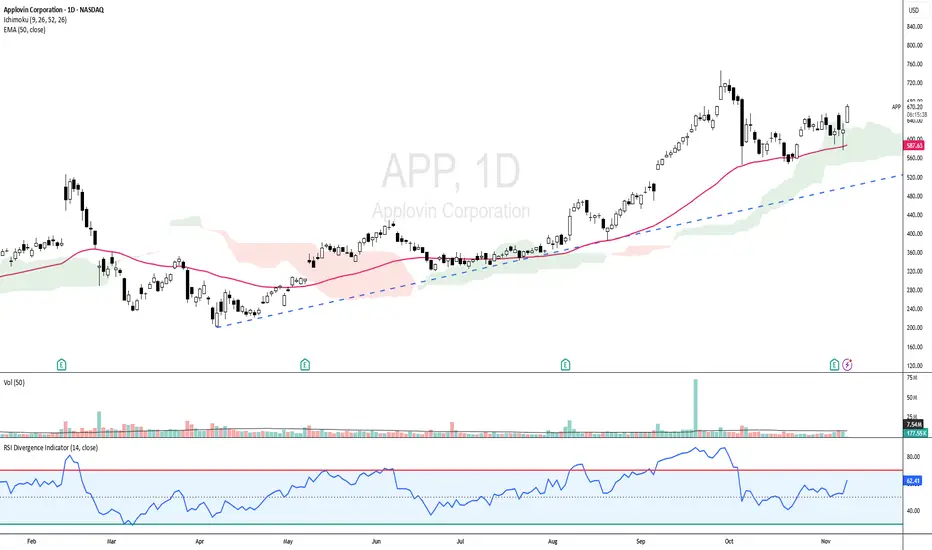
APP - UPTREND STILL INTACT!APP - CURRENT PRICE : 670.00 - 674.00
APP is showing strong bullish momentum as the price trades above the 50-day EMA and ICHIMOKU CLOUD , indicating a sustained uptrend. The RSI is in bullish territory but not yet overbought, indicating room for further upside. With the current setup, the stock has potential to retest its all-time high area if momentum continues.
ENTRY PRICE : 670.00 - 674.00
FIRST TARGET : 727.00
SECOND TARGET : 770.00
SUPPORT : 50-day EMA
ANET - Rebounds from EMA 50ANET - CURRENT PRICE : 148.00 - 149.00
Technical Rationale:
1. Rebound from Key Moving Average Support
The stock price has rebounded strongly from the 50-day EMA, which has acted as a dynamic support level throughout the uptrend. This rebound indicates renewed buying interest at a technically significant area.
2. Bullish Momentum Confirmation
ANET has crossed above the 20-day SMA, suggesting a short-term shift back to bullish momentum after a healthy pullback. This crossover reflects improvi
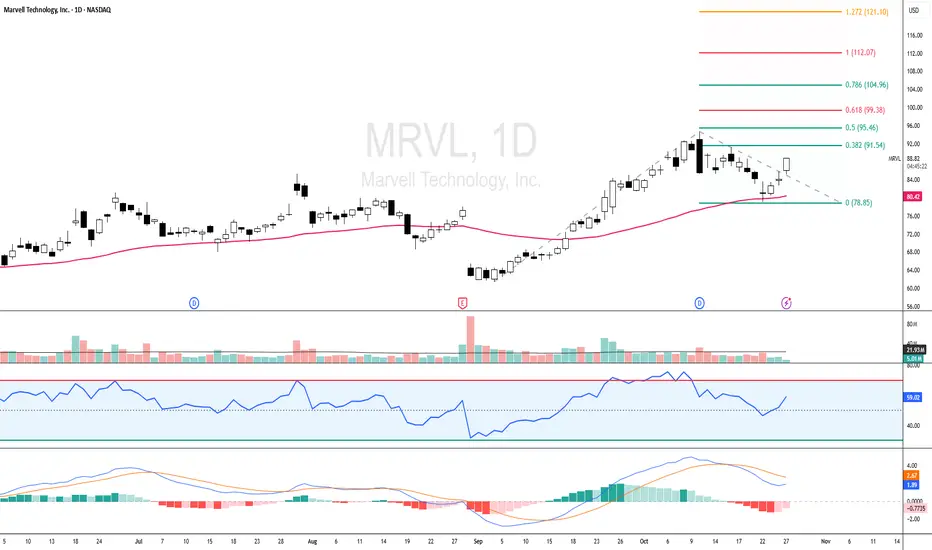
MRVL - RSI Back Above 50, Eyes Fibonacci Targets at 99 and 112MRVL - CURRENT PRICE : 86.00 - 88.00
MRVL is showing early signs of bullish continuation after finding support near the 50-day EMA and rebounding with positive momentum. The price structure remains healthy as it trades above the EMA 50, suggesting the medium-term trend is still intact.
Key Technical Highlights :
1) Price Above EMA 50
The stock price is holding above the EMA 50, showing that the uptrend remains valid and buyers are still in control.
2) RSI Above 50 and Not Overbought
RSI has
DRIFT Breakout Setup – Higher High + Retest in PlayDRIFT is showing strong bullish momentum after months of accumulation. The token has broken out, printed a higher high, and is now retesting the previous range high as support — a classic setup for continuation.
With price hovering near the 21-day EMA, this zone could act as a launchpad if sentiment holds. The structure supports a potential leg higher, making this a high-reward, low-risk opportunity for swing traders.
🔹 Trade Setup
Entry Zone: $0.68 – $0.72
Take Profit Targets:
🥇 $1.02
🥈 $1.2
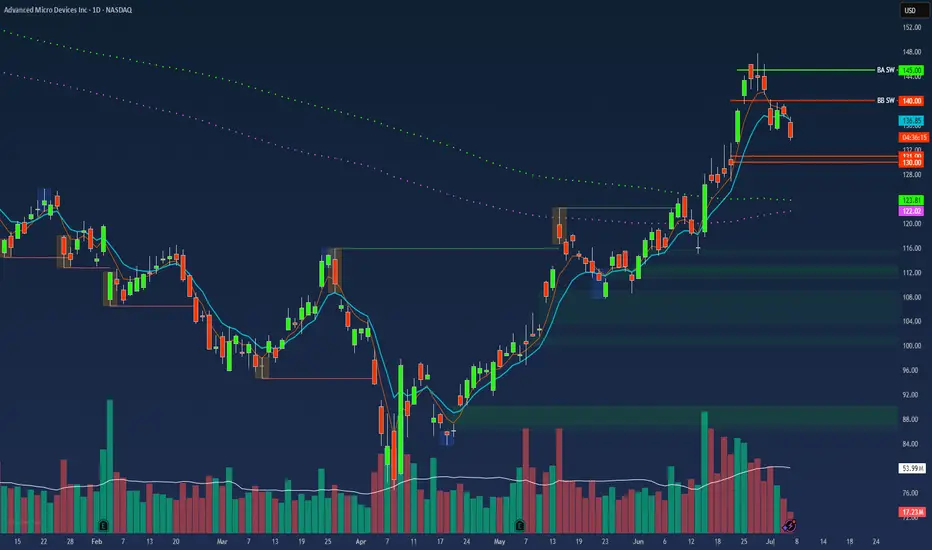
$AMD Swing Trade – Put Debit Spread Setup🔻 NASDAQ:AMD Swing Trade – Put Debit Spread Setup (Jul 18 Exp)
📅 Trade Opened: July 3, 2025
🛠 Strategy: Buy to Open (BTO) Put Debit Spread
📉 Strikes: $31 / $30 (Jul 18 Expiration)
💵 Cost (Premium Paid): $0.21
🎯 Trade Thesis
This setup aims to capture short-term downside in NASDAQ:AMD via a low-cost, defined-risk spread. The trade fits within my broader portfolio of OTM spreads under $0.25.
Key Drivers:
🔻 Semi sector under pressure – NASDAQ:AMD showing relative weakness.
📉 Breakdown bel
$LYFT Swing Trade – Low-Cost Call Debit Spread Setup🚗 NASDAQ:LYFT Swing Trade – Low-Cost Call Debit Spread Setup (Jul 18 Exp)
📅 Trade Opened: July 3, 2025, 2:53 PM
🛠 Strategy: Buy to Open (BTO) Call Debit Spread
📈 Strikes: $16.5 / $17.5 (Jul 18 Expiration)
💵 Cost (Premium Paid): $0.25
🎯 Trade Thesis
This swing trade targets a short-term bullish move in NASDAQ:LYFT based on improving fundamentals and favorable technical setup. The structure uses a low-cost OTM call spread to define risk and limit exposure while capturing directional potentia
GBPUSD: Potential Reversal After Strong RallyThe British Pound has shown strong gains against the US Dollar, approaching a key resistance area. After such an extended move, a correction or reversal would be a logical expectation.
Technical Setup
There is a clear series of bearish divergences on the CCI (14) indicator. Price is forming a narrowing rising wedge, which often signals trend exhaustion.
Trade Plan
Sell limit orders: 1.3690 and 1.3850
Market entry: Only after confirmation — either a trendline break or a moving average crossov
AAVE (Aave): 100EMA Holding Price Down | Another Sell Incoming?Aave is seeing a good decline in price after each touch of the 100EMA, which we recently had again. We are going to look here for a decent movement to lower zones, which should give us at least 15% of market price movement; this, of course, only as long as we stay below the EMAs.
Swallow Academy
EICHERMOT (NSE) – Bullish Setup on 15min & 1H🔑 Trade Plan:
📥 Buy Above: ₹5485 (above current resistance & candle body highs)
🎯 Targets:
T1: ₹5527 (Pivot R1)
T2: ₹5555
🛡️ Stop Loss: ₹5380 (below 13 EMA & Supertrend support)
📊 Technical Signals:
RSI: 58.08 – Bullish momentum, still room to run
%B (BB): 0.77 – Close to breakout from upper band
EMA Crossover: 9 EMA > 13 EMA – Short-term bullish crossover confirmed
Supertrend: Support at ₹5322, aligning with bullish reversal
Volume: Spike during recent green candles signals strong buyi
ADANI Enterprises Ltd..... Seems to hv finally broken out.ADANI Enterprises Ltd..... Seems to hv finally broken out of the 38.2 % Fib Resistance, 2 days in a row (most likely). This is the third time its trying to break out of this zone. It's crossed the 50 ema & nearing the 200.
Needs to take out 2497, the recent high on a closing basis for a smoother ride up.
Am Bullish on the stock, one more reason being its subsidiary ' KUTCH COPPER ' which is to begin production full fledged very soon. Lets See.
RSI 101: The Secret of RSI’s WMA45 Line and How to Use ItIn my trading method, I use the WMA45 line together with RSI to help spot the trend more clearly.
Today, I’ll share with you how it works and how to apply it — whether you're doing scalping or swing trading.
Why WMA45?
WMA (Weighted Moving Average) is a type of moving average where recent prices are given more importance.
WMA45 simply means it takes the average of the last 45 candles (could be 45 minutes, 45 hours, or 45 days depending on your chart).
Because it moves slower than RSI, it he
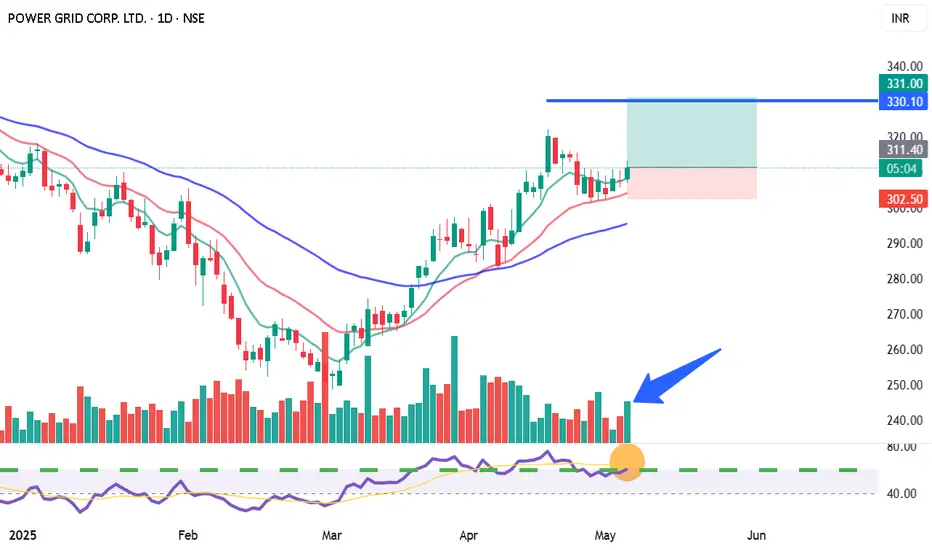
POWERGRID – Breakout Setup with Volume Spike📍 Entry Zone: ₹310.10 – ₹311.10
🎯 Target: ₹330.00
🛑 Stoploss: ₹302.00
📈 RSI has crossed above 60, volume confirms breakout momentum (🔵 arrow), and price is supported above key EMAs.
🔍 Strong bullish structure with clear higher lows and a clean breakout candle. Momentum shift confirmed with increasing volume.
For Education Purposes Only
Nifty - moderation of +ve momentum seen on short period charts.Nifty closed with over 1% 21 VWMA was rising, Nifty respected SD+2 resistance today.
23298, 23395 resistance levels for tomorrow.
SD+1 or 23057 acted as major support today, any breach below this and sustaining lower will signal some weakness.
23730 major pivot, as long as this is help, uptrend is intact, and Nifty is in buy on dips.
24060, 23930, 23875, 23790, 23760 major support levels.
$INJ: Preparing for a Possible Impulsive Move UpCRYPTOCAP:INJ – Setting Up for a Potential Impulsive Move
After a sharp correction, CRYPTOCAP:INJ may be preparing for a strong rebound.
In a previous idea, I forecasted a bottom at $8.5 — and it dipped even lower to $7, fully retracing last year's pump.
The price broke below the bearish flag after a clear bearish divergence at the top. It also sliced through my green buy zone and is now sitting right on a critical support level at $8.40.
🚀 Signs of recovery are starting to show:
🔹 MACD
$ONDO: Potential Reversal in SightLSE:ONDO : Potential Reversal in Sight
Signs suggest that LSE:ONDO may have reached the bottom of its consolidation phase, having fully retraced to its August 2024 lows. Momentum is shifting:
MACD is climbing toward the median — a breakout above could signal the start of an explosive uptrend.
RSI remains neutral, leaving room for a strong move in either direction.
Volume is near all-time lows, often a precursor to a breakout.
If the projected move plays out, the next resistance levels (ba
GOLD - Day Trading with RSI 04/03/2025FX:XAUUSD
Daily Timeframe (D1): Still in a strong uptrend, with RSI and both moving averages are pointing upwards. The WMA45 is above 60.
4-Hour Timeframe (H4): RSI is positioned between the resistance created by WMA45 (current price around 3152) and the RSI 60 support level (current price around 3121).
1-Hour Timeframe (H1): The WMA45 is trending upward, supporting the bullish trend.
Trading Plan: BUY
Entry Zone:
When the RSI on the M15 timeframe is supported at the 50 or 60 leve
GOLD - Day Trading with RSI 04/02/2025
Weekly and Daily Timeframes (W & D):
GOLD is still in an uptrend, as the RSI's WMA45 is still hovering near the 70 level, and RSI remains above both of its moving averages.
H4 Timeframe:
This timeframe is currently showing a correction. However, it's not yet considered a downtrend because the WMA45 is still in the high region, close to the 70 level. But, RSI has dropped below the WMA45.
At present, the RSI on H4 is facing dynamic resistance from the WMA45 above and has support around the
GOLD - Day Trading with RSI 04/01/2025FOREXCOM:XAUUSD
D and H4 Timeframes:
GOLD is in a strong uptrend.
RSI is operating around the 80 level, indicating that buying pressure is 4 times stronger than selling pressure.
Priority: Trade in the direction of the trend on higher timeframes.
H1 Timeframe:
GOLD is showing signs of a correction: EMA9 has crossed below WMA45, and RSI is positioned below the two MA lines.
Given the current slope of WMA45 on the H4 RSI, this correction is considered minor for now.
Intraday Trading P
USDJPY Setup: SHORT on 200 EMA Rejection📉 Best Risk/Reward Setup: SHORT on 200 EMA Rejection
🔻 Entry: Sell in the 148.50 - 148.80 zone after rejecting the 200 EMA (⚪)
🎯 Take-Profit (TP1): 146.50 (RRR: 5:1)
🎯 Take-Profit (TP2): 145.00 (RRR: 9:1)
🛑 Stop-Loss (SL): 149.20
📊 Market Overview & Bias
🟥 Bearish Outlook (Macro Trend - Daily & 4H)
✅ USD/JPY remains in a clear downtrend, trading below the 200 EMA (⚪).
✅ Price has consistently rejected the 100 EMA (🟡) as resistance.
✅ Lower highs and lower lows are forming on the daily & 4H
$AFRM $70 target into retest $80, pt. 1 chartI wish you could post multiple charts in the same size so you can see and I don't have to post twice. I looked at the D and W. This name should see it's IPO highs at some point this year, with the volatility it could be sooner than later as well. Resistance, in my opinion, looks to be $80 zone, a psyche area as well -- dating back to 3/2021, 1/2022, 2/2022, and 2/2025. Looks like $45-$50 which was once resistance now flipped to support. It touched the 200sma and riding the 200ema. & There almost
Bitcoin - 200 EMA is holding Strong#BTC #Analysis
Description
---------------------------------------------------------------
+ Bitcoin has successfully tested the 200 EMA line and rebounded effectively.
+ However, caution is still advised, as the price may revisit the EMA support line.
+ The strong performance of the EMA is a positive indicator, suggesting the bullish trend could persist after a few retests.
---------------------------------------------------------------
Enhance, Trade, Grow
---------------------------