Exponential Moving Average (EMA)
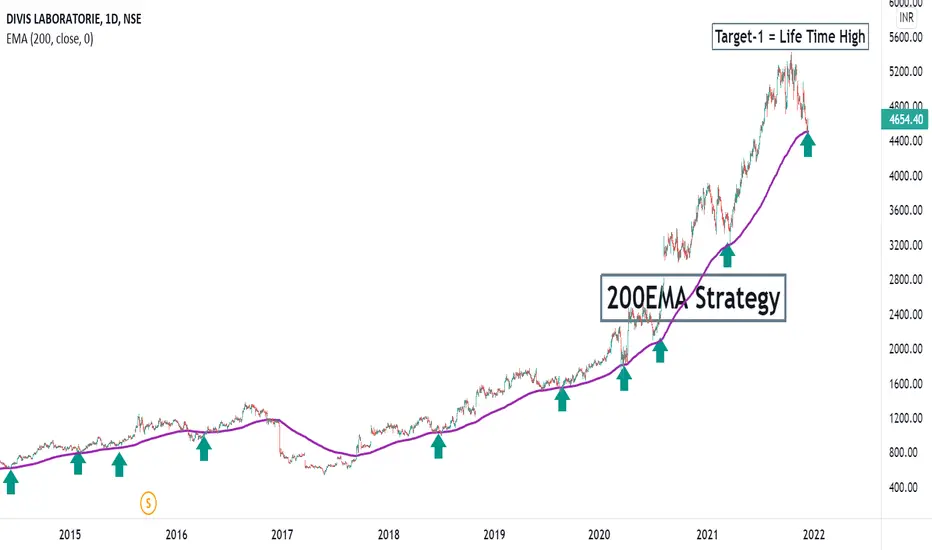
DIVISLAB - Swing Trade - 200EMA supportThe analysis is done on Daily TF hence price may take few days to few weeks in order to reach the targets.
Trade logic is based on simple 200EMA strategy (explained in image itself).
The above analysis is purely for educational purpose. Traders must do their own study & follow risk management before entering into any trade
Checkout my other ideas to understand how one can earn from stock markets with simple trade setups. Feel Free to comment below this or connect with me various platforms for any query or suggestion regarding this stock or Price Action Analysis.
THIRUMALAI CHEMICALS - Retest1. Price formed Big Round Bottom pattern from Jan 2018 to Sep 2021
2. Stock rallied 40% after breakout from big round bottom pattern.
3. Price retraced to breakout zone and trading at support.
4. Also, price took support at EMA 20.
Good Opportunity for Swing trade with long setup - good R:R 2.7
Entry: 246-250
Target: 335
SL: 213 (Weekly Closing Basis)
ONGC Can fly after taking support in descending channel patternONGC is continuously making a descending channel pattern from 173. After breaking the 20 and 50 days EMA now it is about to touch 100 days EMA and this could work as a strong support for ONGC as there are both supports available at 138 . 1st is Descending channel pattern's trend line and 100 Days EMA also running around 138. You can take entry in it according to provided details on charts.
you can hold this scrip for medium term target of 172 if it cross the level of 153 with good volume and retest.
NTPC long we can go long in NTPC due to following reasons --
Came out of pattern in weekly and daily timeframe .
retest done at both weekly and daily timeframe .
In daiy timeframe about to give breakout of a trendline .
we can go long at that point
Also at daily timeframe took a support at 100EMA .
All the ideas are just for learning purpose. I'm not any call provider or a sebi registred person .
Gati - BullrunGati is looking very strong here.
Near to 200 EMA &strong volumes from past few sessions. In my view we can easily witness levels of 190-200 levels in short run & 220+ levels in mid to long run
GLong
BAJAJCON retested breakout levelBAJAJCONS has a weekly trendline resistance and horizontal resistance at 270 level and it retraced to 230-236 level and started raising. once it closes above 270 on weekly next resistance is at 320 which coincides with 200WMA and horizontal resistance.
RSI also nearing 60, indicating bullish momentum.
it took support at 21EMA.
Coal INDIA | Round Bottom | Parallel Channel | Wedge pattern 🎯⭕ positional Trading opportunity ! Daily Chart Alert !!! ⭕
--Buy above =139 or CMP
--Target = 183.10
--Stop-loss =126.60
--Lot Size = 6100
--R:R = 3.52
--Expected Profit = 11,16,000 ₹ per lot (31.63 % )
--Expected Holding = 3-6 months only
#ThankU For Checking Out Our Content , We Hope U Liked IT 📌
======================================================
⭕ Technical Reasons to trade or Strategy applied :- ⭕
1) 200ema breakout & retracement .
2) rounded bottom pattern at all time low .
3) parallel channel breakout
4) wedge pattern as well .
5) Fundamental looks good & technical indications are in buy mode.
Guys check out the related ideas as well, it will work really well GUARANTEED !
🙏FOLLOW for more !
👍LIKE if think is useful !
✍COMMENT Below your view !
FLAG FORMATION (Price at Fibo 23.6 level and 9 day EMA Support)Positional Idea : LT has formed a flag on daily charts and price is taking support at Fibo 23.6 level and 9 day EMA, close above 1148 will confirm flag breakout, safe entry above 1177, post breakout flag target is 270 points.
Views for learning purpose only.